Brand Ambassador Program Slide Examples: How to Show It
How to show investors that a brand ambassador program sells, not just posts: active versus enrolled ambassadors, sales per ambassador.
Ambassador Program Slide: Show How Many Ambassadors Sell, What They Sell and What It Costs
Consumer brands often list a brand ambassador program as a growth channel: hundreds of ambassadors, millions of impressions, a community that spreads the word. Investors read those numbers as a question rather than an answer. How many of those ambassadors actually sold something, how much, and what did the program cost once free product, commissions and staff time are counted? This guide uses five real slides, from a beauty app that reports how many of its ambassadors sold and what its best seller earned, to slides that give a head count and nothing else.
TL;DR
Report active ambassadors as a share of enrolled ones, sales or sign-ups per active ambassador, how each sale is tracked, and the full cost of the program. Agora comes closest: 36 of its 132 ambassadors were selling, its top sellers had made £150, and a separate slide gives a 3% conversion rate. Modern Picnic says ambassadors drive 20% of yearly revenue at "$0 acquisition cost" without saying how sales are attributed or what ambassadors receive. The Hustle names the right tracking tool, a custom sign-up link for each ambassador, but reports no sign-ups from it. MySwimPro gives the program's budget but no result, and Bravo Sierra gives only a head count.
Seven ambassador program slides, read in full
Each example quotes the slide, separates the company's claims from what the slide shows, and notes what to copy and what to avoid.
Agora go to market slide — slide 8
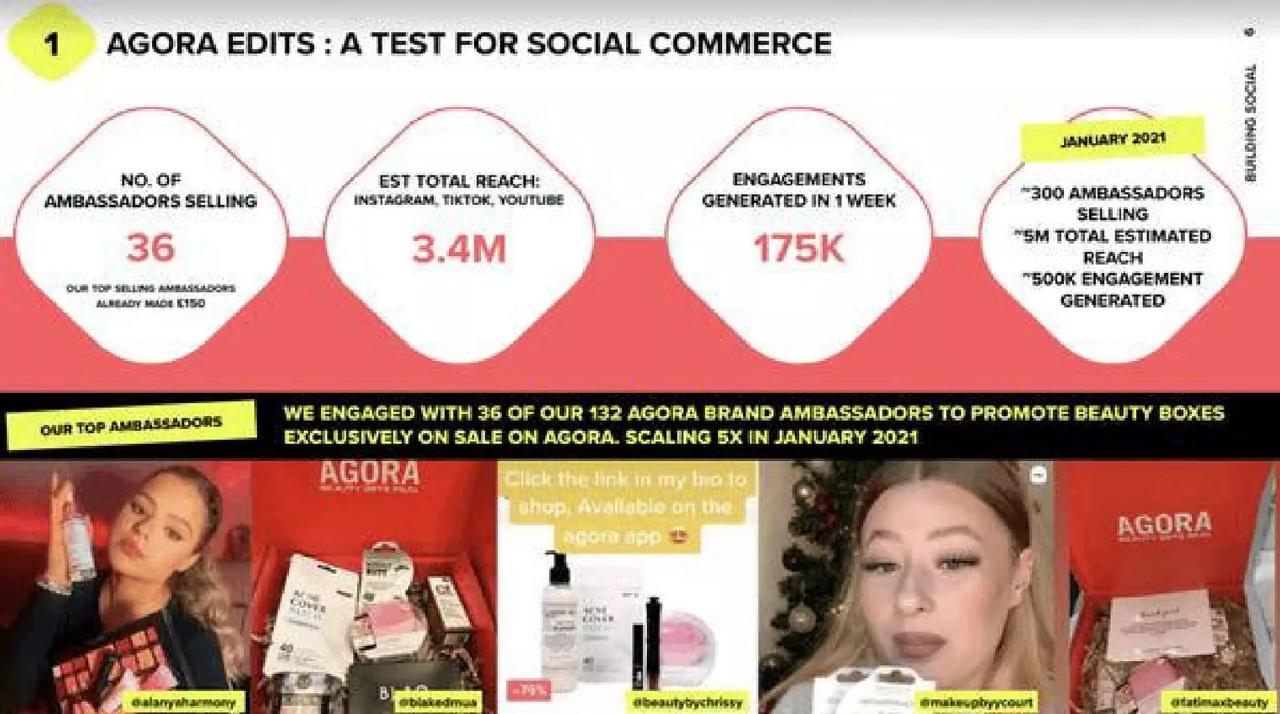
UK beauty and social commerce app. Slide titled "Agora Edits: a test for social commerce".
Agora deck, slide 8. Exact stored slide matched to this analysis.
Our analysis: 36 of 132 is 27% active (our calculation). 36 x 5 = 180, but the target is ~300, more than the 132 enrolled.
Evidence and limitation: Company figures; reach and engagement are estimates; no total sales.
What a founder can adapt: Add total or median sales per active ambassador and say how the target will be recruited.
Supporting analysis
What the deck claims: "No. of ambassadors selling 36"; "our top selling ambassadors already made £150"; "Est total reach 3.4M"; "Engagements generated in 1 week 175K"; "We engaged with 36 of our 132 Agora brand ambassadors"; January 2021 target "~300 ambassadors selling".
Presentation choice: Separates active from enrolled ambassadors and gives a sense of earnings per seller.
When it does not fit: Top-seller earnings presented without the typical figure.
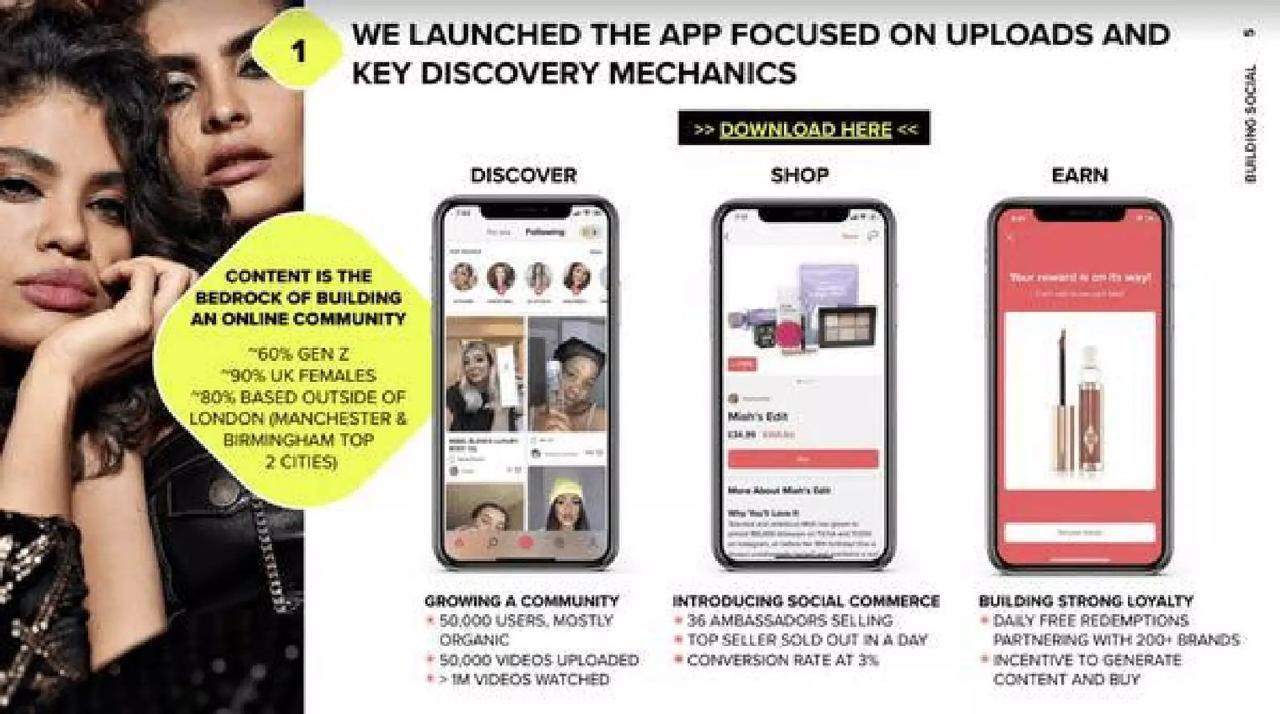
Same company. Slide titled "We launched the app focused on uploads and key discovery mechanics".
Agora deck, slide 9. Exact stored slide matched to this analysis.
Our analysis: A conversion figure placed next to ambassador activity, which is the right pairing.
Evidence and limitation: Conversion base not defined; no unit count behind the sell-out.
What a founder can adapt: Say what the 3% is measured on and how many units sold out.
Supporting analysis
What the deck claims: "36 ambassadors selling"; "Top seller sold out in a day"; "Conversion rate at 3%"; "50,000 users, mostly organic"; "50,000 videos uploaded"; "> 1M videos watched".
Presentation choice: Links ambassador selling to a purchase measure.
When it does not fit: An undefined conversion rate.
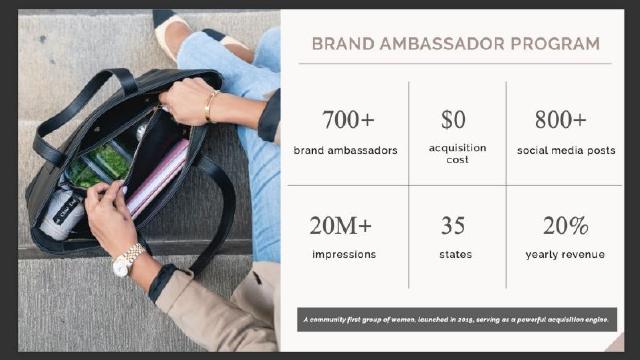
Lunch bag brand. Slide titled "Brand ambassador program".
Modern Picnic deck, slide 16. Exact stored slide matched to this analysis.
Our analysis: 800+ posts from 700+ ambassadors is about one post each since 2019 (our calculation).
Evidence and limitation: Attribution method and ambassador rewards not stated.
What a founder can adapt: State how sales are attributed and the cost of rewards as a share of that revenue.
Supporting analysis
What the deck claims: "700+ brand ambassadors"; "$0 acquisition cost"; "800+ social media posts"; "20M+ impressions"; "35 states"; "20% yearly revenue"; "launched in 2019, serving as a powerful acquisition engine".
Presentation choice: Reports an outcome, share of revenue, rather than attention alone.
When it does not fit: "$0 acquisition cost" when ambassadors receive product, discounts or commission.
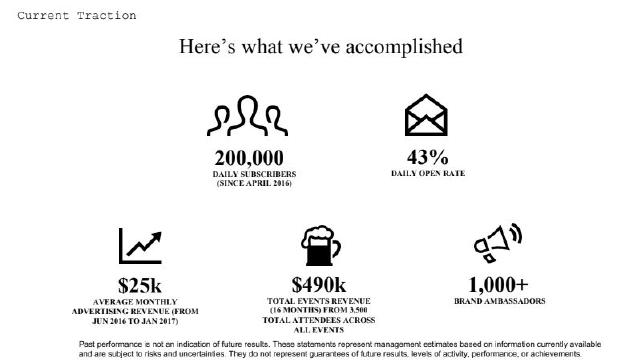
Daily business newsletter. Slide headed "Here's what we've accomplished".
The Hustle deck, slide 7. Exact stored slide matched to this analysis.
Our analysis: A head count placed among outcome figures.
Evidence and limitation: Ambassador count only; no sign-ups attributed to ambassadors.
What a founder can adapt: Report the share of subscribers who came through ambassador links.
Supporting analysis
What the deck claims: "200,000 daily subscribers (since April 2016)"; "43% daily open rate"; "$25k average monthly advertising revenue"; "$490k total events revenue (16 months)"; "1,000+ brand ambassadors".
Presentation choice: Shows the program is large enough to matter.
When it does not fit: Listing ambassadors as traction without what they produced.
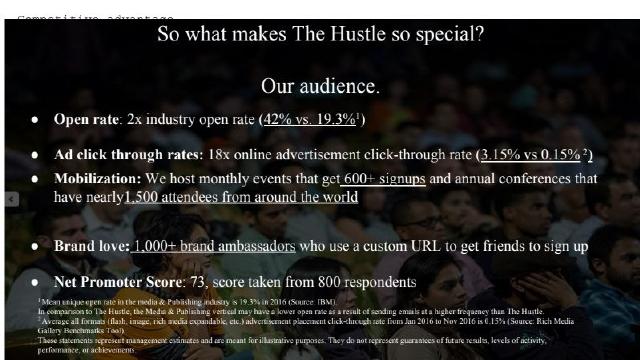
Same company. Slide titled "So what makes The Hustle so special?".
The Hustle deck, slide 9. Exact stored slide matched to this analysis.
Our analysis: Each ambassador has a link, so sign-ups per ambassador can be counted.
Evidence and limitation: Tracking method stated; result not reported.
What a founder can adapt: Add sign-ups from ambassador links and how many stayed subscribed.
Supporting analysis
What the deck claims: "Brand love: 1,000+ brand ambassadors who use a custom URL to get friends to sign up"; "Net Promoter Score: 73, score taken from 800 respondents".
Presentation choice: Names the mechanism that makes the program measurable.
When it does not fit: Describing the tracking without the count it produces.
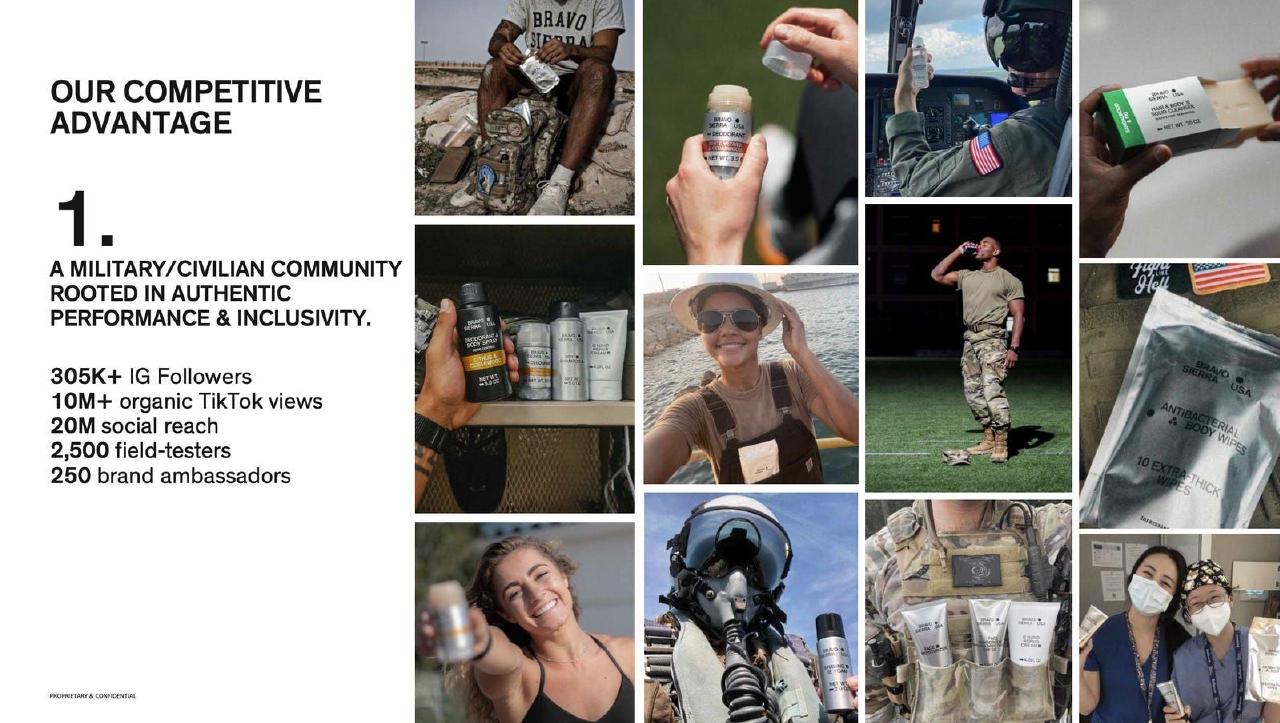
Personal care brand for military and outdoor users. Slide headed "Our competitive advantage".
Bravo Sierra deck, slide 7. Exact stored slide matched to this analysis.
Our analysis: Credible evidence of community and loyalty, not of a sales channel.
Evidence and limitation: Counts only; no activity or sales linked to ambassadors.
What a founder can adapt: Give ambassador activity and sales on the go-to-market or traction slide.
Supporting analysis
What the deck claims: "A military/civilian community rooted in authentic performance & inclusivity." "305K+ IG Followers"; "10M+ organic TikTok views"; "20M social reach"; "2,500 field-testers"; "250 brand ambassadors".
Presentation choice: Photos and field-tester count make the community concrete.
When it does not fit: Treating a head count as a channel.
Whether each slide shows active ambassadors, an outcome, a tracking method and a cost.
Example
Active vs enrolled
Outcome
Tracking
Cost
Agora (test)
36 of 132
Top sellers £150
No
No
Agora (launch)
36 selling
3% conversion (undefined)
No
No
Modern Picnic
No
20% of yearly revenue
No
"$0" (unclear)
The Hustle
No
No
Custom URL
No
MySwimPro
No
No
No
$5k/quarter
Bravo Sierra
No
No
No
No
Key Takeaways
Count ambassadors who sold, not just those enrolled.
Give sales or sign-ups per active ambassador.
Say how each sale is tracked to an ambassador.
Count free product, commissions and staff time as cost.
Put the program next to your other channels on the same terms.
Build your ambassador program slide
Answer these before you put ambassadors on a slide.
Active. How many ambassadors are enrolled, and how many made at least one sale or sign-up in the last period?
Output. What do active ambassadors produce, in total and per ambassador (median, not just the best)?
Tracking. How is each sale or sign-up credited to an ambassador: code, link or survey?
Cost. What does the program cost in free product, discounts, commission and staff time, per customer?
Benchmark. How does that cost per customer compare with your paid or partner channels?
Copyable framework: [Enrolled] ambassadors, [active] of whom sold in [period]. They brought in [customers or sign-ups], a median of [number] per active ambassador, tracked by [method]. Program cost: [cost], or [cost per customer] per customer, against [benchmark] for paid ads.
Illustrative example 1 — written by us
Before: Our 500+ brand ambassadors are a powerful acquisition engine with zero acquisition cost.
After: 512 ambassadors enrolled; 94 made at least one sale in Q2. Through personal discount links they brought in 1,310 first orders, a median of 8 per active ambassador. Free product and 15% commission cost $21,400, or $16 per new customer, against $38 for paid social.
What improved: Our illustrative rewrite; all figures are invented for the example. It separates active from enrolled ambassadors, names the tracking method, counts the real cost and compares it with another channel.
The question this guide answers
An ambassador program recruits customers, fans or creators to promote a brand, usually in return for free product, a discount code, commission or status. It sits between three channels this library already covers. The influencer guide covers paid creators hired campaign by campaign. The viral growth guide covers users who bring in other users through normal use, and it notes that an ambassador program is a recruited, often rewarded channel rather than spontaneous sharing. The affiliate guide covers commission partners as a business model. None of them answers the question founders actually face when they put ambassadors on a slide: what evidence shows the program brings in customers at a cost worth paying?
The answer matters because ambassador numbers are easy to make large. Signing up hundreds of enthusiastic customers costs little; getting them to sell is hard. Most programs follow the same pattern: a small share of ambassadors produce most of the results, and the rest post occasionally or not at all. Investors know this, so a head count tells them almost nothing. What they want is the shape of the program: how many are active, what the active ones produce, and what it costs per customer compared with ads or partners.
How we chose and read the examples
We searched the extracted text of the slide library for slides that mention ambassadors, then removed slides where the word referred to a diplomat, a celebrity endorser or a market-research segment. We read the remaining candidates and kept five companies whose slides each show a different way of presenting an ambassador program, with seven slides in total. Two small slides, from Modern Picnic and The Hustle, were rendered again at a larger size to confirm their wording. A college ambassador plan with a per-sign-up payment was considered but its deck file could not be retrieved, so it is not used.
We quote what is visible on each slide. We have not checked any company's figures against other sources, and we make no claim that any slide affected a fundraising result. Where we work out a figure, we show the arithmetic and say it is ours.
Report active ambassadors, not enrolled ones
Agora, a UK beauty and social commerce app, titles one slide "Agora Edits: a test for social commerce". Four figures run across the top: "No. of ambassadors selling 36", with a note that "our top selling ambassadors already made £150"; "Est total reach: Instagram, TikTok, YouTube 3.4M"; and "Engagements generated in 1 week 175K". A banner below explains the base: "We engaged with 36 of our 132 Agora brand ambassadors to promote beauty boxes exclusively on sale on Agora. Scaling 5x in January 2021." A tag marked January 2021 gives the target: "~300 ambassadors selling", "~5M total estimated reach", "~500K engagement generated".
This is the most useful ambassador slide we found, because it separates the 36 who were selling from the 132 enrolled. That is 27% of the roster (our calculation), and it is exactly the number investors would otherwise ask for. The £150 figure also helps: it gives a sense of what a strong ambassador earns, which tells investors whether the reward is enough to keep people selling.
Three gaps remain. First, £150 describes the top sellers only; investors need the total sales from the test or the median per ambassador, since a few strong sellers can hide a long tail of zeros. Second, reach and engagements are estimates of attention, not purchases. Third, the targets do not line up: 36 multiplied by 5 is 180, while the January figure is about 300 ambassadors selling, which is more than the 132 currently enrolled (our calculation). That may be right if the company plans to recruit, but the slide should say so and say how.
Tie ambassador activity to a conversion figure
An earlier Agora slide, titled "We launched the app focused on uploads and key discovery mechanics", puts the same test into its product story. Under "Introducing social commerce" it lists "36 ambassadors selling", "Top seller sold out in a day" and "Conversion rate at 3%". Under "Growing a community" it lists "50,000 users, mostly organic", "50,000 videos uploaded" and "> 1M videos watched".
The 3% conversion rate is the figure that turns ambassador activity into a sales claim, and placing it next to the ambassador count is the right instinct. What the slide does not say is what the 3% is measured on: visitors to an ambassador's shop page, people who watched a video, or app users who saw a box. Each gives a very different picture. "Sold out in a day" is also hard to judge without the number of boxes available. A founder copying this layout should define the conversion rate in a few words and give the unit count behind any sell-out.
Explain how sales are attributed and what ambassadors receive
Modern Picnic, which sells lunch bags, has a slide titled "Brand ambassador program" with six figures: "700+ brand ambassadors", "$0 acquisition cost", "800+ social media posts", "20M+ impressions", "35 states" and "20% yearly revenue". A caption reads: "A community first group of women, launched in 2019, serving as a powerful acquisition engine."
Twenty percent of yearly revenue is a strong claim, and it is the kind of figure an ambassador slide needs: an outcome, not attention. Two questions decide whether investors believe it. The first is attribution. The slide does not say whether the 20% comes from ambassador discount codes, tracked links, or customers who say they heard about the brand from an ambassador. Each method counts differently, and codes in particular can be shared on coupon sites. The second is cost. "$0 acquisition cost" usually means the company pays no fee up front, but ambassador programs typically involve free product, discounts or commission on sales, plus someone to run the community. If ambassadors earn commission on that 20% of revenue, the program has a cost, and investors will want it as a share of the revenue it brings in.
There is also a ratio worth checking. 800+ posts from 700+ ambassadors is roughly one post per ambassador since 2019 (our calculation), which suggests most ambassadors post rarely and a minority do most of the work. That is normal, and saying so, with the number of active ambassadors, would make the 20% figure more credible rather than less.
Name the tracking tool, then report what it counted
The Hustle, a daily business newsletter, mentions its ambassadors on two slides. A traction slide headed "Here's what we've accomplished" lists "200,000 daily subscribers (since April 2016)", "43% daily open rate", "$25k average monthly advertising revenue (from Jun 2016 to Jan 2017)", "$490k total events revenue (16 months) from 3,500 total attendees across all events" and "1,000+ brand ambassadors". A later slide, "So what makes The Hustle so special?", explains the program under "Brand love": "1,000+ brand ambassadors who use a custom URL to get friends to sign up".
The custom link is the right mechanism. It gives every ambassador a way to be credited, and it gives the company a precise count of sign-ups from the program. That is what makes this example useful even though the result is missing: the slide shows that the data exists. The next step is to report it. Of the 200,000 subscribers, how many came through ambassador links, and how many of those still open the email? Without that, 1,000+ ambassadors sits on the traction slide as a count of people, next to figures that are all outcomes.
A budget is not a result
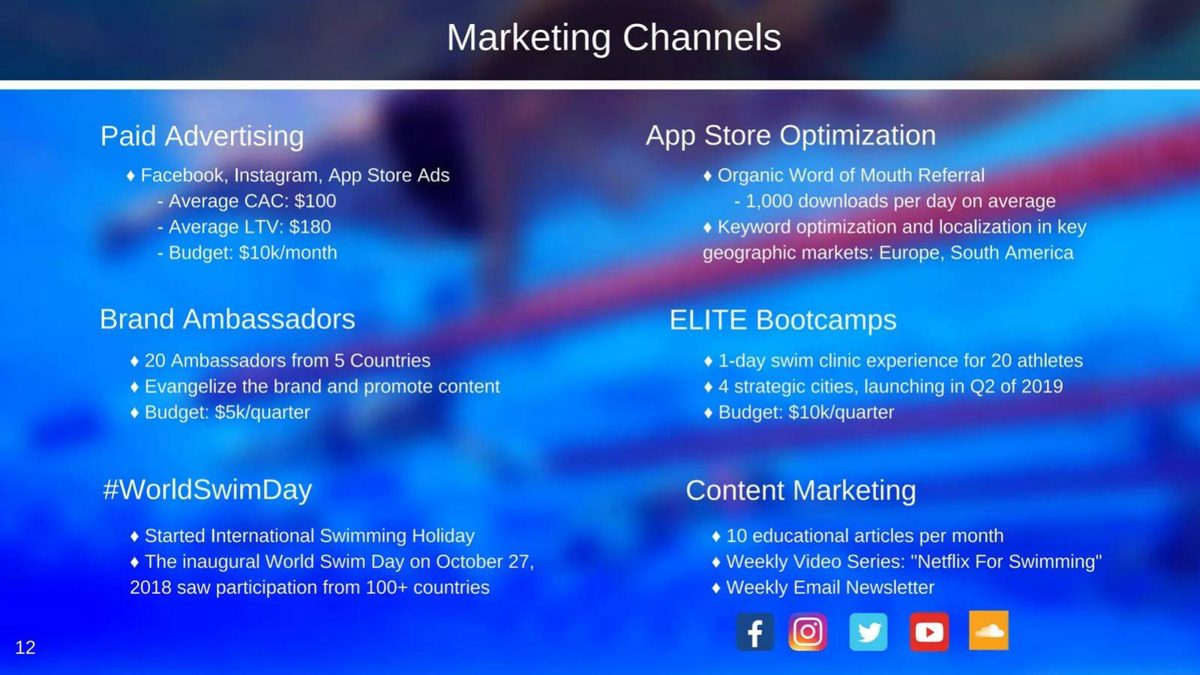
MySwimPro, a swimming training app, has a slide titled "Marketing Channels" with six boxes. Under "Paid Advertising" it gives "Average CAC: $100", "Average LTV: $180" and "Budget: $10k/month". Under "Brand Ambassadors" it gives "20 Ambassadors from 5 Countries", "Evangelize the brand and promote content" and "Budget: $5k/quarter". Other boxes cover app store optimisation ("1,000 downloads per day on average"), swim clinics, a World Swim Day campaign and content marketing.
This slide does something many ambassador slides skip: it states what the program costs. It also sets a useful comparison right next to it, because paid advertising has a cost per customer. The trouble is that only one side of the comparison is filled in. Paid ads cost $100 per customer; the ambassador program costs $5,000 a quarter, but the slide does not say how many customers it brings in. At $100 each, the program would need to bring in 50 paying customers a quarter to match paid ads (our calculation). Reporting the program's customers, or even its sign-ups, against that same benchmark would let investors decide whether to fund more ambassadors or more ads.
A head count is not a channel
Bravo Sierra, a personal care brand built around military and outdoor users, has a slide headed "Our competitive advantage" with the point "1. A military/civilian community rooted in authentic performance & inclusivity." Five figures follow: "305K+ IG Followers", "10M+ organic TikTok views", "20M social reach", "2,500 field-testers" and "250 brand ambassadors", beside a grid of photos of service members and outdoor workers using the products.
Read as a statement about brand identity, the slide works: the photos and the field-tester figure make the community feel real, and 250 ambassadors from that community is a credible claim of loyalty. Read as evidence that ambassadors sell, it shows nothing yet. There is no figure for what the ambassadors do, how many are active, or any sales linked to them. That is fine on a competitive-advantage slide, as long as the go-to-market or traction slide later gives the numbers. If it does not, investors will treat the 250 as a list of fans.
What a complete ambassador slide shows
Put together, the five companies supply every part of a strong slide, but no single slide has all of them. Agora counts active against enrolled ambassadors and gives a conversion rate. Modern Picnic gives the program's share of revenue. The Hustle shows how each sign-up is credited to an ambassador. MySwimPro states the cost and sets it next to paid advertising. A complete slide combines them: enrolled and active ambassadors, sales or sign-ups per active ambassador over a stated period, the tracking method, the full cost including rewards, and the cost per customer compared with your other channels.
If the program is too new for sales figures, say so and give what you can measure honestly: how many ambassadors posted in the last month, how many clicks their links produced, and what you will report once you have a quarter of data. A small, honest test, like Agora's 36 of 132, is more persuasive than a large head count.
Common mistakes
Head count as evidence. Enrolled ambassadors say nothing about sales; report the active share.
Top seller only. Give the median or total, not just the best ambassador.
Unstated attribution. Say whether codes, links or surveys credit each sale.
Attention as outcome. Reach, impressions and posts are not customers.
Diagnostic checklist
Enrolled and active ambassadors both stated.
Sales or sign-ups per active ambassador, with a period.
Tracking method named.
Full program cost, including rewards.
Cost per customer compared with another channel.
Frequently asked questions
Is an ambassador program the same as influencer marketing?
They overlap, but an ambassador program usually recruits a standing group of customers or fans who promote over time for product, discounts or commission, while influencer campaigns pay creators per campaign. Show the program's own results and costs either way.
What share of ambassadors should be active?
There is no standard figure, and a minority doing most of the work is normal. Investors care less about the share than about seeing it reported honestly, with what the active group produces.
What if the program is too new to show sales?
Report what you can measure, such as posts and link clicks in the last month, label them as early activity, and say which sales figure you will report next quarter.
How we chose these examples
Corpus: published pitch deck teardowns on StartupFundraising.com. Founder-uploaded private decks are excluded.
Selection (2026-10-01): we searched extracted slide text for ambassador programs, excluded slides where the word referred to diplomats, celebrity endorsers or survey segments, and kept seven slides from five companies that each show a distinct way of presenting an ambassador program. One candidate was dropped because its deck file could not be retrieved.
Review: all seven slides were read from the source decks on 2026-10-01 against company, deck and page number, with the Modern Picnic and The Hustle slides rendered again at a larger size; our calculations were checked against the visible figures (editorial model review, with AI assistance in drafting). No person has yet completed an editorial review of this page. We did not verify any company's figures.