From Clinical Results to Hospital Adoption: What a Health
Good study results don't make hospitals buy. How Astek Diagnostics, Vital and Lattice Biologics showed the steps between evidence and paying customers.
From Clinical Study to Commercial Adoption: How to Show the Gap on Your Pitch Deck
Four slides from three health startups at different points between evidence and sales: a diagnostics company reporting pilot accuracy at three hospitals, a patient-communication company showing pilots turning into contracts and results at one hospital, and a tissue company selling through surgeons who must win hospital approval. We check what each slide lets an investor work out about how results become paying customers.
TL;DR
A successful study answers "does it work?" Investors in a health startup also need "who will pay, how, and how fast?" The slide that bridges the two should name who decides to adopt (a clinician, a hospital committee, a payer), what they need beyond the study (approval, reimbursement, workflow fit, an outcome they're measured on), how many sites have moved from pilot to paid and how long that took, and what revenue each site brings.
Vital comes closest: its chart separates hospitals with pilots started from hospitals contracted, and its revenue ladder runs from trial to $60k and $120k a year per hospital. Astek gives pilot results with sample sizes at named hospitals, but nothing on who pays after the pilots. Lattice shows the route through surgeons and hospital approval, with time ranges, but its revenue per surgeon is a target.
Clinical-to-adoption slides from real pitch decks
Each example records what the slide shows about evidence, decision-makers, the step from pilot to paid and revenue per site. "Read from the chart" and "our calculation" mark our readings and arithmetic; everything else is quoted from the slide.
Emergency-room patient communication. 2021 Series A deck; growth page.
Vital deck, slide 16. Exact stored slide matched to this analysis.
Our analysis: Shows the pilot-to-paid gap honestly.
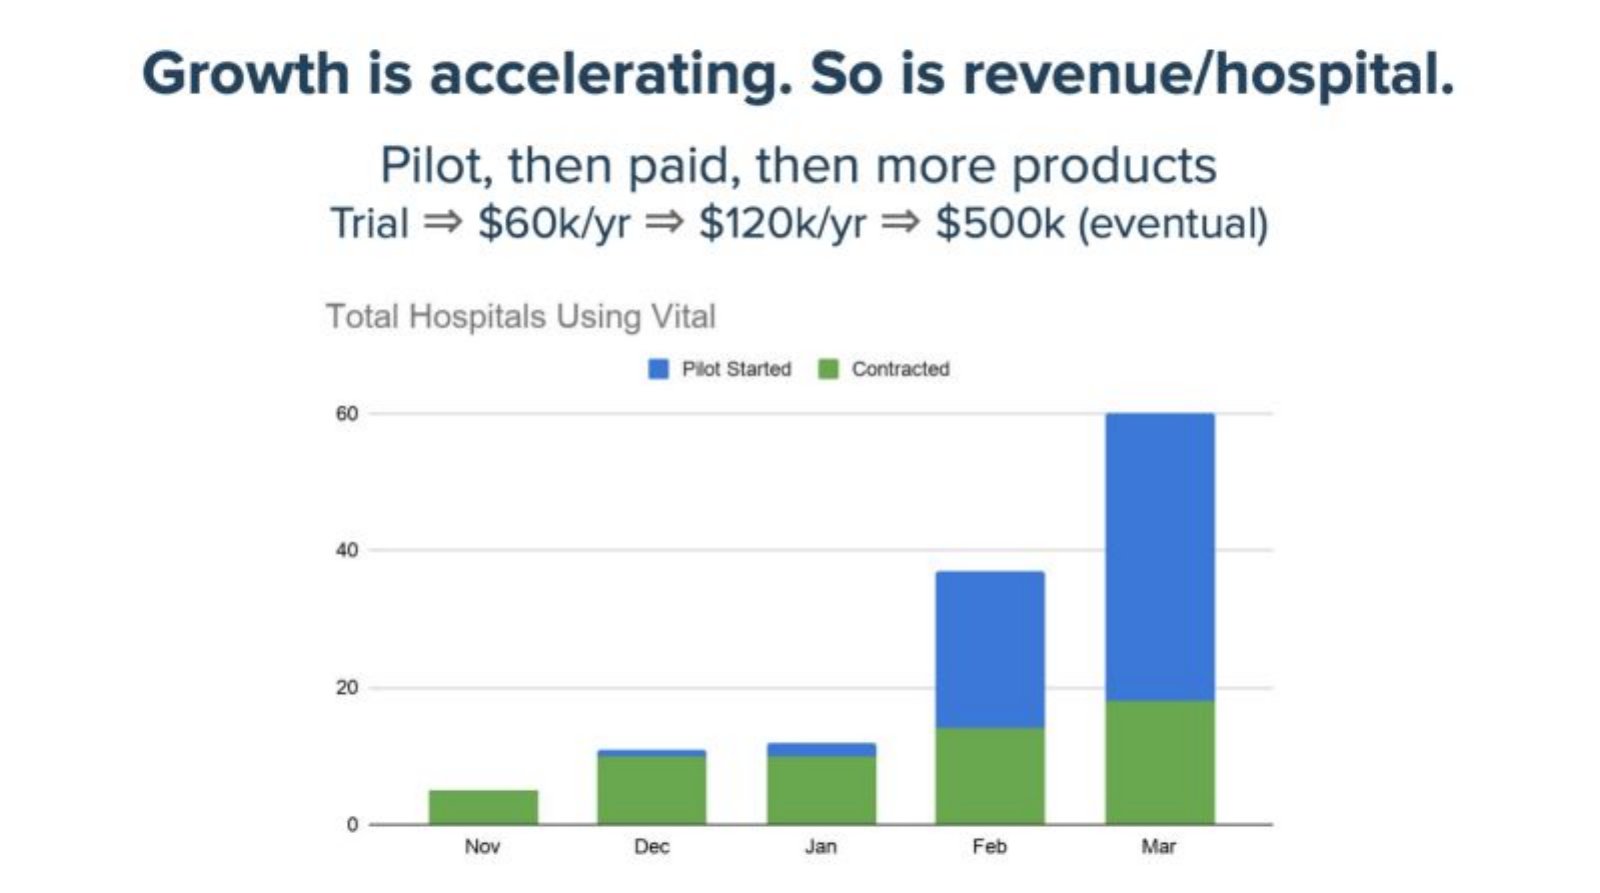
Evidence and limitation: Contracted about 5 to 18, pilots none to about 42 (read from the chart). No conversion rate or pilot length.
What a founder can adapt: Add conversion by pilot start month.
Supporting analysis
What the deck claims: "Pilot, then paid, then more products"; "Trial ⇒ $60k/yr ⇒ $120k/yr ⇒ $500k (eventual)"; "Total Hospitals Using Vital" split into "Pilot Started" and "Contracted", Nov to Mar.
Presentation choice: Investors can see how many sites pay.
When it does not fit: Don't present an "eventual" price as measured.
Vital deck, slide 21. Exact stored slide matched to this analysis.
Our analysis: Ties results to how the hospital is paid.
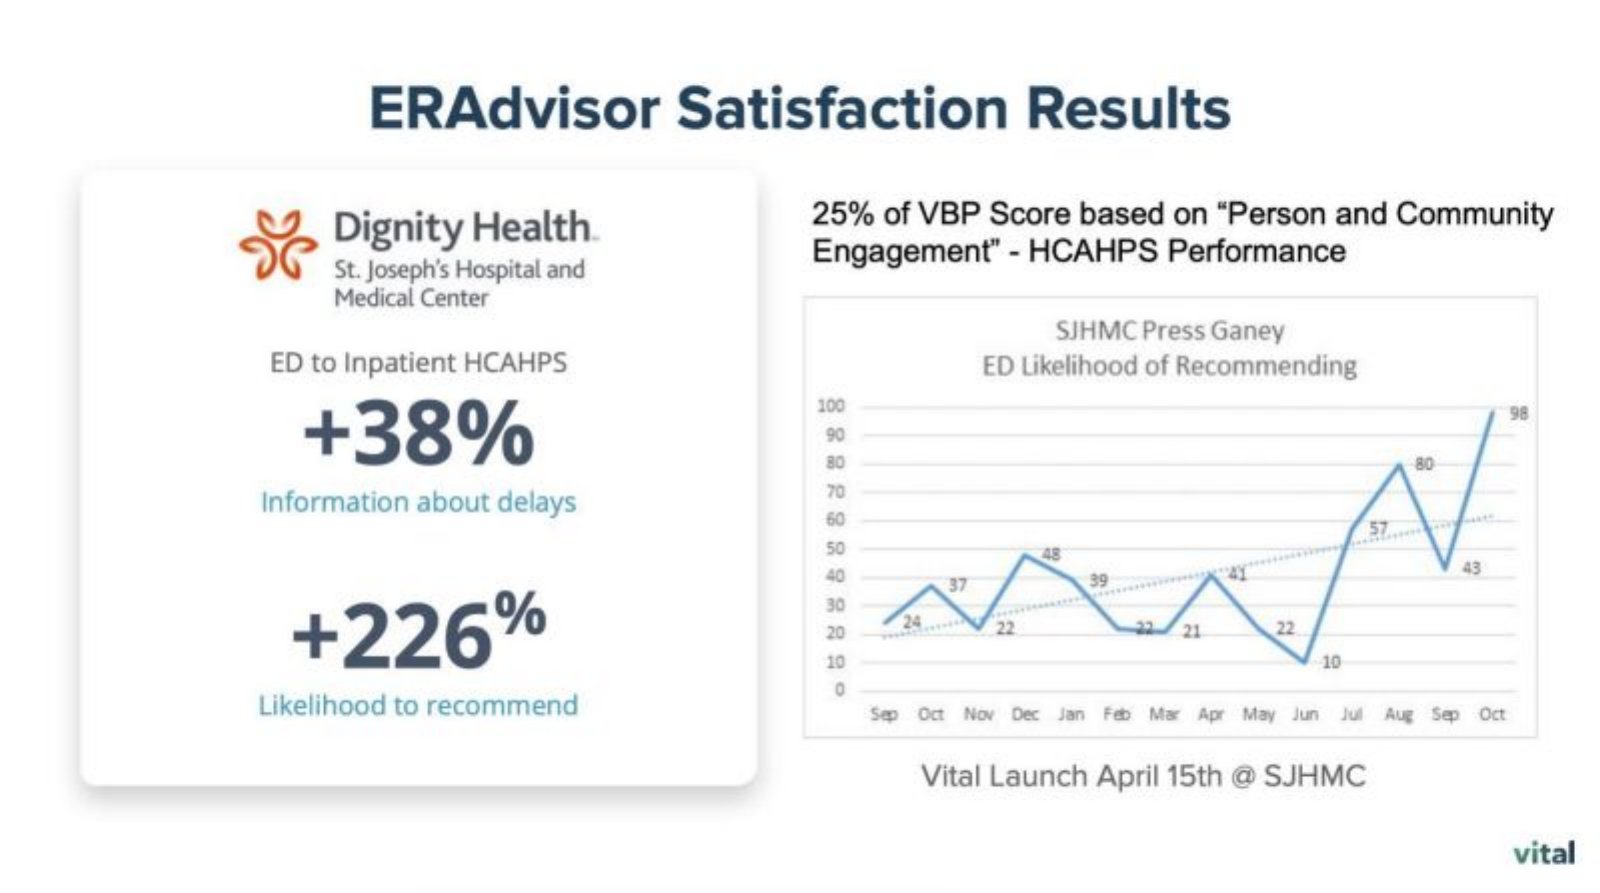
Evidence and limitation: One hospital; monthly scores 10 to 98 (read from the chart); response counts and baseline not given.
What a founder can adapt: Add response counts and more sites.
Supporting analysis
What the deck claims: "ED to Inpatient HCAHPS +38% Information about delays"; "+226% Likelihood to recommend"; "25% of VBP Score based on 'Person and Community Engagement'"; "Vital Launch April 15th @ SJHMC".
Presentation choice: Answers why a hospital would pay.
When it does not fit: Don't rest adoption on one site's volatile score.
Counts. Sites at each step, with dates and conversion.
Revenue. Revenue per site today and target, labelled.
Incentive. The cost, score or code that makes the buyer pay.
Copyable framework: [Result] on [n] patients at [sites] ([dates]). Decided by [role]; needs [requirement]. Today: [x] pilots, [y] contracted, [z]% of pilots converted in [months]. Revenue per site [measured], target [target].
Illustrative example 1 — written by us
Before: Clinically validated at leading hospitals.
After: 96.97% accuracy on 50 samples at MedStar (Jul-Sep 2023). Bought by the hospital lab director from the microbiology budget; needs FDA clearance. Today: 3 pilots, 0 contracts; first purchase decision expected after clearance.
What improved: Our illustrative rewrite; the buyer, budget and next step are invented for the example. The accuracy, sample size and dates are Astek's.
The question this guide answers
Many health startups have convincing study results and almost no revenue. The gap is not a failure of the evidence: hospitals buy through committees and budgets, clinicians change habits slowly, and payers decide what gets reimbursed. An investor reading a strong results slide will ask what happens next, how many sites have paid, and how long the step from pilot to contract takes.
Our clinical evidence guide covers how to present the results themselves, the reimbursement guide covers who pays and through which codes, and the sales cycle guide covers the time from first contact to payment. None follows the path from a successful study to repeat commercial use. That is this guide's question: what should a health startup's deck show to connect its results to paying customers?
How we chose and read the examples
We searched the extracted text of the deck library for study and trial results near words about hospitals adopting, signing or going live, and for key opinion leaders and guideline adoption. Most matches were listed drug companies or unrelated uses of "KOL" in crypto marketing; one telemedicine deck marked "Not for distribution" was excluded. We also looked at public medical-device decks outside the library. One, Minomic's July 2026 investor presentation, is quoted below as an outside example but not illustrated, because our examples link only to decks with a teardown in our library.
Four slides from three private startups remained: Astek Diagnostics page 14 (2023), Vital pages 16 and 21 (2021) and Lattice Biologics page 10 (2016), dated from our teardown records. Each was rendered from the original deck file and read at full size. Chart values are our readings; calculations marked "our calculation" are ours. We didn't check any company's results or contracts.
Results with sample sizes, but no buyer yet
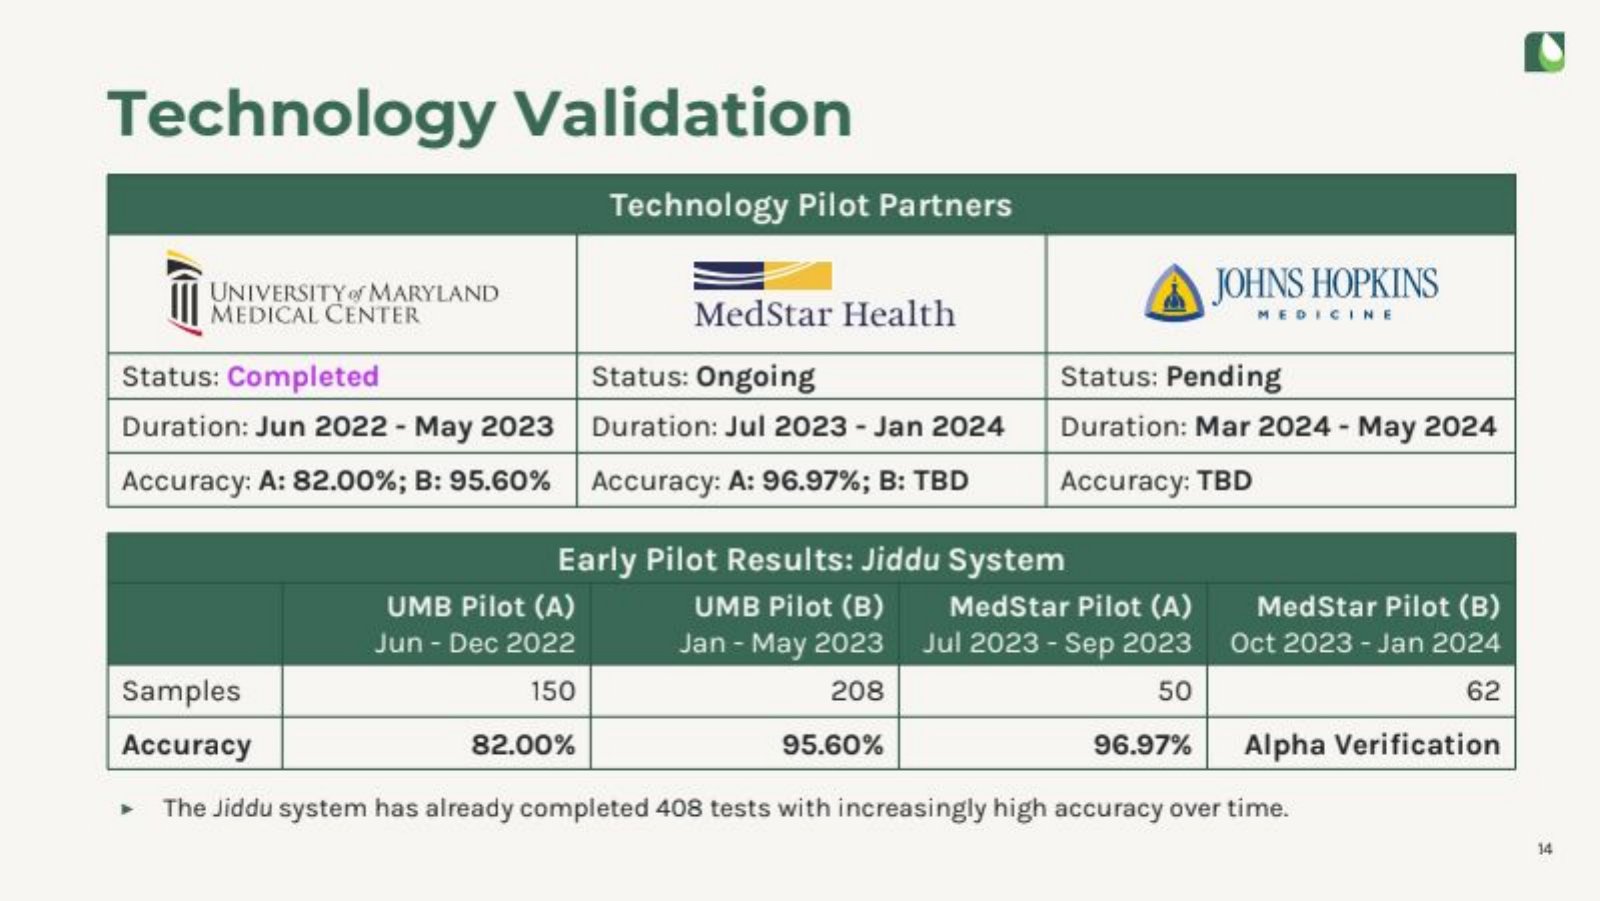
Astek Diagnostics, which develops a urine-testing device, uses page 14, "Technology Validation", for two tables. The first lists "Technology Pilot Partners": University of Maryland Medical Center ("Status: Completed", "Jun 2022 - May 2023", "Accuracy: A: 82.00%; B: 95.60%"), MedStar Health ("Ongoing", "Jul 2023 - Jan 2024", "A: 96.97%; B: TBD") and Johns Hopkins Medicine ("Pending", "Mar 2024 - May 2024", "TBD"). The second gives "Early Pilot Results: Jiddu System" with samples and accuracy: UMB Pilot A, 150 samples, 82.00%; UMB Pilot B, 208, 95.60%; MedStar Pilot A, 50, 96.97%; MedStar Pilot B, 62, "Alpha Verification". A footnote says the system "has already completed 408 tests".
This is careful evidence: named sites, dates, sample sizes and an honest "TBD" where results aren't in. It is the kind of table our clinical evidence guide asks for. One figure doesn't reconcile: the four sample counts add to 470, and the three with results to 358 (our calculation), so it's unclear what the 408 tests count.
What the slide doesn't do is say what comes after. Elsewhere the deck plans FDA clearance and lists ten pilot sites on its timeline, but nowhere does it say who at a hospital would buy the device after a pilot, what they'd pay from, or whether any pilot site has agreed to buy. Pilot partners are not customers until someone signs.
Separate pilots from paying sites, and price each step
Vital, which sends emergency-room patients updates on their care, uses page 16, "Growth is accelerating. So is revenue/hospital.", for the clearest adoption view in the set. A subtitle reads "Pilot, then paid, then more products" and "Trial ⇒ $60k/yr ⇒ $120k/yr ⇒ $500k (eventual)". A stacked bar chart, "Total Hospitals Using Vital", splits each month from November to March into "Pilot Started" and "Contracted". Contracted hospitals rise from about 5 in November to about 18 in March, while pilots rise from none to about 42 (read from the chart).
This shows exactly the gap investors ask about: most hospitals using Vital in March were still in pilots, and the contracted count rose more slowly. That honesty is useful. What's missing is the conversion: how many pilots started in December and January became contracts, and how long a pilot lasts. The chart's months have no year, and the "$500k (eventual)" step is a goal, not a measured figure; the slide doesn't say how many hospitals pay $120k today.
Tie results to something the buyer is measured on
Vital's page 21, "ERAdvisor Satisfaction Results", reports results at one hospital, Dignity Health's St. Joseph's Hospital and Medical Center: "ED to Inpatient HCAHPS +38% Information about delays" and "+226% Likelihood to recommend". A chart of "SJHMC Press Ganey ED Likelihood of Recommending" runs from September to the following October, with "Vital Launch April 15th @ SJHMC" below it. A heading explains why the hospital cares: "25% of VBP Score based on 'Person and Community Engagement' - HCAHPS Performance".
This is the strongest bridging move in the set. Hospitals in the US Medicare value-based purchasing program have part of their payment adjusted by patient-experience survey scores, so a result on that score speaks to the buyer's own money, not just to clinical merit. A result framed this way answers "why would a hospital pay?" directly.
The evidence itself is thin. It is one hospital, the chart's monthly scores swing widely (from 10 to 98, read from the chart), and the two months right after launch were among the lowest. The slide doesn't say how many survey responses each month represents or what +226% is measured from. A result like this is a good reason for a pilot, not yet proof that adoption will follow.
Show the route through clinicians and hospital approval
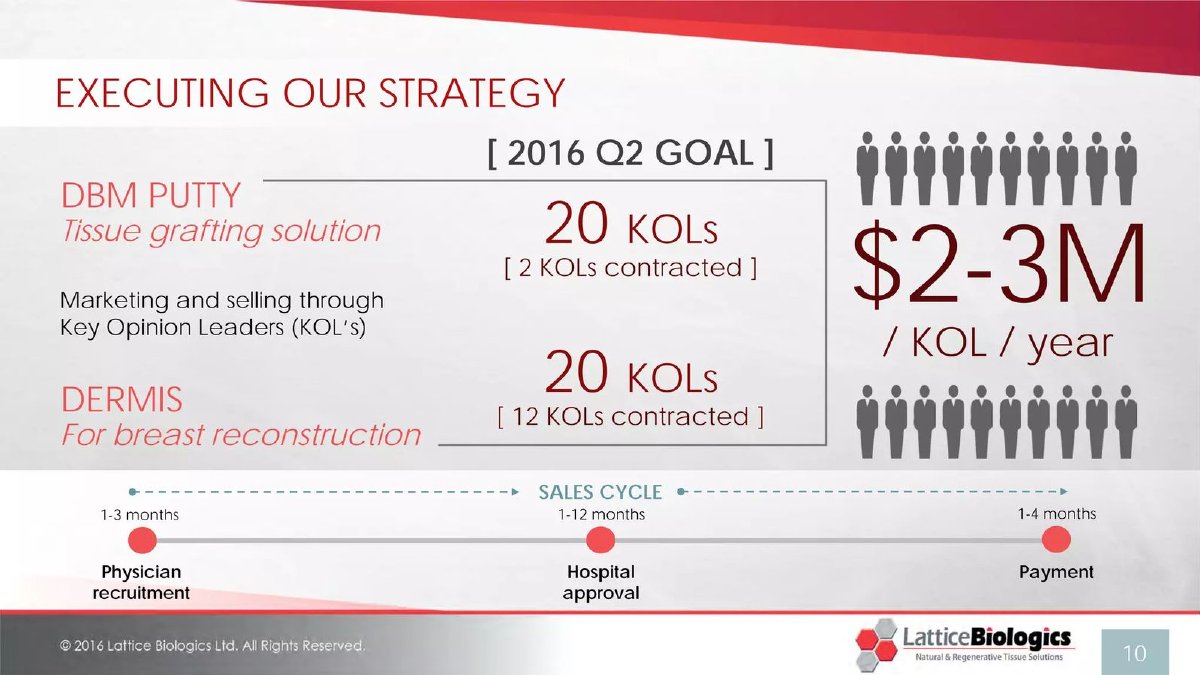
Lattice Biologics, which makes tissue-grafting products, uses page 10, "Executing our strategy", to show how its products reach patients: "Marketing and selling through Key Opinion Leaders (KOL's)", with a "2016 Q2 Goal" of "20 KOLs" for each of two products ("2 KOLs contracted" for DBM Putty, "12 KOLs contracted" for Dermis), a figure of "$2-3M / KOL / year", and a "Sales cycle" running "Physician recruitment 1-3 months", "Hospital approval 1-12 months", "Payment 1-4 months".
For medical products chosen by surgeons, this is the real adoption path: a respected clinician adopts the product, then the hospital's approval committee has to agree before anyone pays. Our sales cycle guide uses this slide for its timing; here the point is the route. Naming the two decision-makers and the longest, least certain step (hospital approval, 1 to 12 months) tells an investor where adoption can stall.
The slide is weaker on evidence. "$2-3M / KOL / year" is a target, not measured revenue, and the slide doesn't say how many contracted surgeons have reached hospital approval or payment.
An outside example: strong studies, slow revenue
Minomic, a prostate-cancer blood test company, shows the gap clearly in its July 2026 investor presentation. Its summary says the test reduces "unnecessary procedures by up to 63% across four independent studies", that it is "Live and generating revenue" in the US with a "Medicare PLA Code 0591U at $760/test", and that an "FDA study" is "underway". Its revenue projections give "Projected CY2026 revenue: $400k". Four studies and a Medicare payment code have not yet produced large revenue, and the company is raising money partly to fund a further study. That is the kind of honest gap a deck should explain: which step (a regulatory study, distribution partners, clinician habits) the raise is meant to unlock.
What to put on your slide
Draw the path from study to repeat use: results, then whichever approvals or reimbursement steps apply, then pilots, contracts and expansion within each site. For each step, say who decides, what they need and how long it has taken so far. Give counts at each step with dates: sites in pilot, sites contracted, sites paying, and how many pilots have converted. Put revenue per site beside the count, labelled as measured or target.
Then connect your results to the buyer's incentives: a cost the hospital saves, a score it is paid on, a reimbursement code that pays for the test. If the gap is still wide, say what the raise does to close it. Investors expect a gap in health care; what they need is a plan for crossing it.
Common mistakes
Results as adoption. A study isn't a customer; show who pays next.
Pilots counted as customers. Separate pilot sites from paying sites.
No decision-maker. Name who approves and what they need.
Target shown as revenue. Label per-site figures as measured or target.
One-site proof. Show more sites or say it's one.
Totals that don't add up. Reconcile test counts with sample sizes.
Diagnostic checklist
Results have sample sizes, sites and dates.
The decision-maker after the study is named.
Pilot and paying sites are counted separately.
Conversion from pilot to contract is shown.
Revenue per site is labelled measured or target.
The buyer's incentive to pay is stated.
Frequently asked questions
Why don't good clinical results lead straight to sales?
Hospitals buy through committees, budgets and reimbursement. Lattice shows hospital approval alone taking 1 to 12 months.
How should I show pilots on a health startup's deck?
Separately from paying sites, with conversion. Vital charts pilots started against hospitals contracted each month.
How do I show a hospital will pay?
Tie results to a cost, score or code the hospital is paid on. Vital links its results to the patient-experience part of a Medicare payment score.
What should a clinical results slide include?
Sites, dates and sample sizes. Astek lists 150, 208, 50 and 62 samples by pilot.
What if adoption is still slow despite strong studies?
Say which step the raise unlocks. Minomic cites four studies and a Medicare code, projects $400k revenue for 2026 and raises partly to fund an FDA study.
How we chose these examples
Selection (2026-10-02): owner-supplied candidate question. The clinical evidence, reimbursement and sales cycle guides each cover part of the topic; none follows the path from study results to paying customers.
Four pages from three original deck files were rendered and read at full size: Astek Diagnostics 14, Vital 16 and 21, Lattice Biologics 10. A telemedicine deck marked not for distribution was excluded. Minomic's public July 2026 presentation was read and is quoted, not illustrated. This guide was written with an AI editorial model and checked against the slide images by model review.
Eligibility was judged at each deck's date; all companies were private. Results, contracts and revenue are the companies' own claims and were not independently verified.