How insurance startups present the problem in a pitch deck: say whether the customer or the insurer is losing out, show how risk is priced wrong.
Insurtech Problem Slide: Real Pitch Deck Examples
Eight problem slides from insurance startups (travel, auto, gig-worker, usage-based, dental and informal-sector cover), shown in full, compare whether each slide says who loses out, why today's insurance fails them, and gives evidence.
TL;DR
An insurtech problem slide has to decide whose problem it is: the policyholder who doesn't trust or can't afford cover, or the insurer losing money on claims. Faye does both on one slide: consumers find travel insurance "Confusing", "Bureaucratic and slow", and incumbents have "No customer ownership", "Low margins" and "No data, legacy systems" — so "Customers buy insurance they will struggle to use, insurers pay crippling commissions, and live off of tiny margins." Predina takes the insurer's side with sourced figures: auto insurance losses rising from "$132BN (2014)" to "$173BN (2018)", credited to the Insurance Information Institute. Beam's three headline claims with no customer and no number are the weaker pattern.
Insurtech problem slides from real pitch decks
Each example shows the exact stored slide above its analysis and links to the full teardown. Claims are as shown on the slides; we have not verified them.
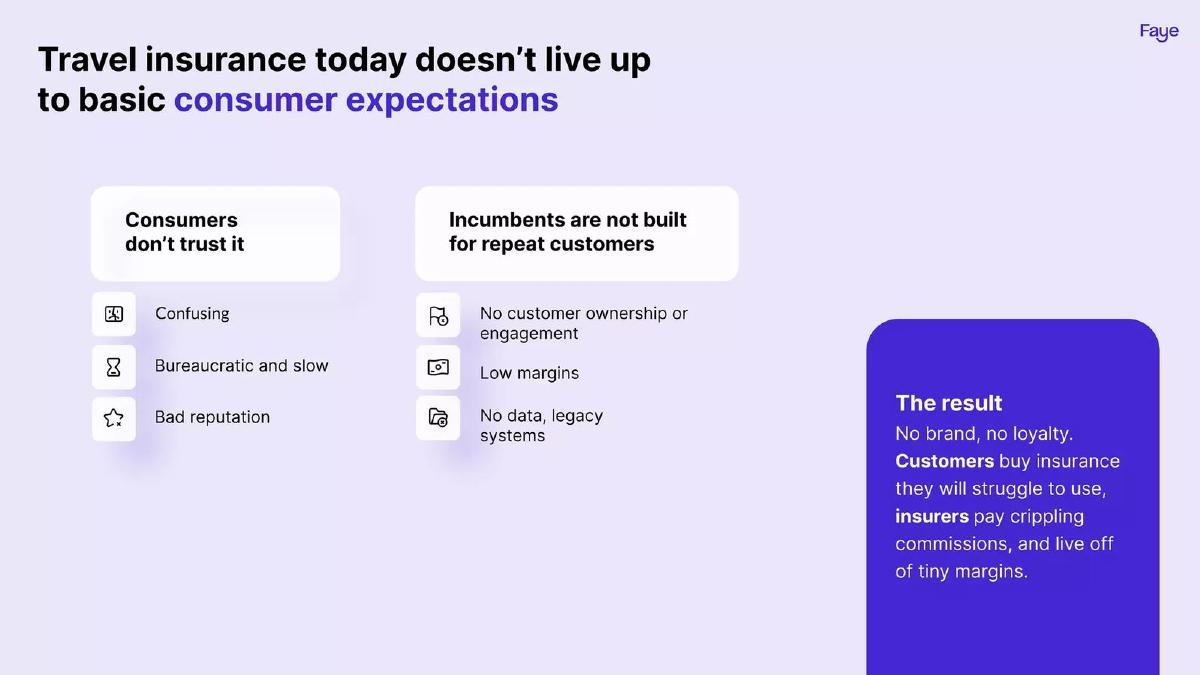
Faye problem slide — slide 4
Travel insurance. Two columns (consumers, incumbents) and a highlighted result box.
Faye deck, slide 4. Exact stored slide matched to this analysis.
Our analysis: The strongest example here: it names both sides, gives three reasons each, and the result box ties them together.
Evidence and limitation: No figures.
What a founder can adapt: End your problem slide with one "result" line that connects the customer's pain to the incumbent's weakness.
Supporting analysis
What the deck claims: "Travel insurance today doesn't live up to basic consumer expectations." "Consumers don't trust it": "Confusing", "Bureaucratic and slow", "Bad reputation". "Incumbents are not built for repeat customers": "No customer ownership or engagement", "Low margins", "No data, legacy systems". "The result: No brand, no loyalty. Customers buy insurance they will struggle to use, insurers pay crippling commissions, and live off of tiny margins."
Presentation choice: An investor sees why the customer is unhappy and why incumbents can't fix it, which sets up a new entrant.
When it does not fit: No figure; add one, such as the share of travellers who never claim or commission rates.
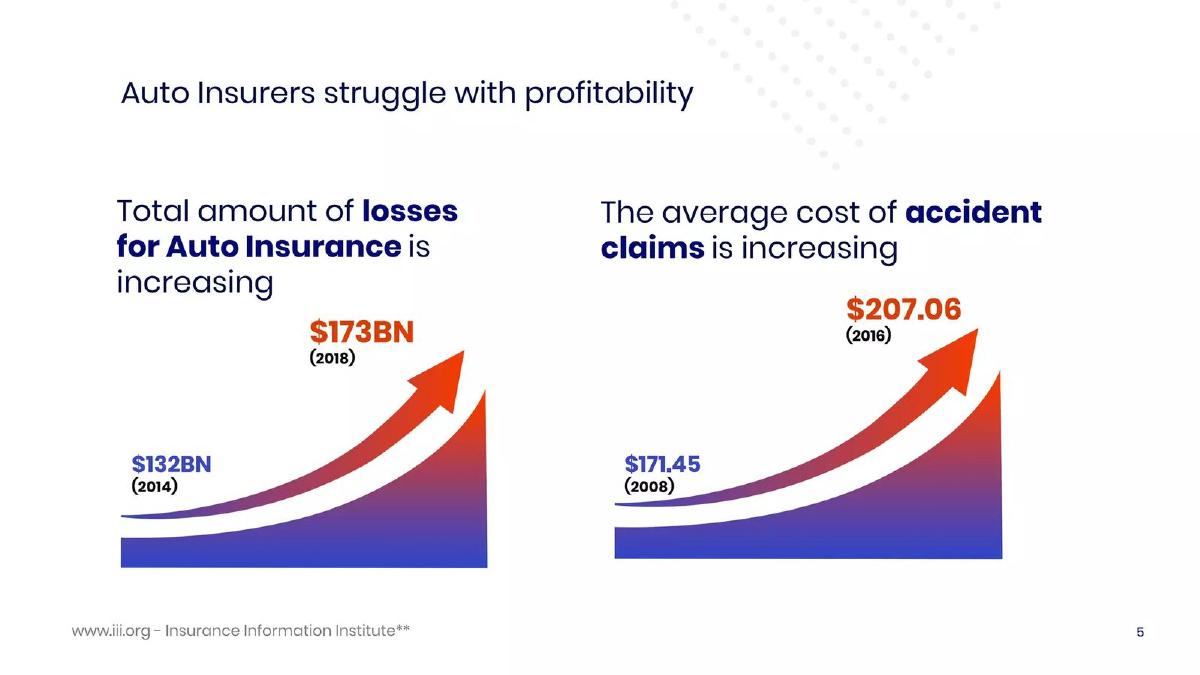
Accident-risk prediction for auto insurers. Two rising charts with a source line.
Predina deck, slide 5. Exact stored slide matched to this analysis.
Our analysis: It picks the insurer as the customer and proves the loss with sourced numbers.
Evidence and limitation: Two figures with years and a named source.
What a founder can adapt: If you sell to insurers, show their loss ratio or claim cost trend from an industry body.
Supporting analysis
What the deck claims: "Auto Insurers struggle with profitability." "Total amount of losses for Auto Insurance is increasing": "$132BN (2014)" to "$173BN (2018)". "The average cost of accident claims is increasing": "$171.45 (2008)" to "$207.06 (2016)". Footer: "www.iii.org - Insurance Information Institute".
Presentation choice: Dated, sourced figures are the easiest kind for an investor to check.
When it does not fit: It doesn't yet say why losses rise; one line on the cause would set up the product.
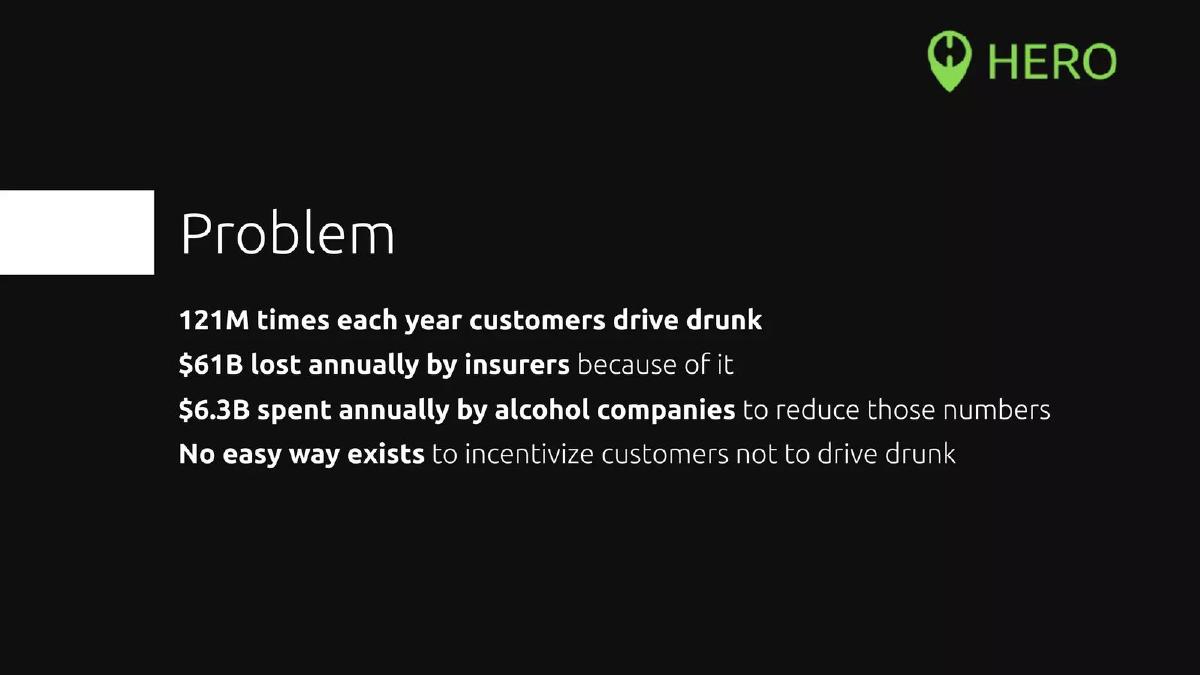
Drunk-driving prevention funded by insurers and alcohol brands. Four lines on black.
HERO deck, slide 2. Exact stored slide matched to this analysis.
Our analysis: It counts the behaviour, what it costs insurers, and what another payer already spends, then states the gap.
Evidence and limitation: Three figures; no source shown.
What a founder can adapt: Show the cost to your buyer and what they spend today trying to fix it.
Supporting analysis
What the deck claims: "121M times each year customers drive drunk." "$61B lost annually by insurers because of it." "$6.3B spent annually by alcohol companies to reduce those numbers." "No easy way exists to incentivize customers not to drive drunk."
Presentation choice: Naming two groups who already lose or spend money shows who might pay.
When it does not fit: Add sources for the three figures.
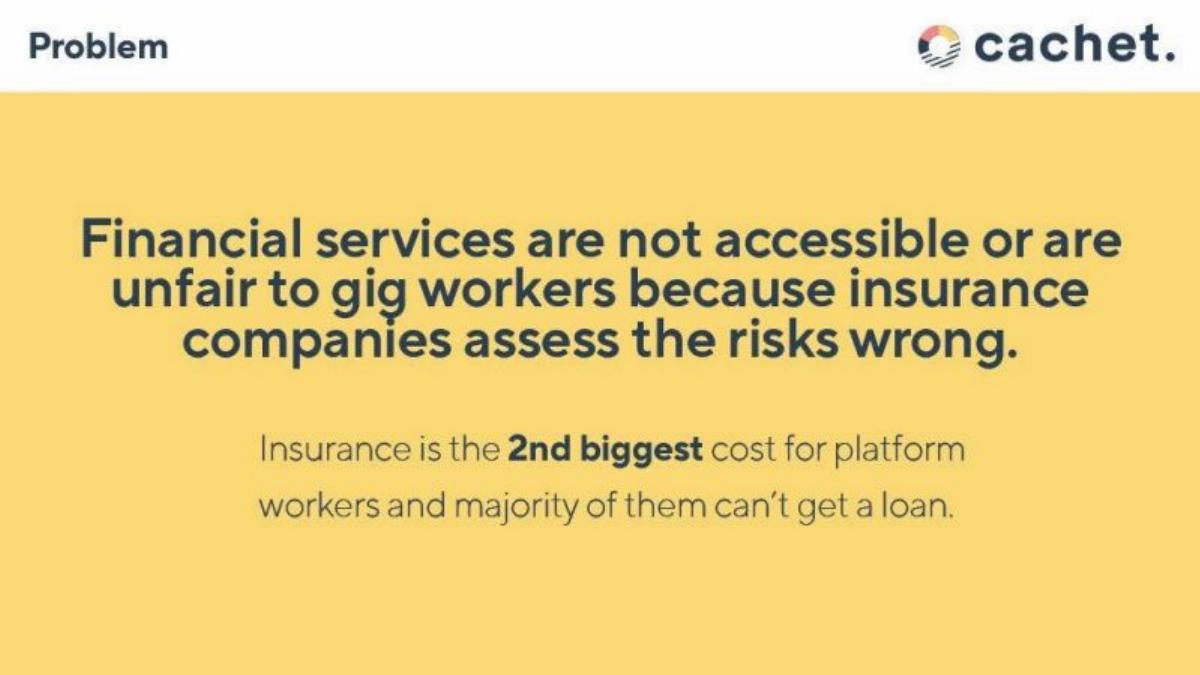
Insurance for gig-economy drivers. One headline and one supporting line.
Cachet deck, slide 5. Exact stored slide matched to this analysis.
Our analysis: One customer, one cause (risk assessed wrong) and one consequence (a major cost).
Evidence and limitation: A ranking ("2nd biggest cost"); no source.
What a founder can adapt: Put your cause after "because" in the headline.
Supporting analysis
What the deck claims: "Financial services are not accessible or are unfair to gig workers because insurance companies assess the risks wrong." "Insurance is the 2nd biggest cost for platform workers and majority of them can't get a loan."
Presentation choice: "Because insurance companies assess the risks wrong" is the reason the product exists, stated in one line.
When it does not fit: Say how the risk is assessed wrong, and cut the loan point, which is a different problem.
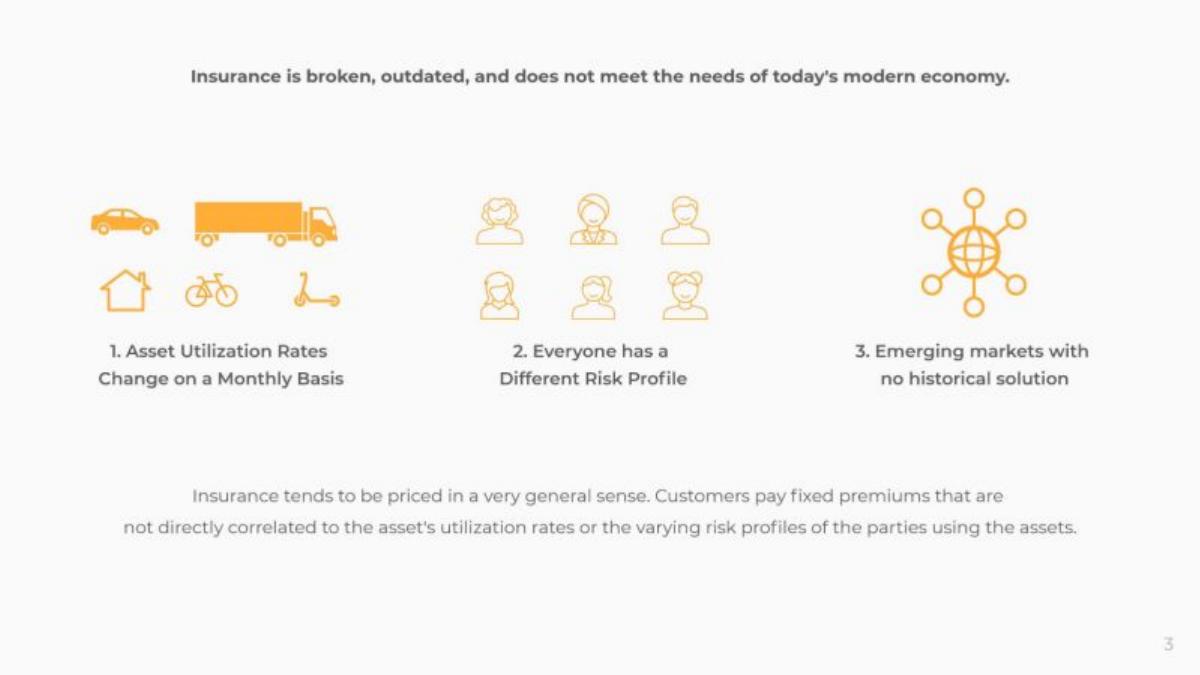
Usage-based insurance for vehicles and fleets. Three icon points and a closing line.
Lula deck, slide 2. Exact stored slide matched to this analysis.
Our analysis: The closing line explains mispricing clearly; the headline and icons are generic.
Evidence and limitation: No figures.
What a founder can adapt: Promote the closing line to the headline.
Supporting analysis
What the deck claims: "Insurance is broken, outdated, and does not meet the needs of today's modern economy." "1. Asset Utilization Rates Change on a Monthly Basis." "2. Everyone has a Different Risk Profile." "3. Emerging markets with no historical solution." "Insurance tends to be priced in a very general sense. Customers pay fixed premiums that are not directly correlated to the asset's utilization rates or the varying risk profiles of the parties using the assets."
Presentation choice: Fixed premiums against changing usage is a problem an investor can picture.
When it does not fit: Small grey type for the most important sentence.
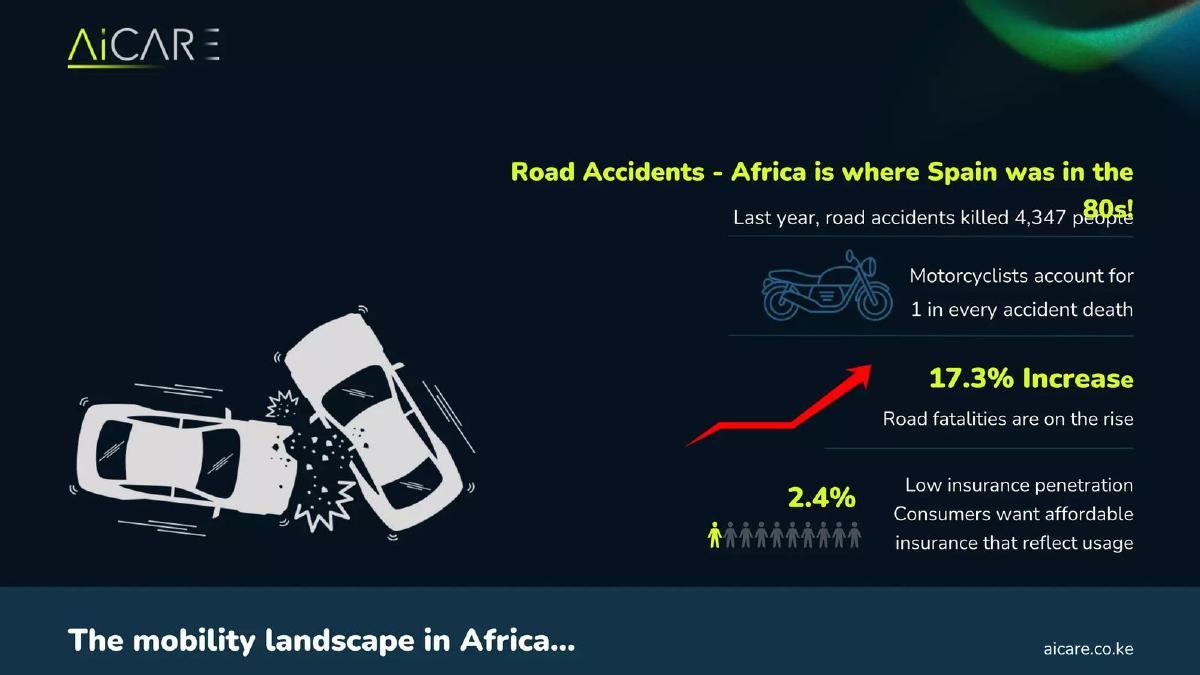
Motor insurance in Kenya. Road-safety statistics beside a crash illustration.
AiCare deck, slide 2. Exact stored slide matched to this analysis.
Our analysis: The risk is well evidenced; the insurance problem (2.4% penetration) is the last line.
Evidence and limitation: Several figures; no sources shown.
What a founder can adapt: Lead with the gap — high risk, low cover — and keep one risk figure.
Supporting analysis
What the deck claims: "Road Accidents - Africa is where Spain was in the 80s!" "Last year, road accidents killed 4,347 people." "Motorcyclists account for 1 in every accident death." "17.3% Increase: Road fatalities are on the rise." "2.4%: Low insurance penetration. Consumers want affordable insurance that reflect usage." Footer: "The mobility landscape in Africa..."
Presentation choice: Pairing high risk with low cover shows the gap in one slide.
When it does not fit: Burying the insurance point beneath road-safety statistics.
PrecisionEdge (trustininsurance) problem slide — slide 4
Insurance information platform for Nigeria's informal sector. Six bullets.
PrecisionEdge deck, slide 4. Exact stored slide matched to this analysis.
Our analysis: Partial: a strong opening figure and customer, followed by five other problems.
Evidence and limitation: One figure (90%); no source.
What a founder can adapt: Keep the first bullet and one reason; move the rest to notes.
Supporting analysis
What the deck claims: "Do you know that 90% of the informal sector have no insurance cover? The awareness among them is not just low but is unaffordable due to their irregular and low income." "The Nigerian market is doubtful of insurance companies." "Most insurance companies largely depend on the traditional agency model for selling insurance." "No viable independent platform in Nigeria where up to date research information about the industry can be sourced." "So many individuals have lapsed policies..."
Presentation choice: "90% of the informal sector have no insurance cover" is a clear, memorable gap.
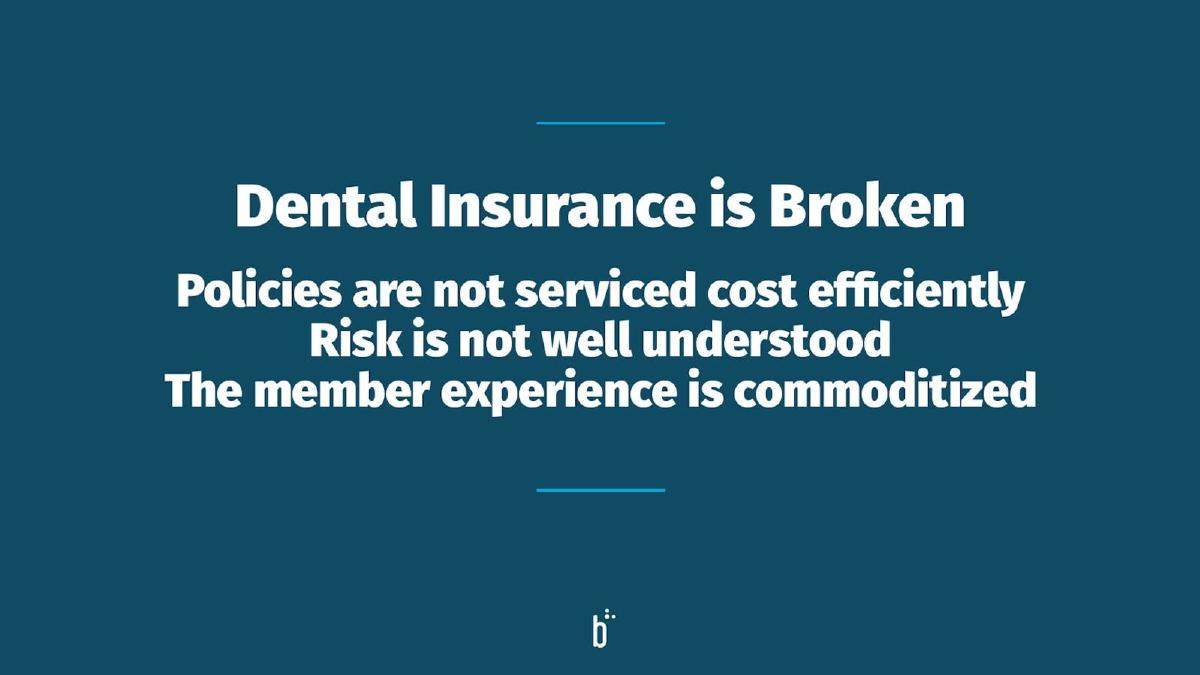
Dental insurance. Headline and three lines on blue.
Beam Dental deck, slide 3. Exact stored slide matched to this analysis.
Our analysis: Weak on purpose: three claims, no member or employer named, no example and no number.
Evidence and limitation: No figures.
What a founder can adapt: Pick one claim — "risk is not well understood" — and show what that costs someone.
Supporting analysis
What the deck claims: "Dental Insurance is Broken." "Policies are not serviced cost efficiently." "Risk is not well understood." "The member experience is commoditized."
Presentation choice: Kept as a contrast; compare Predina, which proves its claim with sourced figures.
When it does not fit: Claims an investor can't check.
Whether each slide says who loses out, why today's cover fails, and gives evidence.
Example
Who loses
Why cover fails
Evidence
Faye
Yes (both sides)
Yes
No
Predina
Yes (insurers)
No
Yes (sourced)
HERO
Yes (insurers)
Partly
Yes (unsourced)
Cachet
Yes (gig workers)
Yes (risk assessed wrong)
Partly
Lula
Partly
Yes (fixed premiums)
No
AiCare
Partly
Partly
Yes (unsourced)
PrecisionEdge
Yes (informal sector)
Partly
Partly (90%)
Beam Dental
No
Claimed
No
Key Takeaways
Say whose problem it is: the person buying cover, or the insurer paying claims.
The most common insurtech problem is mispriced risk — say who is priced wrong and why.
Insurance figures are easy to source (industry bodies, regulators); cite them.
"Insurance is broken" is a heading; the slide still needs the reason.
If both sides lose, show the link between them, as Faye does.
Build your insurtech problem slide
Whose problem, why today's cover fails them, one sourced figure.
Who. Policyholder, employer, broker or insurer?
Failure. Distrust, mispriced risk, slow claims, no cover at all?
Figure. One number with a year and a source (industry body, regulator, survey).
Today. What do they do now, and what does it cost them?
Copyable framework: [Who] [loses what] because [how today's insurance fails them]. [Figure] ([source, year]). Today they [workaround].
Illustrative example 1 — written by us
Before: Insurance is broken and doesn't meet the needs of the modern economy.
After: Delivery riders pay a fixed monthly premium of about $90 whether they ride 10 hours or 60; most ride under 25 hours a week. (Figures from our survey of 300 riders, 2026.)
What improved: Our illustrative rewrite; the figures are invented for the example. It names the customer, the mispricing and the scale.
What this guide adds
The insurtech go-to-market guide covers how insurance startups reach customers (brokers, embedded partners, direct). This guide covers the slide before it: why today's insurance fails someone. None of the eight slides here appears in another guide.
Insurance problems usually fall into three kinds: the customer doesn't trust or understand the product, the price doesn't match the risk, or the insurer is losing money.
Three things an insurtech problem slide proves
Who loses: "gig workers" (Cachet), "90% of the informal sector" (PrecisionEdge), auto insurers (Predina), travellers and incumbents (Faye).
Why today's cover fails: "insurance companies assess the risks wrong" (Cachet); "Customers pay fixed premiums that are not directly correlated to the asset's utilization rates or the varying risk profiles" (Lula).
Evidence: "$61B lost annually by insurers" (HERO); "2.4%" insurance penetration (AiCare); losses and average claim cost over time with a source line (Predina).
Common mistakes
"Insurance is broken". Say for whom and why.
Not choosing a side. Say whether the customer or the insurer is losing, or show how both are linked.
Unsourced figures. Insurance data is widely published; cite it.
Burying the insurance point. Risk statistics matter only if the slide says who isn't covered.
Too many problems. Pick one and give it a figure.
Diagnostic checklist
It says whose problem it is.
It says why today's insurance fails them.
It gives one figure with a year and source.
It says what they do today.
It focuses on one problem.
Frequently asked questions
How we chose these examples
Corpus: published pitch deck teardowns on StartupFundraising.com. Founder-uploaded private decks are excluded.
Selection (2026-09-25): we searched slides 2–5 for problem slides mentioning insurance, insurers, premiums, policyholders or claims. Nine stored images were inspected. HealthJoy slide 2 was left out because it is a healthcare overview rather than an insurance problem; Justpoint and Painworth were left out as legal claims rather than insurance. Beam and Beam Dental hold the same slide; the Beam Dental deck is used. PrecisionEdge is marked partial; Beam Dental is kept as a weaker contrast.
Overlap check: none of these eight slides appears in another guide. Other slides from the Cachet and HERO decks appear elsewhere (the licensing guide uses Cachet slide 3); their problem slides do not.
Review: all eight stored slide images were inspected on 2026-09-25 and matched to company, deck and slide number (editorial model review). No person has yet completed an editorial review of this page.
Claims are as shown on the slides; we have not verified them. We make no claim that any slide caused a fundraising outcome.