Insurtech Market Size Slides: 5 Real Insurance Examples
How insurance startups size their market: premium funnels, line-of-business comparisons, penetration benchmarks and scope definitions.
Insurtech Market Slide: Size the Premiums You Can Actually Write
Insurance is one of the largest markets in the world, so a headline premium total tells investors almost nothing. What they want is the line of business you write, the customers you insure and why that slice suits a new entrant. The five slides below range from a sourced premium funnel to a headline number with no source.
TL;DR
Start from sourced gross written premium, narrow it to your line of business and customer, and explain why that line is winnable. Lula steps from $1.3T of US premium (Swiss Re) to the commercial lines it serves. Beam Dental compares dental with medical, auto and home on loss severity and predictability, not just size. Sofía turns penetration benchmarks from other countries into a $11B to $25B range.
Insurtech market slides from real pitch decks
Each example shows the slide above its analysis and links to the full teardown. The clearest sizing comes first; the weakest is last for contrast. Claims are as shown on the slides; comments and calculations are ours.
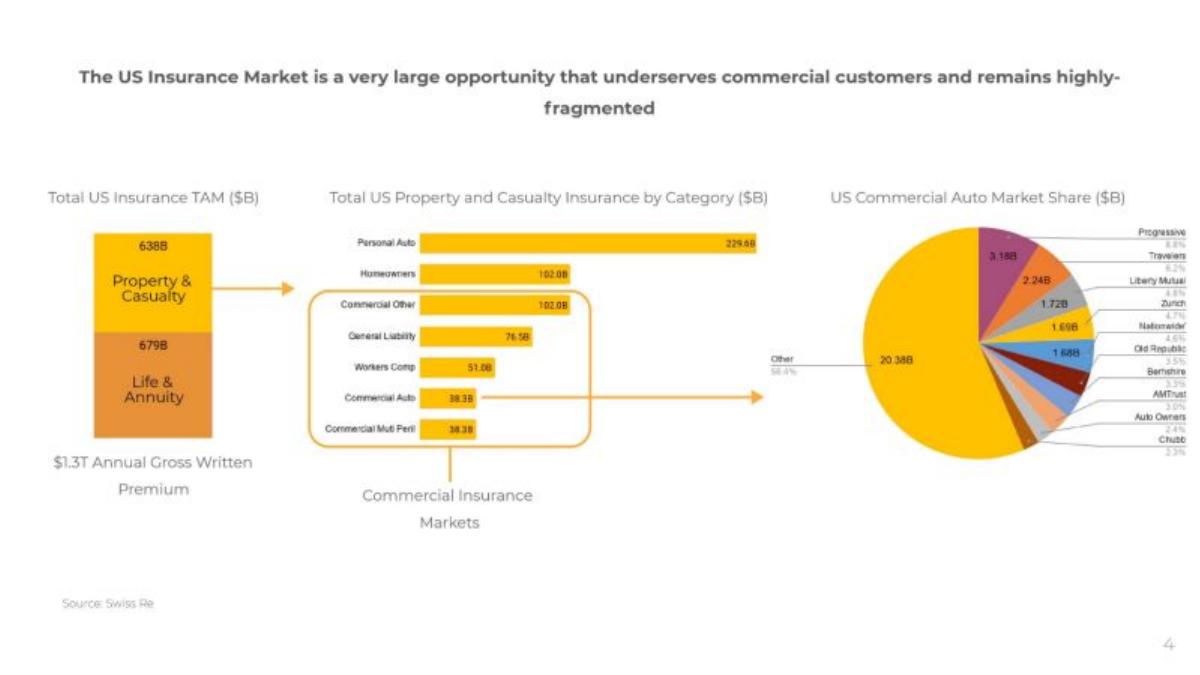
Lula market slide — slide 3
Commercial auto insurance for fleets, US. The slide is labelled 4 in the deck.
Lula deck, slide 3. Exact stored slide matched to this analysis.
Our analysis: A three-step funnel: all premium, the commercial lines, then share within commercial auto.
Evidence and limitation: One named source and figures in premiums. Our calculation: 638 + 679 = $1,317B, which matches the $1.3T; the five boxed commercial lines add up to about $306B. No year is given.
What a founder can adapt: "US premium $[X] ([source], [year]) → [line] $[Y] → top [N] carriers hold [%]."
Supporting analysis
What the deck claims: "The US Insurance Market is a very large opportunity that underserves commercial customers and remains highly-fragmented." "Total US Insurance TAM ($B)": "638B Property & Casualty", "679B Life & Annuity", "$1.3T Annual Gross Written Premium". "Total US Property and Casualty Insurance by Category ($B)": Personal Auto 229.6B, Homeowners 102.0B, Commercial Other 102.0B, General Liability 76.5B, Workers Comp 51.0B, Commercial Auto 38.3B, Commercial Multi Peril 38.3B, with the commercial lines boxed as "Commercial Insurance Markets". "US Commercial Auto Market Share ($B)": Other 58.4% (20.38B), Progressive 8.8% (3.18B), then Travelers, Liberty Mutual, Zurich and others. "Source: Swiss Re."
Presentation choice: Investors can follow the market down to the line Lula writes and see how split up it is.
When it does not fit: Stopping at the $1.3T headline without narrowing to the line you write.
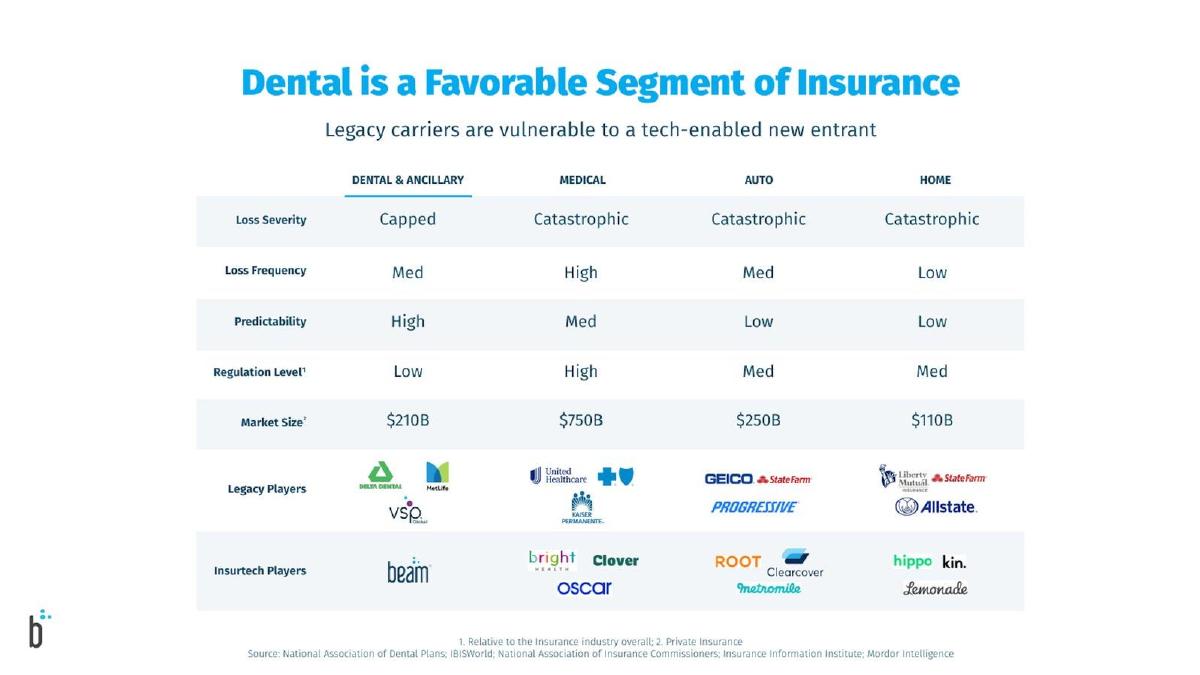
Beam Dental deck, slide 4. Exact stored slide matched to this analysis.
Our analysis: A segment-choice slide: why this line, not only how big it is.
Evidence and limitation: Named sources, and the market-size row is marked as private insurance. Dental is not the largest line in the table; the case rests on capped losses, high predictability and lighter regulation. The slide doesn't say which source supports which figure, or the year.
What a founder can adapt: "[Line] $[X] ([source], [year]) vs [alternatives]; our line wins on [severity / predictability / regulation]."
Supporting analysis
What the deck claims: "Dental is a Favorable Segment of Insurance." "Legacy carriers are vulnerable to a tech-enabled new entrant." Table comparing Dental & Ancillary, Medical, Auto and Home: Loss Severity "Capped" vs "Catastrophic" for the other three; Loss Frequency Med / High / Med / Low; Predictability High / Med / Low / Low; Regulation Level Low / High / Med / Med; Market Size $210B / $750B / $250B / $110B; legacy and insurtech players for each. Footnotes: "1. Relative to the insurance industry overall; 2. Private Insurance." Sources: National Association of Dental Plans, IBISWorld, NAIC, Insurance Information Institute, Mordor Intelligence.
Presentation choice: For an insurer, the risk profile of a line matters as much as its size, and this slide shows both.
When it does not fit: Showing only the biggest number. Pair size with the reason your line is winnable.
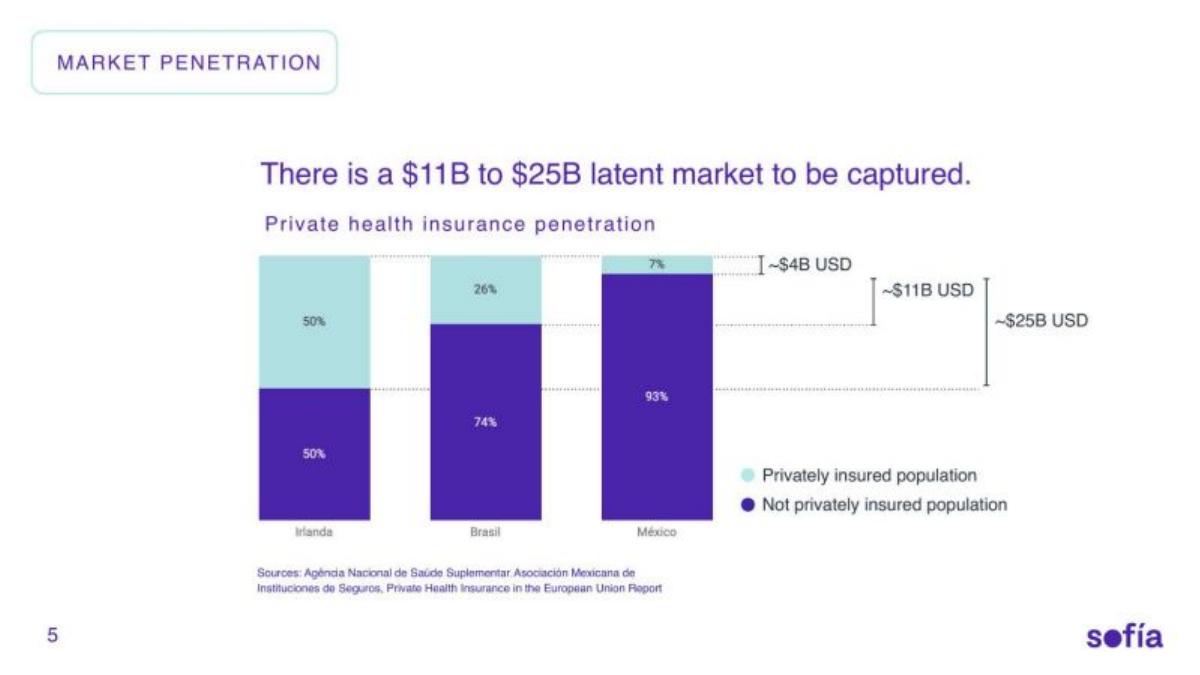
Sofía deck, slide 5. Exact stored slide matched to this analysis.
Our analysis: A benchmark range: what the market would be at other countries' coverage levels.
Evidence and limitation: Sourced penetration rates, and the range is built openly from two benchmarks. The dollar figures appear to scale today's ~$4B market by penetration; the slide doesn't show that calculation or the year.
What a founder can adapt: "Today $[X] at [%] coverage ([source]); at [benchmark country]'s [%] = $[Y]; at [second benchmark] = $[Z]."
Supporting analysis
What the deck claims: "MARKET PENETRATION." "There is a $11B to $25B latent market to be captured." "Private health insurance penetration": Ireland 50% privately insured, Brazil 26%, Mexico 7%. Brackets: "~$4B USD" at Mexico's 7%, "~$11B USD" at Brazil's level, "~$25B USD" at Ireland's level. Sources: Agência Nacional de Saúde Suplementar, Asociación Mexicana de Instituciones de Seguros, Private Health Insurance in the European Union Report.
Presentation choice: It gives investors a low and a high case they can argue with, instead of one unexplained number.
When it does not fit: Presenting the high end of a benchmark range as the market you will win.
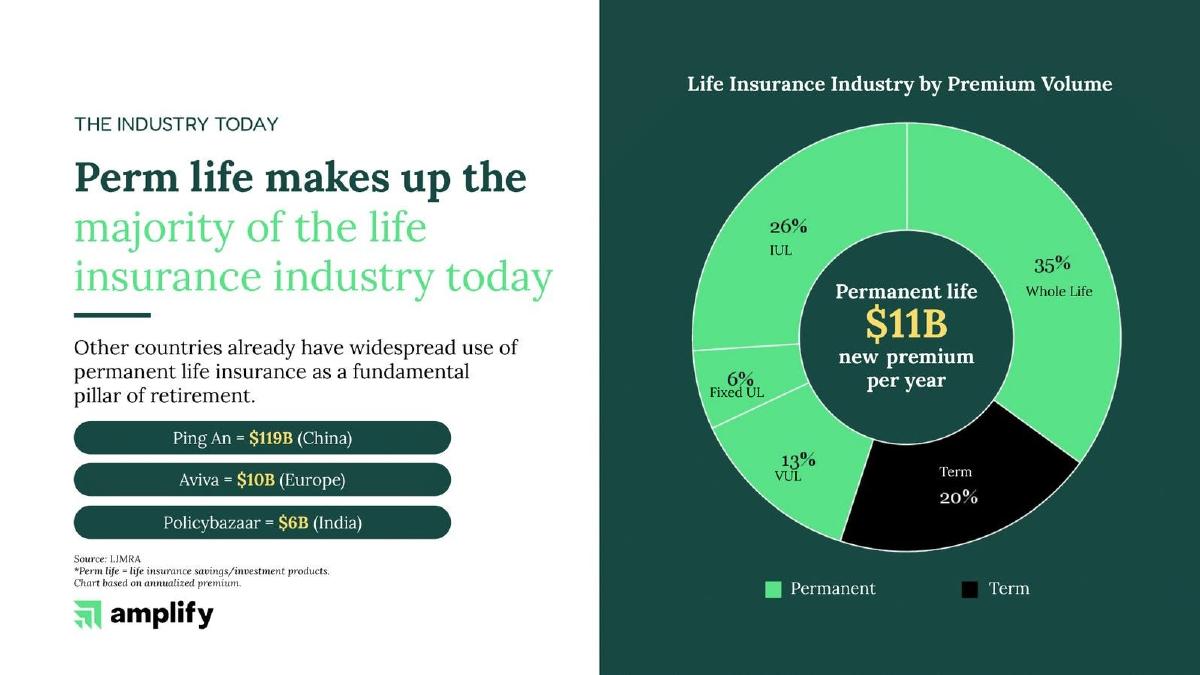
Amplify deck, slide 3. Exact stored slide matched to this analysis.
Our analysis: A product-mix chart that shows which kind of policy dominates new sales.
Evidence and limitation: The chart has a source and says it uses annualised new premium. Our calculation: the permanent segments add up to 80%, so the headline holds. The three company figures on the left are not labelled; they look like company values rather than premiums, so they don't measure the same thing as the chart.
What a founder can adapt: "New [product] premium $[X] a year ([source], [year]) = [%] of [line]." Keep comparisons in the same unit.
Supporting analysis
What the deck claims: "THE INDUSTRY TODAY." "Perm life makes up the majority of the life insurance industry today." "Other countries already have widespread use of permanent life insurance as a fundamental pillar of retirement." "Ping An = $119B (China)", "Aviva = $10B (Europe)", "Policybazaar = $6B (India)". Chart "Life Insurance Industry by Premium Volume": "Permanent life $11B new premium per year"; Whole Life 35%, IUL 26%, VUL 13%, Fixed UL 6%, Term 20%. "Source: LIMRA." "Chart based on annualized premium."
Presentation choice: It shows the product Amplify sells is the largest share of new premium.
When it does not fit: Placing company valuations next to premium figures as if they were comparable.
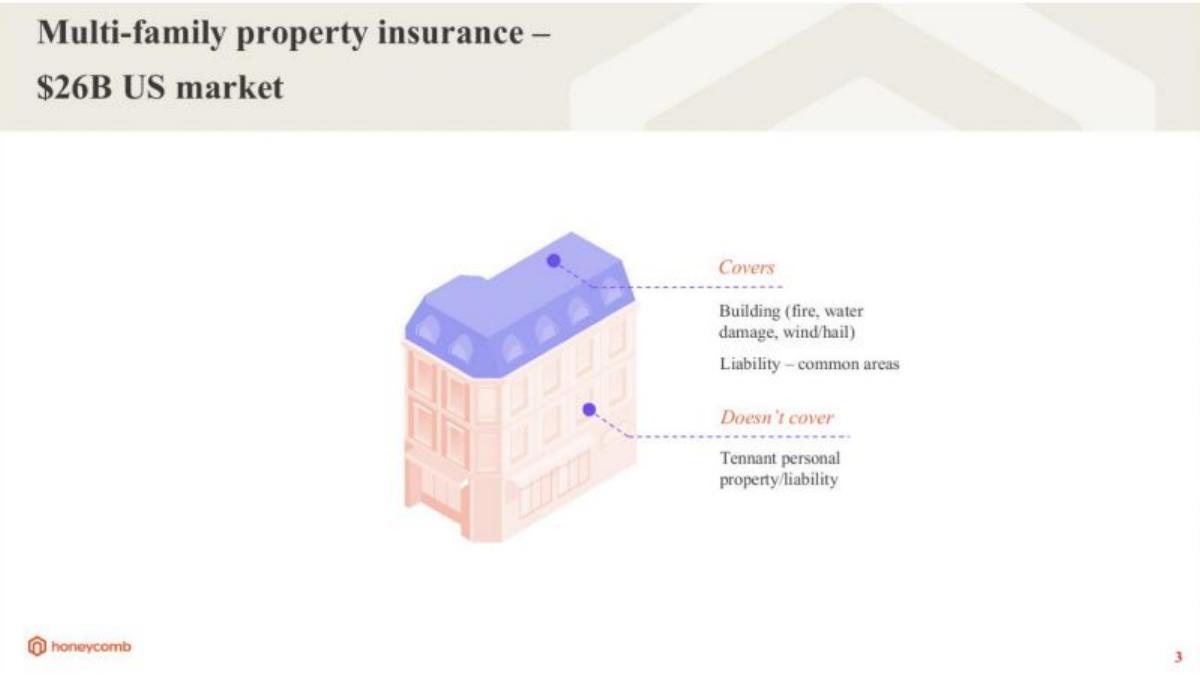
Honeycomb deck, slide 3. Exact stored slide matched to this analysis.
Our analysis: A scope slide with a headline number attached.
Evidence and limitation: A clear definition of what the policy covers and doesn't, but the $26B figure has no source, year or explanation of how it was reached.
What a founder can adapt: Keep the scope diagram and add: "[N] multifamily buildings × $[average premium] = $[X] ([source], [year])."
Supporting analysis
What the deck claims: "Multi-family property insurance – $26B US market." "Covers": "Building (fire, water damage, wind/hail)", "Liability – common areas". "Doesn't cover": "Tennant personal property/liability."
Presentation choice: Included as a contrast: defining scope is useful, but the number needs support.
When it does not fit: A headline premium figure with no source.
What improved: Our illustrative rewrite of the Honeycomb headline; bracketed text is a placeholder, not company fact.
What's different about insurance market sizing
Insurance markets are measured in gross written premium and published by line of business (property, casualty, life, health) by regulators and industry bodies, which gives a checkable base. Lines behave very differently: loss severity, regulation and distribution decide whether a new carrier or MGA can compete. Penetration also varies by country, so many emerging-market insurtechs size their opportunity by benchmarking against countries with higher coverage.
What investors check
Whether the figure is premium, and for which line and country. Whether each figure has a source. Whether the step from total premium to the line served is shown. Whether benchmark-based ranges are presented as scenarios rather than facts. Whether unlike measures, such as company valuations and premium volumes, sit side by side.
How we read each slide
We quote the text on the stored slide images and mark our own arithmetic as ours. We have not checked any market figure or source. Page numbers are pages in the original deck file.
Common mistakes
Total insurance premium as your market. Size the line you write.
Numbers with no source. Cite regulators or industry bodies.
Company values beside premiums. Compare like with like.
Benchmark ranges shown as fact. Label them as scenarios.
Diagnostic checklist
Market measured in premium.
Line of business and customer named.
Source and year for each figure.
Why the line is winnable.
Company target share.
Frequently asked questions
How should an insurtech size its market?
Start from sourced gross written premium, narrow it to your line and customer, and explain why that line suits you. Lula steps from $1.3T US premium (Swiss Re) to the commercial lines it serves.
Can I size an emerging insurance market with benchmarks?
Yes, if you show the benchmarks. Sofía uses private health coverage in Brazil (26%) and Ireland (50%) to turn Mexico's 7% into a $11B to $25B range.
How we chose these examples
Corpus: published pitch deck teardowns on StartupFundraising.com. Founder-uploaded private decks are excluded.
Selection (2026-09-28): we searched teardown slide text for market-size wording together with insurance, insurtech, premium and underwriting terms, shortlisted seven slides and kept five.
Excluded: CyberPal p4 (already used in the cybersecurity market guide), Arbol p8 (no stored slide image) and a duplicate Beam deck. Slides already used in other guides were not reused.
Page numbers are pages in the original deck files. All five images were stored and viewed on 2026-09-28.
Market figures and sources are quoted from the slides and not independently verified. Calculations (sums, shares) are ours and marked as such.
Review: slide images were checked on 2026-09-28 and matched to company, deck and page (editorial model review). No person has yet completed an editorial review of this page. We make no claim that any slide caused a fundraising outcome.