PlanetWatchers utilized an 11-slide deck to secure $11M in Series A funding, focusing on the intersection of agricultural technology and insurance (InsurTech). The deck identifies a significant market gap: the inability of traditional optical satellites and drones to monitor crops at scale due to weather interference and high costs. By leveraging radar technology, PlanetWatchers provides persistent monitoring for a $17bn U.S. crop insurance market and the growing carbon credit sector. The presentation emphasizes a clear go-to-market strategy in the U.S., citing 220 million acres of primary cr…
Key takeaways
- The U.S. crop insurance market represents a $17bn market with over $100bn in liability, as stated on Slide 2.
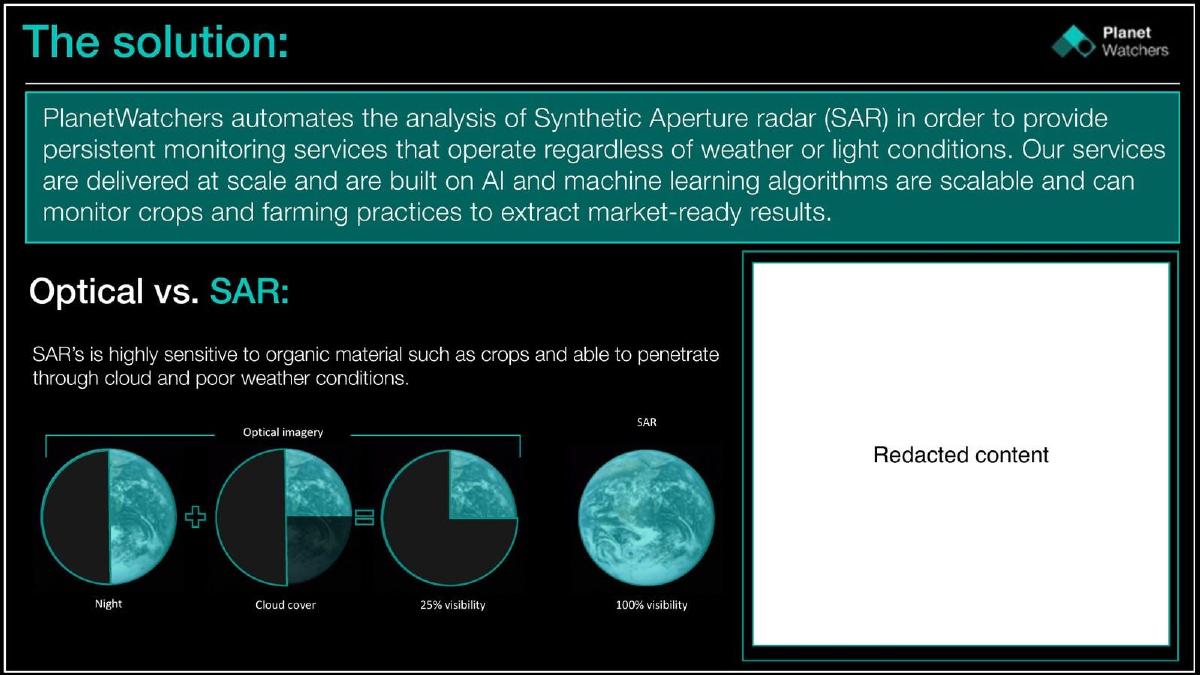
- Optical satellite imagery is limited to 25% visibility due to cloud cover and lighting, creating a need for PlanetWatchers' radar-based solution (Slide 2).
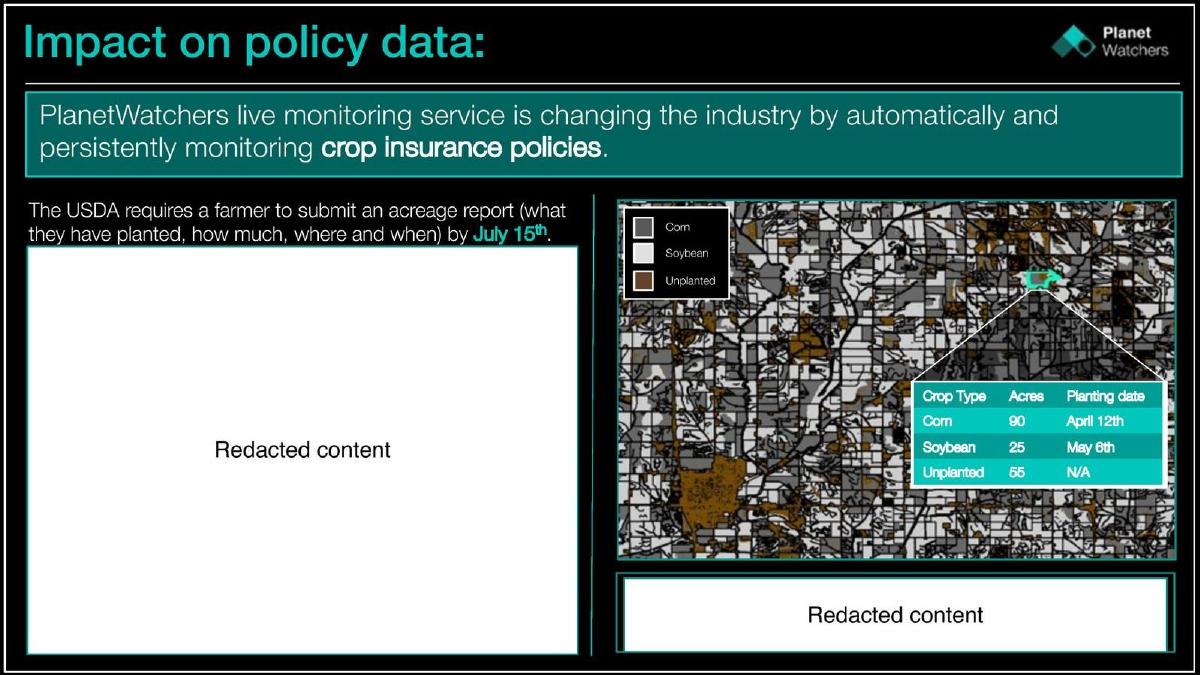
- The platform automates the USDA-required acreage reports that farmers must submit by July 15th (Slide 3).
- Sustainability validation is a core use case, specifically monitoring tillage and cover crop indices to facilitate carbon credit markets (Slide 4).
- The company targets 220 million acres of corn, cotton, soybean, and wheat planted annually in the USA (Slide 5).
- The business model is defined as Agriculture-as-a-Service (AaaS) to drive recurring revenue (Slide 6).
- The deck identifies specific agricultural events for monitoring, including hail damage, wind damage, and emergence (Slide 5).
- A significant portion of the deck's specific traction and revenue figures were redacted in the public version, though the publisher reports an $11M raise (Slide 6).
PlanetWatchers Series A Teardown
PlanetWatchers, a European-based startup, successfully raised $11M in 2024 to scale its agricultural intelligence platform. The company focuses on using synthetic aperture radar (SAR) to provide persistent, all-weather monitoring of crops. This technology is positioned as a critical tool for the insurance industry, which manages massive liabilities but lacks reliable, scalable data to validate claims. The deck is concise at 11 slides, focusing heavily on the U.S. market and the technical ability to monitor specific agricultural milestones.
Slide 1: Title Slide
The opening slide introduces the company name and the tagline: "Living intelligence from every field." The background features a high-contrast radar image of a river and surrounding land, immediately signaling the company's technical focus on Earth observation and geospatial data. The branding is clean, using a teal and black color palette that persists throughout the presentation.
Slide 2: Challenges in Agriculture
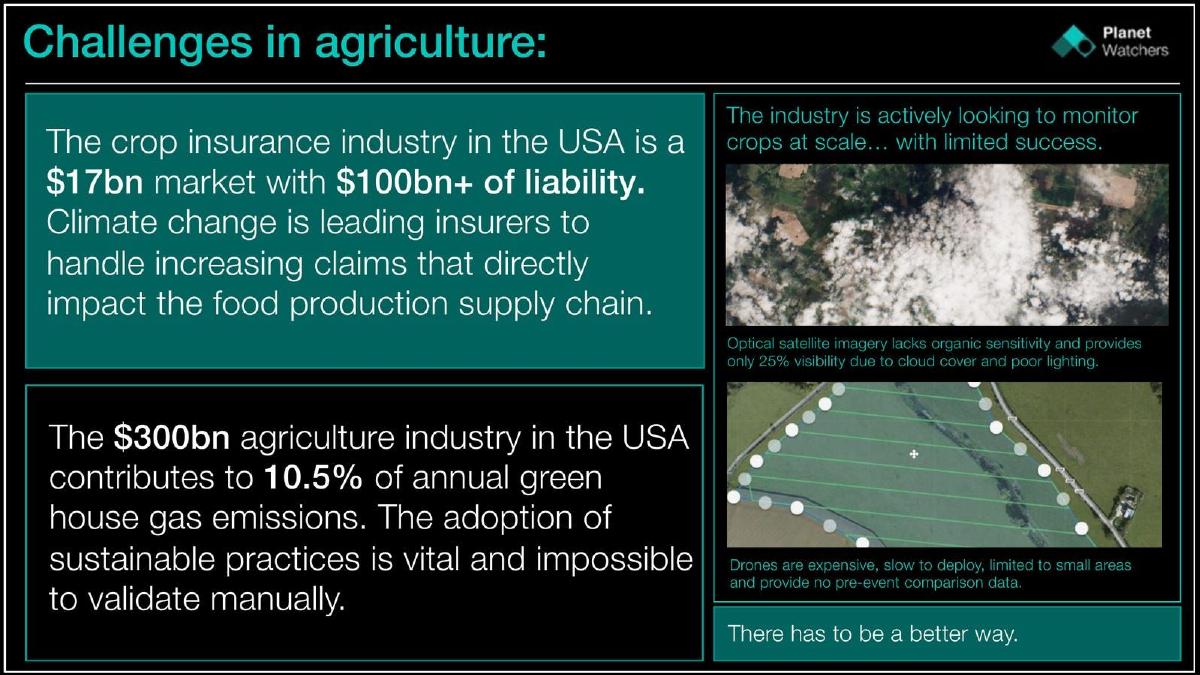
This slide establishes the market pain points and the total addressable market (TAM). It highlights that the U.S. crop insurance industry is a "$17bn market with $100bn+ of liability." It also notes that the broader U.S. agriculture industry is worth $300bn and contributes to 10.5% of annual greenhouse gas emissions. The slide identifies the failure of current technologies: optical satellites offer only "25% visibility due to cloud cover" and drones are "expensive, slow to deploy, [and] limited to small areas." This sets the stage for a solution that can see through clouds and cover large areas cost-effectively.
Slide 3: Impact on Policy Data
Slide 3 focuses on the insurance use case. It mentions that the USDA requires farmers to submit acreage reports by July 15th . PlanetWatchers claims to change the industry by "automatically and persistently monitoring crop insurance policies." The slide includes a map visualization showing different crop types (Corn, Soybean, Unplanted) and a data table showing planting dates and acreage. This demonstrates the platform's ability to provide granular, time-stamped data that matches regulatory requirements.
Slide 4: Impact on Sustainability
The deck pivots to the sustainability market, noting that agricultural input providers have public targets connected to carbon credit markets . The slide features two charts: a Tillage Activity Index and a Cover crop Index . These indices allow the company to detect sustainable practices "without visiting the field." By automating this validation, PlanetWatchers positions itself as an essential infrastructure layer for the carbon economy, where manual verification is a major bottleneck.
Slide 5: USA - Our First Market
This slide details the go-to-market strategy and the specific events the platform monitors. It highlights 220 million acres of corn, cotton, soybean, and wheat in the USA. A circular graphic lists the monitoring capabilities: Tillage detection, Prevented planting, Planting, Replanting, Emergence, Crop identification, Crop acres, Wind damage, Hail damage, Harvest, and Cover crop detection. This comprehensive list shows that the service covers the entire growing season, providing multiple touchpoints for revenue.
Slide 6: Why PlanetWatchers
The final content slide summarizes the investment thesis across three pillars: Our USP, Our traction, and Our potential. The USP (Unique Selling Proposition) is the ability to provide analysis at a "low unit cost to unlock the analysis of acres at scale." The traction section mentions working relationships with major industry players (names redacted) and a clear route to growth. The potential section suggests a significant revenue opportunity through the "AaaS" (Agriculture-as-a-Service) model. The slide emphasizes that the leadership team is experienced and ambitious.
What PlanetWatchers Does Well
The PlanetWatchers deck is highly effective at identifying a high-stakes, underserved niche. By focusing on the $100bn+ liability in the U.S. crop insurance market, they move the conversation away from generic "ag-tech" and into the realm of financial risk management. This is a much more compelling sell for Series A investors looking for clear ROI.
The technical differentiation is also handled well. Instead of getting bogged down in the physics of synthetic aperture radar, the deck focuses on the outcome: overcoming the 25% visibility limit of optical satellites. By framing the technology as a solution to a specific environmental constraint (clouds and lighting), they make the technical advantage easy to understand for non-technical investors.
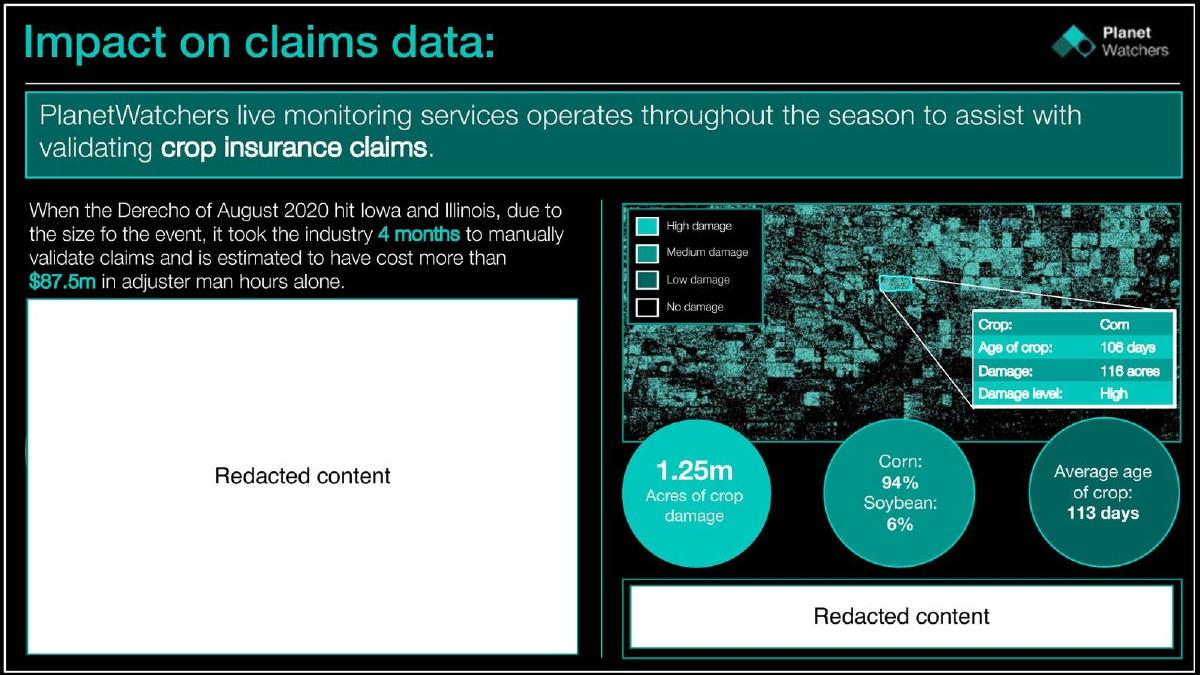
Furthermore, the deck does a great job of showing the versatility of the data. The transition from insurance claims (Slide 3) to sustainability and carbon credits (Slide 4) shows that the same data stream can be sold into multiple high-value verticals, increasing the potential lifetime value of their technology stack.
What is Missing from the Deck
The most notable omission in the provided slides is a dedicated team slide . While Slide 6 mentions an "experienced leadership team," it does not list names, backgrounds, or previous successes. For a Series A round, investors typically want to see deep expertise in both geospatial technology and the insurance industry.
There is also a lack of detailed financial history or projections . While the publisher reports an $11M raise, the deck itself (in this version) redacts the specific ARR and revenue potential figures. A standard Series A deck would usually include a slide on unit economics, showing the cost to acquire a customer (CAC) versus the lifetime value (LTV), especially given the claim of "low unit cost" on Slide 6.
Finally, the deck lacks a competitor landscape . While it mentions why optical satellites and drones are insufficient, it does not address other radar-based startups or established geospatial giants. Investors would want to know how PlanetWatchers protects its market share against other players using similar SAR data sources.
Founder Takeaways
Focus on the 'Unsolvable' Problem: PlanetWatchers doesn't just say they are better; they point out that existing solutions literally cannot see through clouds (Slide 2). If your technology overcomes a physical or structural limitation that the rest of the market accepts as a given, make that the centerpiece of your pitch.
Align with Regulatory Deadlines: By mentioning the USDA's July 15th deadline (Slide 3), PlanetWatchers shows they understand the operational reality of their customers. Founders should identify the specific dates, laws, or reporting requirements that force their customers to act, and show how their product makes meeting those requirements easier.
Define a Clear 'First Market': The deck is very specific about the U.S. being the first market and lists the exact crops and acreage they are targeting (Slide 5). This specificity gives investors confidence that the team isn't just throwing darts at a map but has a calculated plan for geographic and sectoral expansion.
Use Visual Proof of Product: The inclusion of the Tillage and Cover Crop indices (Slide 4) acts as a mini-demo. It shows that the company isn't just selling a vision; they have the algorithmic capability to turn raw radar data into actionable indices that customers can use immediately.
Frequently asked questions
- What is the primary problem PlanetWatchers solves for insurers?
- According to Slide 2, the primary problem is the lack of visibility. Traditional optical satellites only provide 25% visibility due to cloud cover, and drones are too expensive to deploy at scale. PlanetWatchers provides 'living intelligence' that works regardless of weather, allowing insurers to validate claims and monitor $100bn+ in liability without manual field visits.
- How does PlanetWatchers contribute to agricultural sustainability?
- Slide 4 explains that the platform automates the detection of sustainable practices like cover cropping and specific tillage activities. This data is vital for agricultural input providers who have public sustainability targets linked to carbon credit markets, as these practices are currently impossible to validate manually at scale.
- What is the specific market size mentioned in the deck?
- Slide 2 cites two major figures: a $17bn crop insurance market in the USA and a broader $300bn agriculture industry. Slide 5 further narrows the immediate opportunity to the 220 million acres of corn, cotton, soybean, and wheat planted every year in the United States.
- What is the 'AaaS' model mentioned in the deck?
- Slide 6 refers to 'AaaS' as 'Agriculture-as-a-Service.' The company intends to use this model to grow recurring revenues significantly by providing agricultural intelligence at scale to insurers and input providers.
- Does the deck include a competitive analysis?
- Slide 2 provides a high-level comparison against existing methods. It notes that optical satellite imagery lacks 'organic sensitivity' and visibility, while drones are described as expensive, slow, and lacking pre-event comparison data. However, it does not name specific corporate competitors.