Revenue per Employee in a Pitch Deck: Define the Revenue
How to show revenue or ARR per employee in a pitch deck so investors can check it: which revenue figure, which headcount, which period.
Revenue per Employee in Your Pitch Deck: How to Show Team Efficiency Investors Can Check
Five slides from five real pitch decks use revenue per employee, or the two numbers it is made from, to argue that a team is efficient. A healthcare AI company prints ARR per employee and its growth while hiding ARR itself, an equity-management company puts headcount and ARR side by side, a media start-up forecasts revenue per full-time employee for five years, a fintech plans its team size against a revenue target, and a lending company makes the claim with the number blanked out. Each shows a different part of what makes the figure checkable.
TL;DR
Revenue per employee is revenue divided by headcount. Investors use it to judge whether a team is growing faster or slower than its revenue, so the figure is only useful when they know what is on top and what is underneath. Say which revenue figure you use (recognised revenue, ARR, or revenue after partner shares), which headcount (employees only or including full-time contractors, at the end of the period or on average), the date or period, and the trend.
Our recommendation: show it as a trend beside your hiring plan, not as a standalone headline. Of the five slides below, Carta gives both inputs so the reader can compute it; Week's Best gives a five-year forecast row; Thoughtful AI prints the ratio and its growth, which together can imply a headcount change the slide does not explain; Cent Capital states team size and a revenue target so the ratio can be derived; Defacto makes the claim without a number.
Five real slides that use revenue per employee
Each slide is shown as it appears in the original deck, followed by what it says, what we checked and what a founder can take from it.
Carta traction slide — slide 14
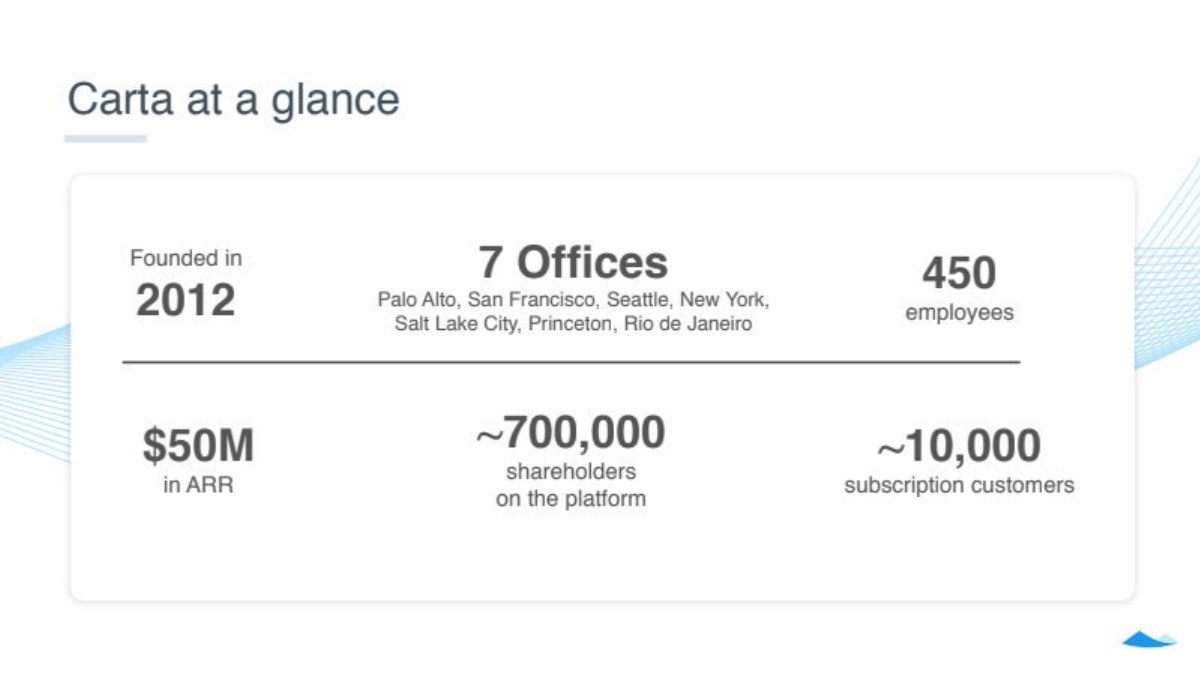
Equity-management software; Series D deck. A page headed "Carta at a glance".
Carta deck, slide 14. Exact stored slide matched to this analysis.
Our analysis: The plainest example: two current, point-in-time figures side by side, so the reader can compute the ratio on a consistent basis. It is a snapshot, not a trend.
Evidence and limitation: The slide does not print revenue per employee, but gives both inputs. Our calculation: $50,000,000 ÷ 450 = about $111,000 of ARR per employee. On the same figures, ARR per subscription customer is $50,000,000 ÷ 10,000 = $5,000, and there are about 22 customers per employee (10,000 ÷ 450). The slide has no date, does not say whether the 450 includes contractors, and gives no earlier figure for comparison.
What a founder can adapt: Put current ARR and current headcount on the same slide with a date, and add the figures from a year earlier so the trend is visible.
Supporting analysis
What the deck claims: Six facts: founded in 2012; 7 offices (Palo Alto, San Francisco, Seattle, New York, Salt Lake City, Princeton, Rio de Janeiro); 450 employees; $50M in ARR; ~700,000 shareholders on the platform; ~10,000 subscription customers.
Presentation choice: Gives investors the raw inputs instead of a computed headline, which makes the figure checkable.
When it does not fit: Don't leave the reader to guess whether headcount includes contractors or the offices you list.
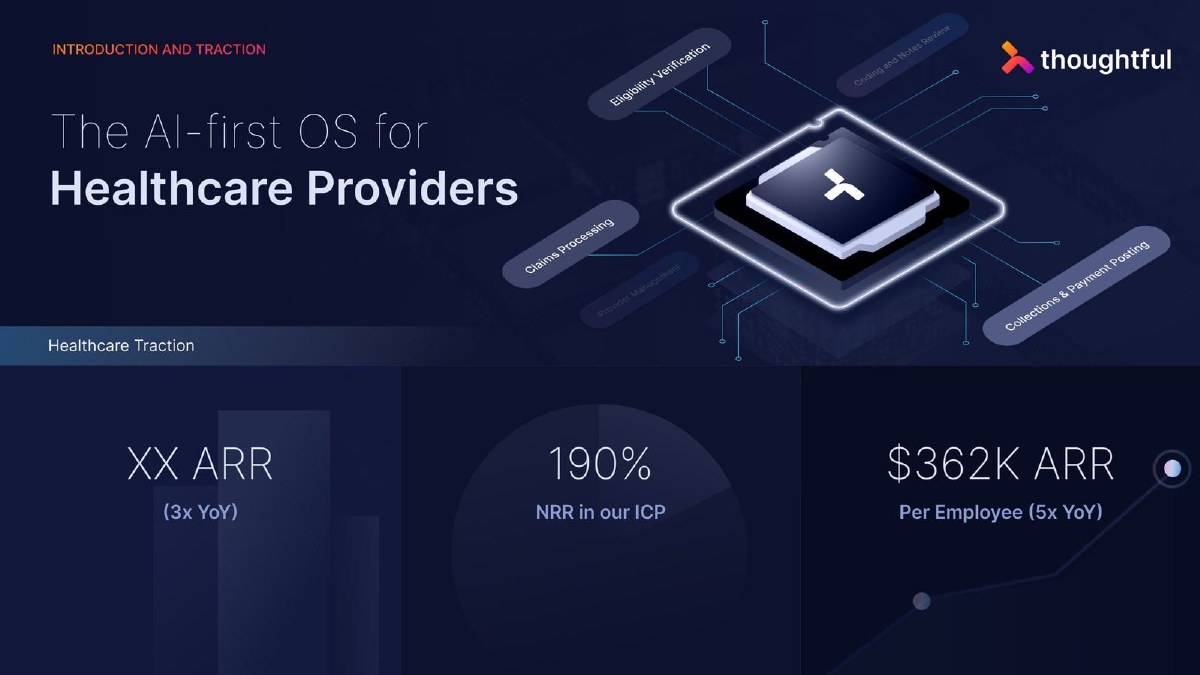
AI automation for healthcare providers' administrative work (eligibility, claims, payment posting). The opening page, headed "Introduction and Traction", with a "Healthcare Traction" strip.
Thoughtful AI deck, slide 1. Exact stored slide matched to this analysis.
Our analysis: A strong headline efficiency figure with growth, placed on the first page. Printing the ratio's growth next to revenue growth can imply a headcount change, which the slide doesn't confirm or explain.
Evidence and limitation: ARR itself is shown as XX in the version of the deck we hold, so headcount cannot be computed and we do not estimate either. Our calculation from the two printed multiples: if ARR grew 3x and ARR per employee grew 5x over the same year, end headcount would be 3 ÷ 5 = 0.6 times the starting headcount, about 40% fewer people; that holds only if periods, revenue definitions and headcount bases match, so it is not a verified reduction. The slide does not say whether the multiples cover the same period, whether headcount includes contractors, or whether the 3x refers to healthcare ARR only (the strip is labelled "Healthcare Traction").
What a founder can adapt: If you headline revenue per employee, give the headcount definition and the date, and check what your printed growth rates imply about team size.
Supporting analysis
What the deck claims: Three tiles: "XX ARR (3x YoY)"; "190% NRR in our ICP"; "$362K ARR Per Employee (5x YoY)".
Presentation choice: Leads with an efficiency figure investors in AI automation look for, and gives its growth rather than a single point.
When it does not fit: Don't print two related growth multiples whose implied third figure you would not want to explain in the meeting.
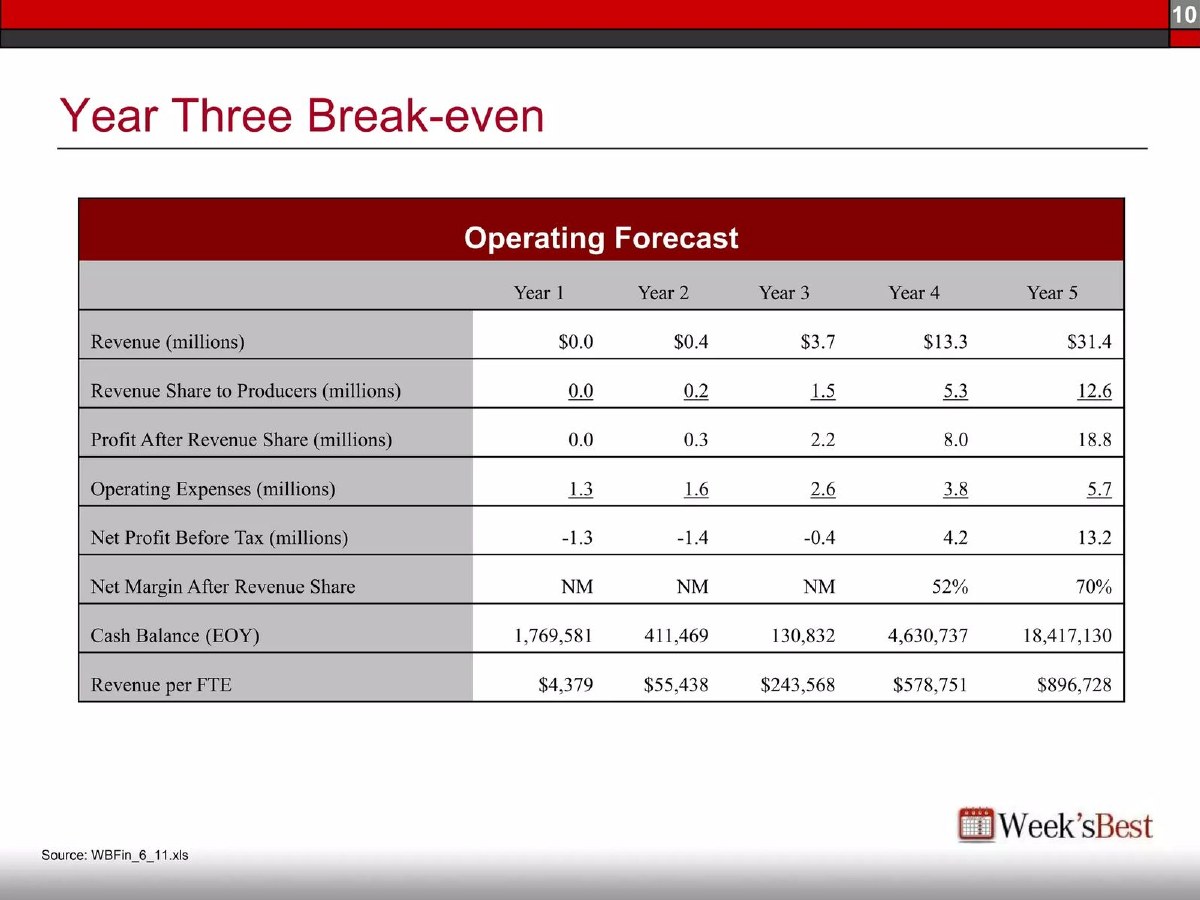
Curated media start-up that shares revenue with content producers. A page headed "Year Three Break-even", table titled "Operating Forecast"; source note "WBFin_6_11.xls".
Week's Best deck, slide 10. Exact stored slide matched to this analysis.
Our analysis: The only example with a series, and the only one that labels its denominator (FTE). The series rises more than 200-fold from year 1 to year 5 (896,728 ÷ 4,379 = 205), which mainly reflects a very small starting revenue; the gross basis flatters the figure for a revenue-share business.
Evidence and limitation: Our calculations, using the rounded revenue figures: implied full-time employees are about 7 in year 2 (400,000 ÷ 55,438 = 7.2), 15 in year 3 (3,700,000 ÷ 243,568 = 15.2), 23 in year 4 (13,300,000 ÷ 578,751 = 23.0) and 35 in year 5 (31,400,000 ÷ 896,728 = 35.0). Year 1 revenue is rounded to $0.0M, so its headcount cannot be derived. The row uses gross revenue: on profit after revenue share, year 5 is about 18,800,000 ÷ 35 = $537,000 per FTE. Producers take 40% of year 5 revenue (12.6 ÷ 31.4 = 0.401). Every figure is a forecast.
What a founder can adapt: Add a headcount row above revenue per FTE so the reader doesn't have to derive it, and say whether revenue is gross or after partner shares.
Supporting analysis
What the deck claims: Years 1 to 5: revenue ($M) 0.0, 0.4, 3.7, 13.3, 31.4; revenue share to producers 0.0, 0.2, 1.5, 5.3, 12.6; profit after revenue share 0.0, 0.3, 2.2, 8.0, 18.8; operating expenses 1.3, 1.6, 2.6, 3.8, 5.7; net profit before tax −1.3, −1.4, −0.4, 4.2, 13.2; net margin after revenue share NM, NM, NM, 52%, 70%; cash balance (end of year) 1,769,581 to 18,417,130; revenue per FTE $4,379, $55,438, $243,568, $578,751, $896,728.
Presentation choice: Lets an investor see team growth and revenue growth together in one row, and back out the implied headcount.
When it does not fit: Don't compute revenue per employee on gross revenue when a large share passes to partners without saying so.
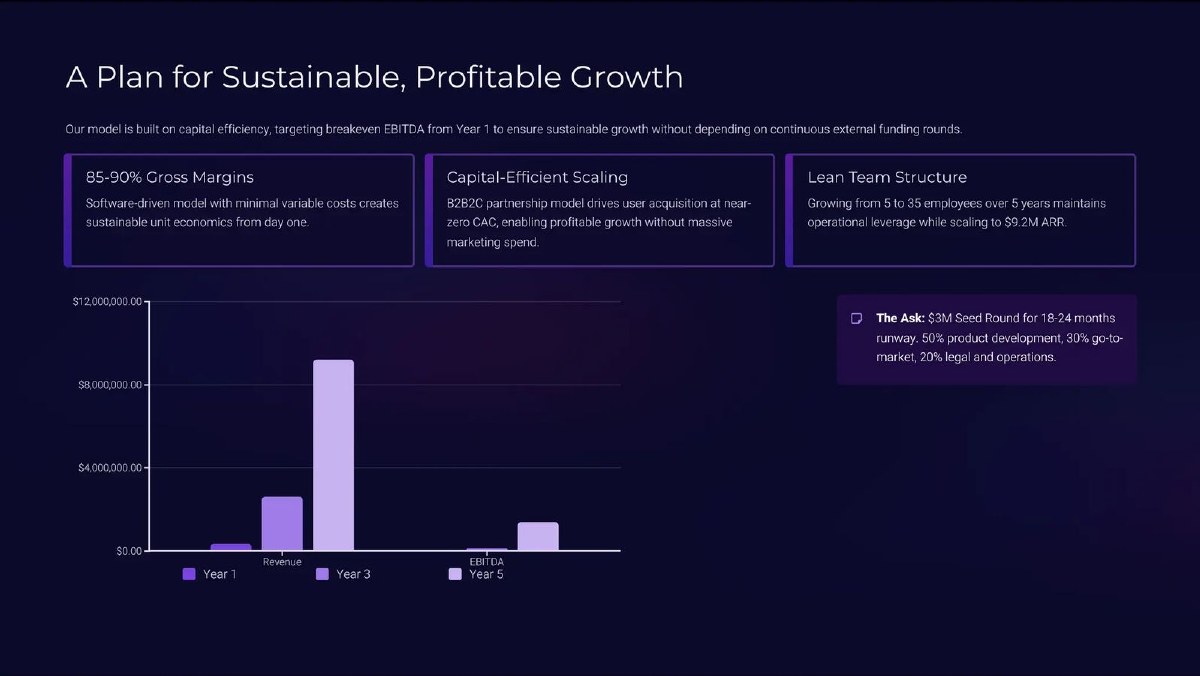
AI financial-wellness app sold through partners (B2B2C). A page headed "A Plan for Sustainable, Profitable Growth", raising a $3M seed round.
Cent Capital deck, slide 12. Exact stored slide matched to this analysis.
Our analysis: A plan that ties team size to a revenue target, which is what makes revenue per employee useful in a fundraise. The ratio itself is left for the reader to compute, and only for the final year.
Evidence and limitation: Our calculation: $9,200,000 ÷ 35 = about $263,000 of ARR per employee in year 5, a forecast. The chart's year 1 and year 3 bars carry no labels, so we do not estimate revenue per employee for those years. The slide gives the start and end of the team plan but not the path between them or the current revenue.
What a founder can adapt: Show headcount and revenue for each year of the plan, with the ratio, and today's figures as the starting point.
Supporting analysis
What the deck claims: Three boxes: "85-90% Gross Margins"; "Capital-Efficient Scaling" (near-zero acquisition cost through partners); "Lean Team Structure: Growing from 5 to 35 employees over 5 years maintains operational leverage while scaling to $9.2M ARR." A bar chart of revenue and EBITDA for years 1, 3 and 5; "The Ask: $3M Seed Round for 18-24 months runway. 50% product development, 30% go-to-market, 20% legal and operations."
Presentation choice: Shows investors the team will grow more slowly than revenue, connecting the hiring plan to the forecast.
When it does not fit: Don't describe a team as lean without giving the number it is lean against.
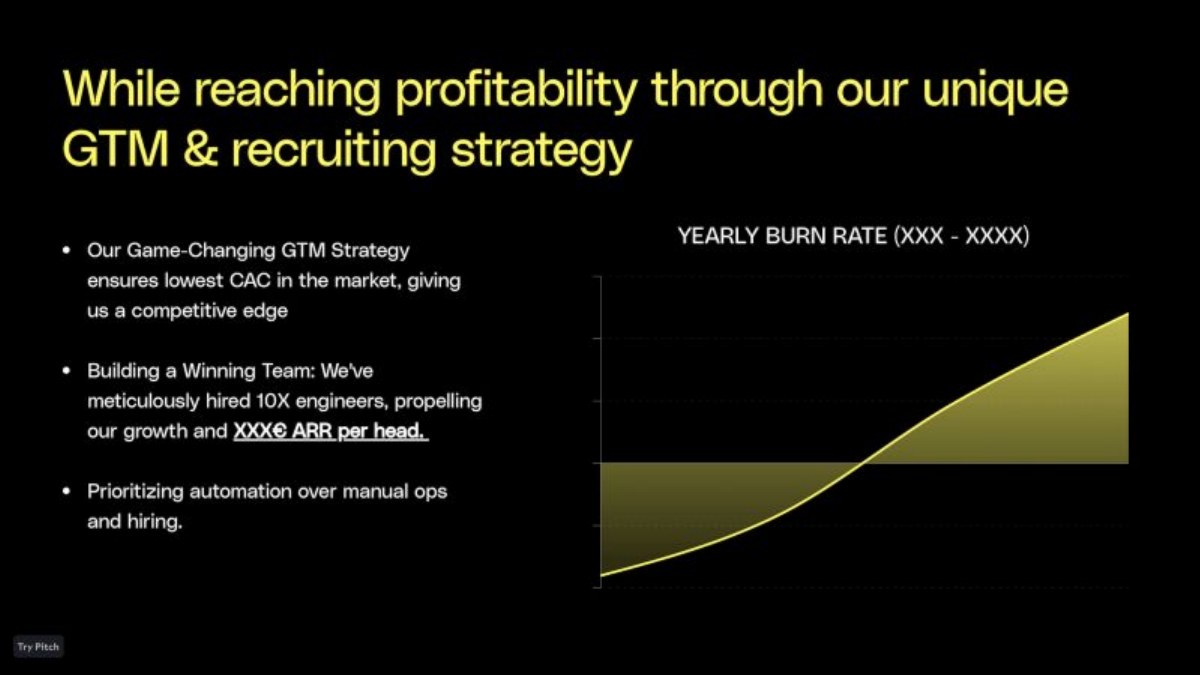
Embedded lending for small businesses via API. A page headed "While reaching profitability through our unique GTM & recruiting strategy".
Defacto deck, slide 17. Exact stored slide matched to this analysis.
Our analysis: A contrast case: the right idea (link team efficiency to hiring and automation choices) without a checkable figure in the shared version.
Evidence and limitation: The ARR-per-head figure and the chart's years and values are replaced with X in the version of the deck we hold; we do not estimate them. With the number hidden, the slide makes a claim about efficiency without the evidence for it.
What a founder can adapt: If you withhold the figure in a shared deck, say it will be provided in the data room and keep the definition visible.
Supporting analysis
What the deck claims: "Building a Winning Team: We've meticulously hired 10X engineers, propelling our growth and XXX€ ARR per head." Other bullets: lowest acquisition cost in the market; automation over manual operations and hiring. A chart, "Yearly Burn Rate (XXX - XXXX)", shows a curve rising from below to above a baseline with no axis values.
Presentation choice: Shows where revenue per employee fits in the argument: as evidence that automation-first hiring works.
When it does not fit: Don't rest a claim of efficiency on a placeholder.
Our reading of each slide against the four things to state. "Partly" means present but incomplete.
Slide
Revenue named
Headcount named
Date or period
Trend or plan
Carta p14
Yes (ARR)
Partly (employees; contractors unclear)
No
No
Thoughtful AI p1
Yes (ARR; value hidden)
Partly (employees)
Partly (year on year)
Partly (5x growth)
Week's Best p10
Partly (gross revenue, not stated as such)
Yes (FTE)
Yes (years 1–5)
Yes (forecast)
Cent Capital p12
Yes (ARR)
Yes (employees)
Partly (year 5)
Partly (start and end)
Defacto p17
Yes (ARR)
Partly ("per head")
No
No (hidden)
Key Takeaways
State the revenue figure: recognised revenue, ARR, or revenue after partner shares.
State the headcount: employees, full-time equivalents, contractors included or not.
Use average headcount for a period, or end-of-period headcount for a point in time, and say which.
Show the trend, and the hiring plan that will change it.
Label forecast ratios as forecasts.
If you print a ratio and a growth rate, check what they imply about the inputs you left out.
Build your revenue-per-employee line
Fill this in before you put the figure on a slide. If a line is blank, the figure is not ready.
Revenue figure. Current ARR, last-twelve-months recognised revenue, or revenue after partner shares.
Headcount. Employees only or full-time equivalents including contractors who work like staff.
Timing. Point in time (pair with current ARR) or average over the period (pair with period revenue).
Today's figure. Revenue ÷ headcount, with the date.
Earlier figure. The same calculation a year ago, on the same basis.
Planned figure. Revenue target ÷ planned headcount after the hires in your raise.
Implied checks. If you print growth rates, what do they imply about headcount? Would you explain it?
Copyable framework: [Revenue figure] per [headcount definition]: $[x] ([date]), up from $[y] ([date a year earlier]). Plan: $[z] at [planned headcount] people and $[target] [revenue figure] by [date].
Illustrative example 1 — written by us
Before: 450 employees · $50M in ARR
After: $50M ARR with 450 employees: about $111K ARR per employee ([date]; employees only), up from $[y] a year earlier.
What improved: Built from Carta's page 14 figures; the date and earlier figure are placeholders. Adds the ratio, its basis and a trend.
Illustrative example 2 — written by us
Before: Growing from 5 to 35 employees over 5 years while scaling to $9.2M ARR.
After: Today: $[x] ARR with 5 employees. Year 3: $[y] with [n]. Year 5: $9.2M ARR with 35 employees, about $263K per employee (forecast).
What improved: Uses Cent Capital's page 12 figures for year 5; earlier values are placeholders. Shows the path, not just the endpoints.
What the figure tells an investor, and what it doesn't
Revenue per employee is a rough efficiency measure: how much revenue the company brings in for each person it employs. A rising figure means revenue is growing faster than the team; a falling one means the team is growing faster than revenue, which is normal right after a round, when a company hires ahead of the revenue it expects.
It is not a profit measure. A company with high revenue per employee can still lose money if its other costs (hosting, materials, marketing, partner payouts) are large. It also varies widely by business model: a software company and a services company with the same team size will have very different figures. Comparisons are most useful against the company's own history or against companies with the same model.
This guide covers how to present the figure. The hiring plan guide covers which roles you will add with the money you raise and what they cost; the runway guide covers how long the raise lasts. Revenue per employee connects the two: it shows whether the planned team is in proportion to the planned revenue.
Four things to state with the figure
Our framework, used throughout this guide.
Revenue. Name the numerator. Recognised revenue over twelve months, current ARR and revenue after paying partners or producers give different results for the same company. A marketplace or revenue-share business should say whether the figure is before or after the partner's share.
Headcount. Name the denominator. Employees only, or including full-time contractors? People counted at the end of the period, or the average over it? A practitioner guide on the metric recommends dividing revenue for a period by average full-time-equivalent headcount over that period, converting part-time staff and contractors who work like staff into full-time equivalents, because end-of-period headcount exaggerates changes when hiring happens late in the period. If you use current ARR, a point-in-time figure, pair it with current headcount and say so.
Date or period. A ratio without a date cannot be compared with anything, including your own next update.
Trend and plan. One figure says little. Two or more points, or the current figure beside the planned figure after the hires you are raising for, show the direction and whether the plan keeps the team in proportion to revenue. (GrowPanel (subscription analytics vendor))
Worked example: one company, three answers
Hypothetical example, invented for illustration; the numbers are not from any deck. A software company has $2.4M of ARR today. It has 20 employees at the end of the year and 4 full-time contractors who work like staff. It started the year with 12 employees, so its average employee headcount over the year was about 16.
ARR per employee at year end: $2,400,000 ÷ 20 = $120,000. Including contractors: $2,400,000 ÷ 24 = $100,000. Recognised revenue for the year was $1.8M because ARR grew during the year; divided by the average of 16 employees, that is $1,800,000 ÷ 16 = $112,500.
All three are arithmetically correct, and they range from $100,000 to $120,000. The slide should pick one, say which, and keep it the same in every update. If the company plans to grow to 35 people and $5.6M ARR after the raise, the planned figure is $5,600,000 ÷ 35 = $160,000 per employee on the same basis: a claim that revenue will grow faster than the team, which the hiring plan and revenue forecast must support.
Gross or net: when partners take a share
If part of your revenue is passed to someone else (producers, drivers, sellers, publishers), revenue per employee on the gross figure overstates how much the company keeps. Week's Best's forecast shows the effect: in year 5, revenue of $31.4M per its table includes $12.6M paid to producers. Its revenue-per-FTE row uses the gross figure. On the amount kept after the producer share ($18.8M), the same team would bring in about 40% less per person. Neither is wrong, but the slide should say which it uses.
What a ratio and a growth rate reveal together
Revenue per employee is revenue divided by headcount, so if you print the ratio's growth and revenue growth over the same period, the reader can work out how headcount changed. Thoughtful AI prints ARR growth of 3x and ARR-per-employee growth of 5x. If both multiples are exact and cover the same period, headcount at the end would be 3 ÷ 5 = 0.6 times headcount at the start, about 40% fewer people, but only if the periods, revenue definitions and headcount bases match; the slide does not establish that, so this is an implication to explain, not a verified reduction. If the team did shrink there may be a reason (automation, a restructuring); either way an investor will ask.
Our recommendation: before you put any two related figures on a slide, check what they imply about the figures you left off.
Common mistakes
No definition. Revenue per employee without saying which revenue and which headcount cannot be compared with anything.
Mixing a point and a period. Current ARR divided by average headcount over last year, or annual revenue divided by today's team, mixes timings.
Gross revenue in a revenue-share model. If partners take a large share, the gross figure overstates what each person brings in for the company.
A single snapshot. One figure doesn't show whether the team is growing faster or slower than revenue.
Unexplained implications. Printing the ratio's growth beside revenue growth reveals headcount change; make sure you can explain it.
Lean claim without numbers. "Lean team" or "high ARR per head" without a figure is a claim, not evidence.
Diagnostic checklist
The revenue figure is named (ARR, recognised revenue, or after partner shares).
The headcount is defined (employees or FTE, contractors in or out).
Point-in-time figures are paired with point-in-time figures, and period with period.
The figure has a date.
An earlier figure on the same basis is shown.
The planned figure after your hires is shown and labelled as a forecast.
Any printed growth rates have been checked for what they imply about headcount.
Frequently asked questions
Should I use ARR or revenue?
For a subscription business, current ARR divided by current headcount is common and easy to update. If most of your revenue is not recurring, use recognised revenue over the last twelve months divided by average headcount over the same months. Say which. (GrowPanel (subscription analytics vendor))
Do contractors count?
Count contractors who work like staff on ongoing work, converted to full-time equivalents, and say so. Exclude one-off agencies. Whatever you choose, keep it the same between updates. (GrowPanel (subscription analytics vendor))
Our figure will fall after we raise. Is that a problem?
Not if you show it. Hiring ahead of revenue is normal after a round. Show today's figure, the dip during hiring, and the planned figure once the new team is productive, tied to your revenue forecast.
Is a high revenue per employee always good?
No. It says nothing about profit, and it can be high because a business passes most of its revenue to partners or relies on outsourced labour that isn't counted. Show it with gross margin and say what is included.
How we chose these examples
Discovery (2026-10-03): a bounded review of earlier rejections found "revenue per employee" rejected on 2026-10-01 without a recorded evidence reason. No published guide or draft teaches the metric (one draft and one live guide mention it in passing). The durable corpus index was searched for revenue or ARR per employee, head or FTE, and for slides that give team size beside revenue. Cogint p20 (listed company), Mito AI p17 (other companies' figures as market evidence) and customer-pricing "per employee per month" slides were set aside.
Five pages were rendered from the original deck files and read from the images: Carta 14, Thoughtful AI 1, Week's Best 10, Cent Capital 12 and Defacto 17. All five are new uploads at 1200px wide. All five companies have live teardown pages, none appears in our corpus exclusions, and no removal or deletion request names them. Figures were checked by recalculation where the slide allows it; hidden figures (Thoughtful AI's ARR, Defacto's ARR per head and chart values) and unlabelled chart bars are not estimated.
Company figures are not verified. The worked example is invented and labelled. Classifications and recommendations are our editorial reading, not financial advice. Drafted with AI assistance and checked by an editorial model against the slide images; not reviewed by a person.