Agtech Business Model Slide Examples: 7 Real Farming Pitch
How farming and agtech startups explain how they make money in a pitch deck: sensor sales, hardware leases, software per farm, markups.
Agtech Business Model Slide: Show What Farmers Pay, When, and What You Keep
Farmers have little cash before harvest, thin margins and good reasons to distrust new technology. So an agtech business model slide has to show more than a price. It should say what the farmer, buyer or partner pays, when they pay it, and how the startup earns money if farmers cannot pay much up front. The strongest slides in this guide give a price for each source of income. The weakest describe a model in a sentence and leave investors to guess the numbers, and one gives a sum that does not add up.
TL;DR
Give a price for each thing you sell, say who pays and when, and check every sum. Farmpadi sells a $200 sensor, with $100 paid before harvest and $100 in produce after, plus data subscriptions and a $10 soil test per plot. PolliTrace leases its camera for $15 a month and charges $10 a month per farm for software. Farm Bazaar charges retailers a fee and states its margins on vegetables and fruit. NutriPride shows a revenue sum, but its figures do not multiply to its $23m total. DirectDairy and Phospholutions describe their models without any figures.
Agtech business model slides from real pitch decks
Each example shows the exact stored slide above its analysis and links to the full teardown. Slides with prices come first; slides with few or no figures follow. Text is as shown on the slides; comments and arithmetic checks are ours.
Farmpadi business model slide — slide 7
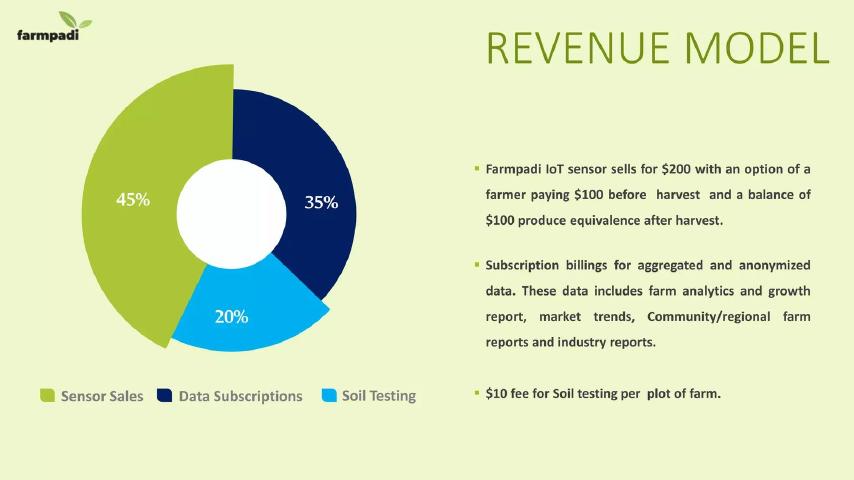
Farm sensor and data company. Slide titled "Revenue Model".
Farmpadi deck, slide 7. Exact stored slide matched to this analysis.
Our analysis: Each source of income has a price or a share, and payment terms fit the farming calendar.
Evidence and limitation: Company pricing and planned revenue mix.
What a founder can adapt: Give payment terms as well as prices, and show the revenue mix.
Supporting analysis
What the deck claims: "Farmpadi IoT sensor sells for $200 with an option of a farmer paying $100 before harvest and a balance of $100 produce equivalence after harvest." "Subscription billings for aggregated and anonymized data." "$10 fee for Soil testing per plot of farm." Pie chart: Sensor Sales 45%, Data Subscriptions 35%, Soil Testing 20%.
Presentation choice: The pay-after-harvest option shows the company understands farmers' cash flow.
When it does not fit: Leaving the data subscription unpriced, as this slide does.
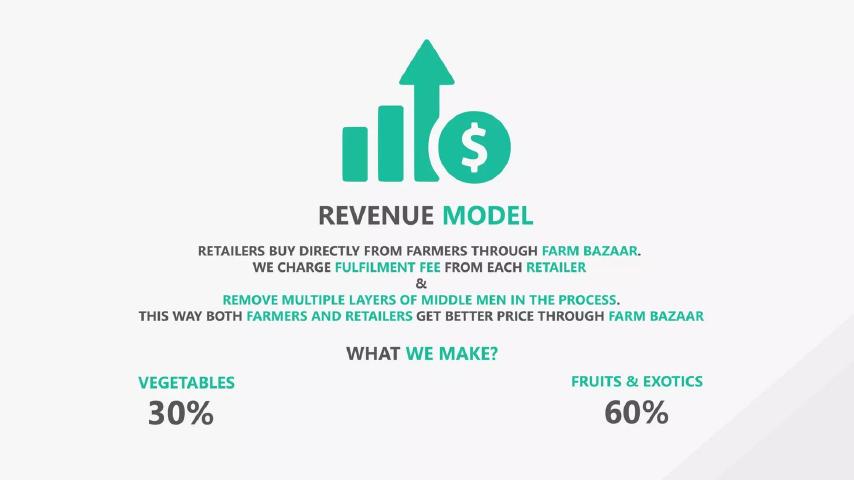
Marketplace connecting farmers and retailers. Slide titled "Revenue Model".
Farm Bazaar deck, slide 10. Exact stored slide matched to this analysis.
Our analysis: It names who pays and gives a margin for each product group.
Evidence and limitation: Company figures.
What a founder can adapt: Say whether the percentage is on the sale price or the cost.
Supporting analysis
What the deck claims: "Retailers buy directly from farmers through Farm Bazaar. We charge fulfilment fee from each retailer & remove multiple layers of middle men in the process." "What we make?" "Vegetables 30%", "Fruits & Exotics 60%".
Presentation choice: Separate margins for vegetables and fruit show where the money is made.
When it does not fit: Leaving the fulfilment fee itself unstated.
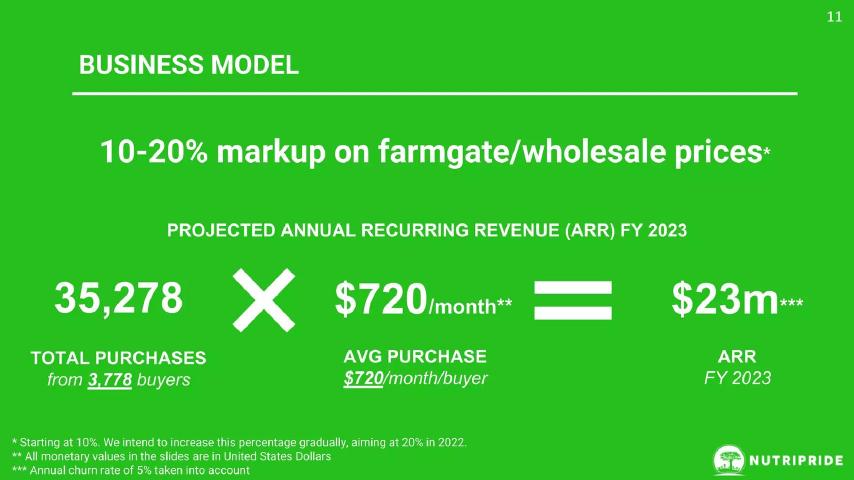
Farm produce trading company. Slide titled "Business Model".
NutriPride deck, slide 12. Exact stored slide matched to this analysis.
Our analysis: The layout is clear, but the sum does not reconcile: 35,278 × $720 is about $25.4 million, and 3,778 buyers × $720 × 12 months is about $32.6 million.
Evidence and limitation: Company projection.
What a founder can adapt: Use one unit throughout and make the multiplication match the total.
Supporting analysis
What the deck claims: "10-20% markup on farmgate/wholesale prices*". "Projected Annual Recurring Revenue (ARR) FY 2023": "35,278 Total Purchases from 3,778 buyers" × "$720/month Avg Purchase $720/month/buyer" = "$23m ARR FY 2023". Footnotes: "Starting at 10%. We intend to increase this percentage gradually, aiming at 20% in 2022." "Annual churn rate of 5% taken into account."
Presentation choice: Showing the sum invites investors to check it, which is good only when it adds up.
When it does not fit: Mixing purchases and buyers in the same sum.
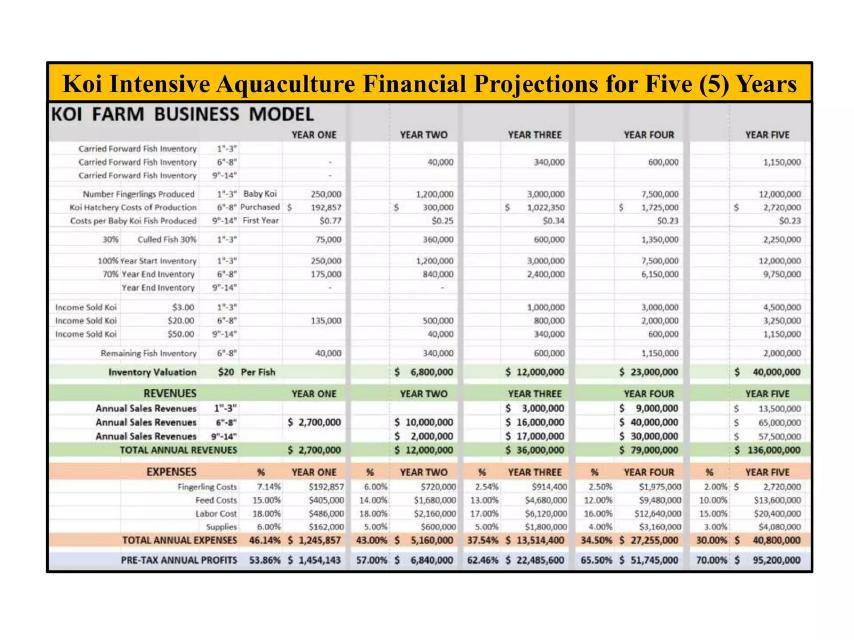
Koi fish farm. Slide titled "Koi Intensive Aquaculture Financial Projections for Five (5) Years" and "Koi Farm Business Model".
Koi Farm deck, slide 21. Exact stored slide matched to this analysis.
Our analysis: The sums check: 135,000 fish at $20 is $2.7 million, and year five's three revenue lines add to $136 million. The table does not say who buys the fish or whether that many buyers exist.
Evidence and limitation: Company projection.
What a founder can adapt: Add who buys the output and a short summary above the table.
Supporting analysis
What the deck claims: Prices by fish size: "$3.00", "$20.00", "$50.00". "Inventory Valuation $20 Per Fish". Year one revenue "$2,700,000"; year five "$136,000,000". Pre-tax profit from "53.86%" in year one to "70.00%" in year five.
Presentation choice: Prices, volumes and costs are all on the slide, so investors can test the model.
When it does not fit: A table this dense on a single slide.
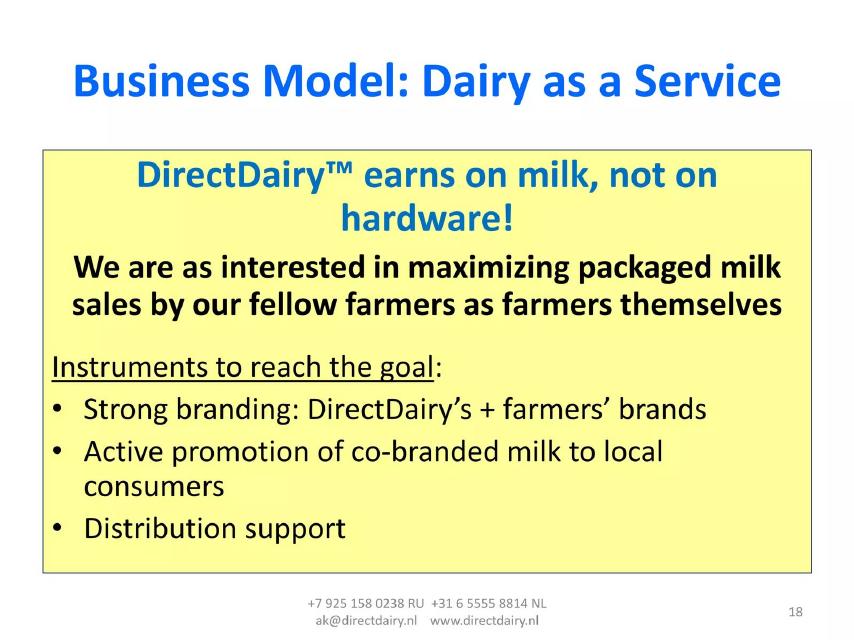
Small-scale dairy processing company. Slide titled "Business Model: Dairy as a Service".
DirectDairy deck, slide 18. Exact stored slide matched to this analysis.
Our analysis: It explains that the company's income depends on farmers' milk sales, but not how much it earns.
Evidence and limitation: Company description; no figures.
What a founder can adapt: Give the amount earned per litre and the volume per farm.
Supporting analysis
What the deck claims: "DirectDairy earns on milk, not on hardware!" "We are as interested in maximizing packaged milk sales by our fellow farmers as farmers themselves." "Instruments to reach the goal": strong branding, active promotion of co-branded milk, distribution support.
Presentation choice: Linking the startup's income to the farmer's success is a strong idea.
When it does not fit: A model slide with no numbers.
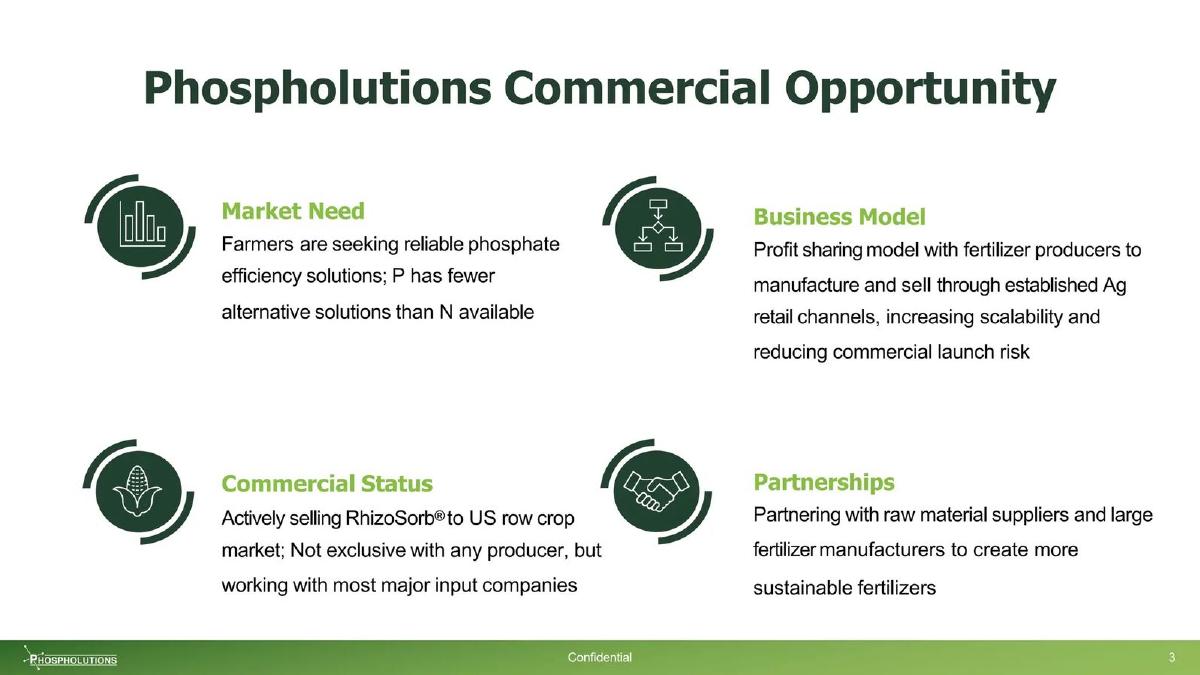
Phospholutions deck, slide 4. Exact stored slide matched to this analysis.
Our analysis: It explains the partnership and says sales have started, but gives no share or volume.
Evidence and limitation: Company description; no figures.
What a founder can adapt: Give the share of profit kept and current sales volume.
Supporting analysis
What the deck claims: "Business Model": "Profit sharing model with fertilizer producers to manufacture and sell through established Ag retail channels, increasing scalability and reducing commercial launch risk". "Commercial Status": "Actively selling RhizoSorb to US row crop market".
Presentation choice: Selling through existing fertiliser makers can reach farmers faster than building a sales team.
When it does not fit: Describing a partnership without its terms.
Whether each slide names a payer, gives a price and has sums that add up.
Example
Who pays
Price or share
Sums check
Farmpadi
Farmers
$200 sensor, $10 test
Mix adds to 100%
PolliTrace
Farms, brands
$15 and $10 a month
No sum shown
Farm Bazaar
Retailers
30% and 60% margins
No sum shown
NutriPride
Buyers
10–20% markup
Does not reconcile
Koi Farm
Not named
$3, $20, $50 per fish
Checks
DirectDairy
Not stated
Not given
No figures
Phospholutions
Partners
Not given
No figures
Key Takeaways
Price each source of income separately.
Say when farmers pay, not just how much.
Name who pays: farmers, retailers, brands or partners.
Make every sum on the slide add up.
Give a figure for profit-sharing or service models.
Build your agtech business model slide
Work out the numbers for one farm before you design the slide.
Payer. Who pays: farmers, buyers, brands or partners?
Price. What does each pay, per unit, per month or as a share?
Timing. When do farmers pay, and what terms do you offer?
Per farm. What is one farm worth to you over a year?
Copyable framework: Farms pay [price] for [product], [payment terms]. Buyers pay [fee]. One farm brings in [amount] a year.
Illustrative example 1 — written by us
Before: We earn through hardware, software and partnerships.
After: Farms lease each sensor for $12 a month and pay $8 a month for the app. Average farm: 3 sensors, $528 a year. Buyers pay a 2% fee on traceable produce.
What improved: Our illustrative rewrite; all figures are invented for the example. It gives prices, the per-farm total and a second payer.
What this guide adds
Live agtech guides cover market, problem and solution slides; the general business model guide covers revenue for any startup. This guide covers how farming startups show how they make money, where seasonal cash flow, low farmer budgets and long sales cycles shape the model more than in most industries.
How we read each slide
We read each stored slide image and quote the text on it. Where a slide shows figures that should add up, we redid the sum ourselves. We have not checked any company's prices, sales or revenue, and we make no claim that any slide affected a fundraising outcome.
The common agtech revenue models
Hardware sales: the startup sells sensors or machines, as Farmpadi does at $200 a sensor. The key numbers are the price, the cost to make it and how many each farm buys.
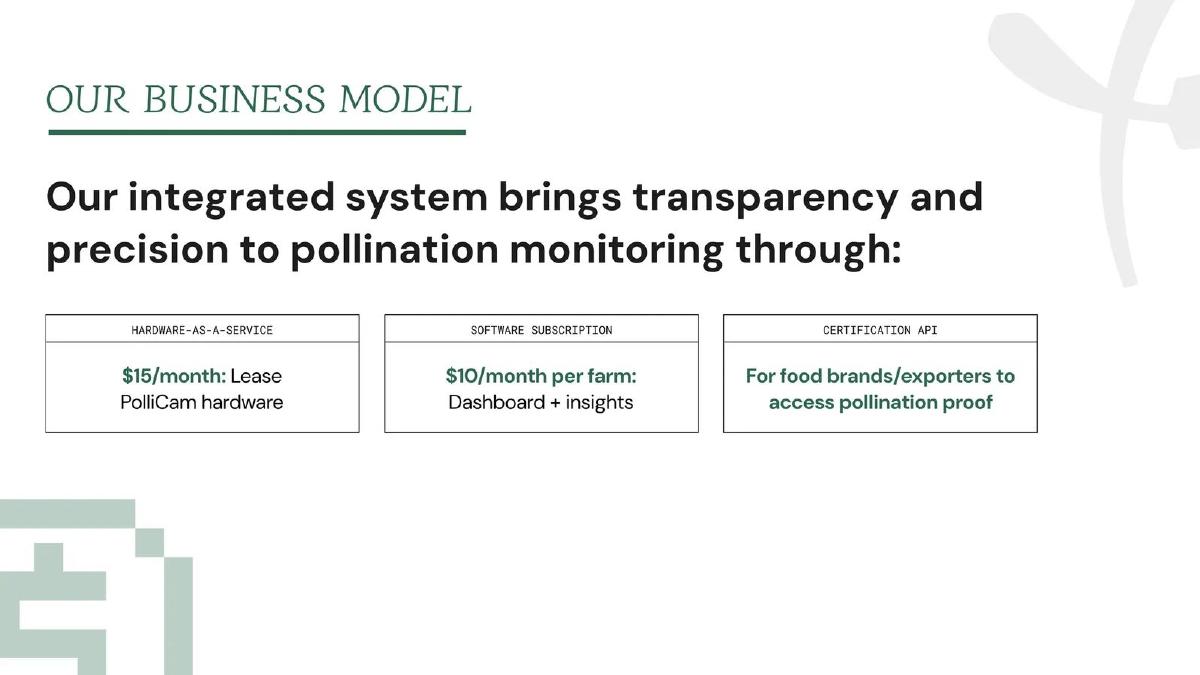
Hardware as a service: the farmer leases the equipment monthly, as PolliTrace does at $15 a month. The key numbers are the monthly fee, how long farmers keep it and the cost of the hardware.
Software and data: farms or other buyers pay a subscription, as with PolliTrace's $10 a month per farm or Farmpadi's data subscriptions. The key numbers are the price, the number of paying farms and how many renew.
Trading and marketplaces: the startup takes a markup or fee on produce, as NutriPride (10–20%) and Farm Bazaar (a fee from each retailer) do. The key numbers are the percentage, the value traded and the cost of handling it.
Partnerships and services: the startup earns from partners or from the farmer's output, as Phospholutions does through profit sharing with fertiliser makers or DirectDairy through milk sales. The key numbers are the share and the volume behind it.
What investors check on an agtech business model slide
When does the farmer pay? Many farmers can only pay after harvest. Farmpadi answers this directly: a farmer can pay $100 before harvest and the remaining $100 in produce afterwards. That makes the sensor easier to buy, but it means Farmpadi waits for part of its money and takes payment in crops it must sell.
Who else pays? Several slides name buyers beyond the farmer: PolliTrace offers a certification service to food brands and exporters, and Farm Bazaar charges retailers. A second paying group reduces how much the startup needs from farmers.
Do the sums add up? NutriPride's slide multiplies 35,278 purchases by $720 a month to reach $23m a year. 35,278 times $720 is about $25.4 million, and 3,778 buyers times $720 a month for 12 months is about $32.6 million. The footnote mentions a 5% annual churn rate, which does not explain either gap.
Is the model specific? "Profit sharing model with fertilizer producers" describes a partnership, not a figure. Investors will ask what share the startup keeps and on what volume.
Common mistakes on agtech business model slides
Sums that do not reconcile: a multiplication on the slide that gives a different total from the one shown, as on NutriPride's slide, makes investors question the other figures too.
Mixing units: NutriPride labels the first number "total purchases" and the second "$720/month/buyer", so it is unclear whether $720 is paid per purchase or per buyer each month.
A model with no numbers: DirectDairy's slide says it "earns on milk, not on hardware!" but gives no price, volume or share.
Projections without a buyer: Koi Farm's table projects fish sales for five years but does not say who buys the fish.
Choosing which numbers to show
Start with one farm. Show what the farm pays for hardware, software or services, when it pays, and what that is worth to you over a year. Add any income from buyers such as retailers or food brands, with its own figure.
If you sell several things, show the share each contributes, as Farmpadi does with its 45/35/20 split between sensor sales, data subscriptions and soil testing.
If you take a markup, show the percentage and the value of produce you expect to handle. If you share profit with a partner, show the share you keep.
Finally, redo every sum on the slide and make the labels match the figures. Agricultural investors are used to checking per-hectare and per-farm maths.
Working out what one farm is worth
Investors will turn your prices into a figure for what one farm brings in over time. For PolliTrace, a farm that leases one camera and pays for the dashboard would pay $25 a month, or $300 a year. That arithmetic is ours, not the slide's, and it assumes one camera per farm, which the slide does not say.
For Farmpadi, a farm that buys one sensor and tests two plots would pay $220 in its first year, part of it in produce, plus any data subscription. Farmpadi's pie chart suggests sensor sales make up 45% of revenue, so most income still depends on selling new sensors rather than on repeat payments.
For a markup business, multiply the value of produce traded per buyer by the percentage. NutriPride's 10% starting markup on $720 a month would be $72 a month per buyer, if $720 is the value of produce bought. The slide does not say which.
Put the per-farm figure on the slide if you can. It lets investors compare your plan with the cost of finding and serving each farm.
Adapting the slide to your type of agtech business
Hardware makers should show the price, the payment terms offered to farmers and any repeat income from software or consumables.
Software and data companies should show the price per farm or per hectare, the number of paying farms and how many renew each season.
Marketplaces should show the markup or fee, the value of produce traded and who pays: the farmer, the buyer or both.
Producers such as fish or dairy farms should show price per unit, volume, cost per unit and who buys the output.
Input and biology companies should show their share of each sale when they sell through partners, and the volume partners have committed to.
Whatever the type, mark which revenue is earned today and which is planned, and say which season or year each figure belongs to. Farming income moves with harvests and weather, so investors want to know whether a figure comes from one good season, an average year or a forecast, and whether any farms have already paid.
Common mistakes
Sums that do not add up. Redo every multiplication.
Mixed units. Use one unit throughout a sum.
No payment timing. Say when farmers pay.
Unpriced services. Give a price for each income source.
Partnership without terms. State the share you keep.
No buyer named. Say who buys the output.
Diagnostic checklist
Each payer named.
Price for each income source.
Farmer payment timing stated.
Revenue mix shown.
Sums checked.
Per-farm value given.
Frequently asked questions
How do agtech startups make money?
By selling hardware (Farmpadi), leasing it with software (PolliTrace), taking a markup or fee on produce (NutriPride, Farm Bazaar), producing and selling output (Koi Farm), or sharing profit with partners (Phospholutions).
What should an agtech business model slide include?
Who pays, the price for each income source, when farmers pay, and sums that add up.
How do I handle farmers who can only pay after harvest?
Offer and show payment terms, as Farmpadi does with $100 before harvest and $100 in produce after.
Should I show a revenue sum on the slide?
Yes, if it adds up. NutriPride's sum does not reconcile with its own figures, which invites doubt.
How we chose these examples
Corpus: published pitch deck teardowns on StartupFundraising.com. Founder-uploaded private decks are excluded.
Selection (2026-10-01): we searched extracted slide text across the full corpus for business model or revenue model slides that mention farming, agriculture, crops or growers. We shortlisted 7 slides not used in other guides and kept all 7.
Review: stored slide images were read on 2026-10-01 against company, deck and slide number, and sums on slides were redone (editorial model review). No person has yet completed an editorial review of this page. We did not verify any company's prices, sales or revenue.