How agtech startups present the problem in a pitch deck: move from feeding the world to one farmer's loss, name what goes wrong on the farm.
Agtech Problem Slide: Real Pitch Deck Examples
Eight problem slides from agtech startups, shown in full, compare whether each slide gets from global food worries down to a specific farmer, names what goes wrong on the farm, and gives a number for the loss.
TL;DR
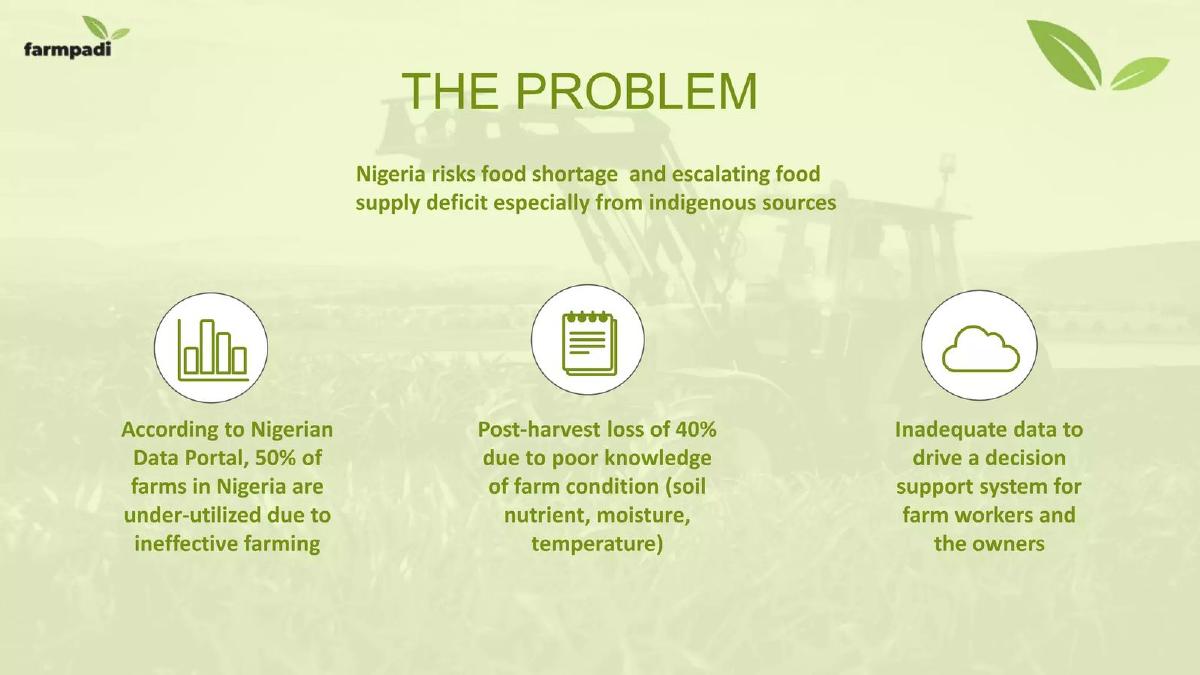
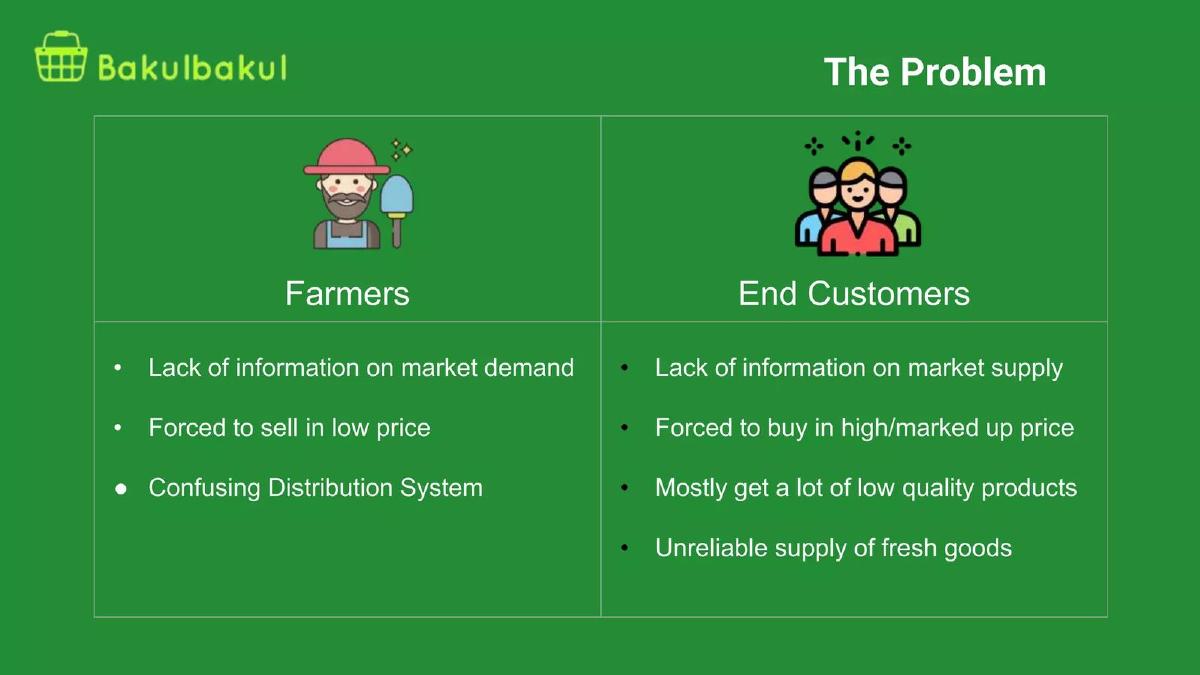
An agtech problem slide has to get from the global picture to one farmer's loss. Many start with population growth and climate change, which every investor has heard. The stronger slides name a farm-level failure and size it. Farmpadi does this in three points: "50% of farms in Nigeria are under-utilized due to ineffective farming", "Post-harvest loss of 40% due to poor knowledge of farm condition (soil nutrient, moisture, temperature)", and "Inadequate data to drive a decision support system". Bakulbakul splits the problem between farmers "Forced to sell in low price" and customers "Forced to buy in high/marked up price". Agreatculture's five dense columns, with no numbers, are the weaker pattern.
Agtech problem slides from real pitch decks
Each example shows the exact stored slide above its analysis and links to the full teardown. Claims are as shown on the slides; we have not verified them.
Farmpadi problem slide — slide 2
Farm data and decision support in Nigeria. A national headline and three icons with figures.
Farmpadi deck, slide 2. Exact stored slide matched to this analysis.
Our analysis: The strongest slide here: one country, a farm-level cause (not knowing soil conditions) and a loss figure a product could reduce.
Evidence and limitation: One sourced figure (Nigerian Data Portal), one unsourced (40%).
What a founder can adapt: Name the farm condition nobody measures, and what not measuring it costs.
Supporting analysis
What the deck claims: "The problem." "Nigeria risks food shortage and escalating food supply deficit especially from indigenous sources." "According to Nigerian Data Portal, 50% of farms in Nigeria are under-utilized due to ineffective farming." "Post-harvest loss of 40% due to poor knowledge of farm condition (soil nutrient, moisture, temperature)." "Inadequate data to drive a decision support system for farm workers and the owners."
Presentation choice: The 40% loss is tied to a cause the product can measure.
When it does not fit: Source the 40%, and drop the national headline if space is short.
Marketplace linking farmers with buyers. Two columns on green, farmers and end customers.
Bakulbakul deck, slide 2. Exact stored slide matched to this analysis.
Our analysis: The mirror-image columns show the marketplace gap clearly: the same missing information hurts both ends.
Evidence and limitation: No figures.
What a founder can adapt: For a farm marketplace, show what each side lacks and what it costs them.
Supporting analysis
What the deck claims: "The Problem." "Farmers": "Lack of information on market demand", "Forced to sell in low price", "Confusing Distribution System". "End Customers": "Lack of information on market supply", "Forced to buy in high/marked up price", "Mostly get a lot of low quality products", "Unreliable supply of fresh goods".
Presentation choice: Two sides, one cause, easy to read.
When it does not fit: Add the price gap: what the farmer gets versus what the customer pays.
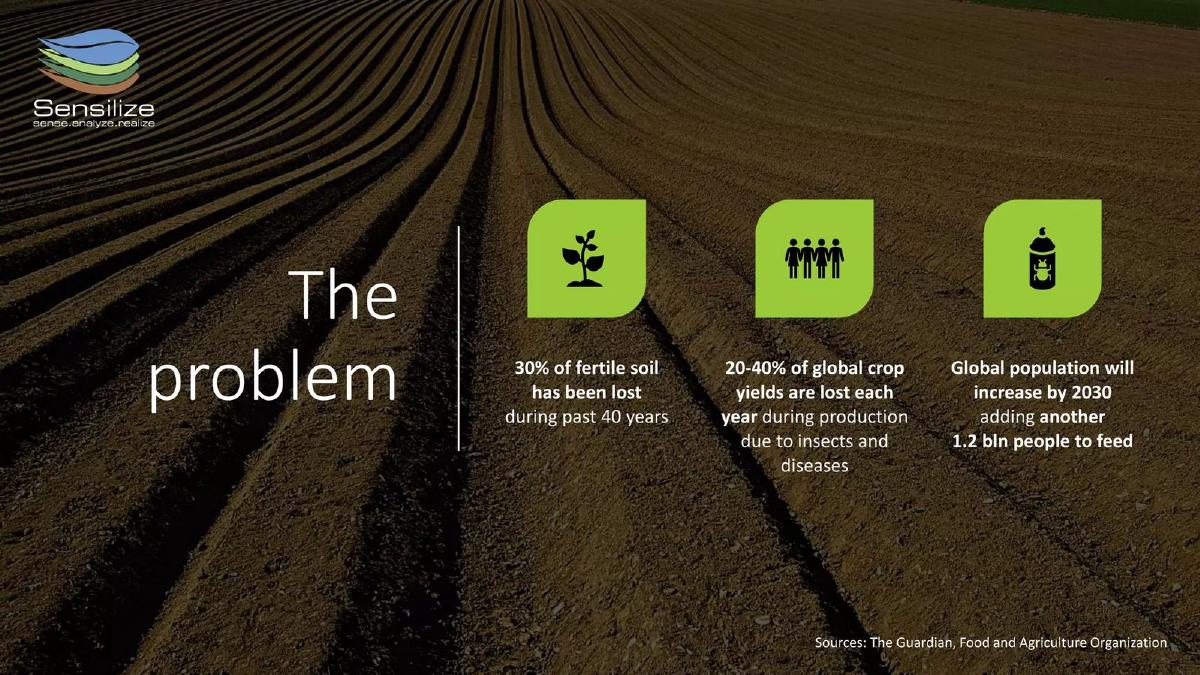
Crop monitoring. Three figures over a photo of a field, with sources.
Sensilize deck, slide 5. Exact stored slide matched to this analysis.
Our analysis: The middle figure, yield lost to insects and disease, is the one a monitoring product fixes; the other two are background.
Evidence and limitation: Three figures with named sources.
What a founder can adapt: Lead with the one figure your product changes.
Supporting analysis
What the deck claims: "The problem." "30% of fertile soil has been lost during past 40 years." "20-40% of global crop yields are lost each year during production due to insects and diseases." "Global population will increase by 2030 adding another 1.2 bln people to feed." "Sources: The Guardian, Food and Agriculture Organization."
Presentation choice: Sourced numbers in a clean layout.
When it does not fit: Population growth appears on almost every agtech slide; it adds little.
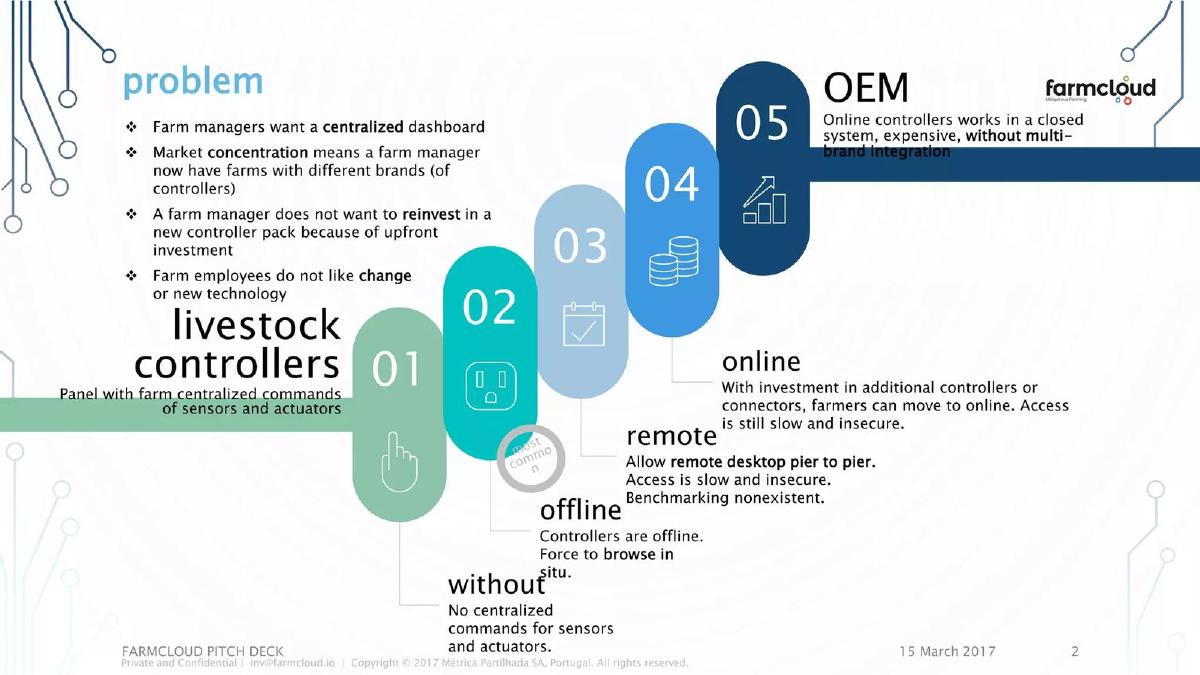
Software for livestock farm controllers. Four bullet points and a five-step staircase from "without" to "OEM".
Farmcloud deck, slide 2. Exact stored slide matched to this analysis.
Our analysis: A precise buyer (farm managers with several brands of controller) and a clear reason they won't replace them.
Evidence and limitation: No figures.
What a founder can adapt: Name the equipment your buyer already owns and why they won't replace it.
Supporting analysis
What the deck claims: "Farm managers want a centralized dashboard." "Market concentration means a farm manager now have farms with different brands (of controllers)." "A farm manager does not want to reinvest in a new controller pack because of upfront investment." "Farm employees do not like change or new technology." Steps: "without", "offline", "remote", "online", "OEM: Online controllers works in a closed system, expensive, without multi-brand integration."
Presentation choice: The staircase shows where each farm is today.
When it does not fit: The staircase text is tiny; add how many farms sit on each step.
Remote control for farm irrigation pumps. A main problem with causes, and a map of spin-off problems.
Intech Harness deck, slide 2. Exact stored slide matched to this analysis.
Our analysis: Very specific to the farmer's day: walking to the pump at night, pumps burning out on bad power.
Evidence and limitation: "1.6-2 times" water usage; energy share image.
What a founder can adapt: Describe one night or one day of your farmer's work that goes wrong.
Supporting analysis
What the deck claims: "Main Problem: Factors Affecting Pump Operations on Farm." "Erratic Power", "Water source running Dry". "Results in Inefficient Farming, Extra Vigilant Farmer, Extended Pump Operations, Erratic Water To the Crop, Soil Nutrients Washed Away." "Spin Off Problems": "Manual Operations", "Wildlife Challenges at Night", "Pump Burn Out", "Long Farm to House Distance", "No Data Capture / Gut based Irrigation". "Water Usage 1.6-2 Times."
Presentation choice: Details like "Wildlife Challenges at Night" show the founders know the user.
When it does not fit: Twelve boxes; pick pump burn-out or water use and give its cost.
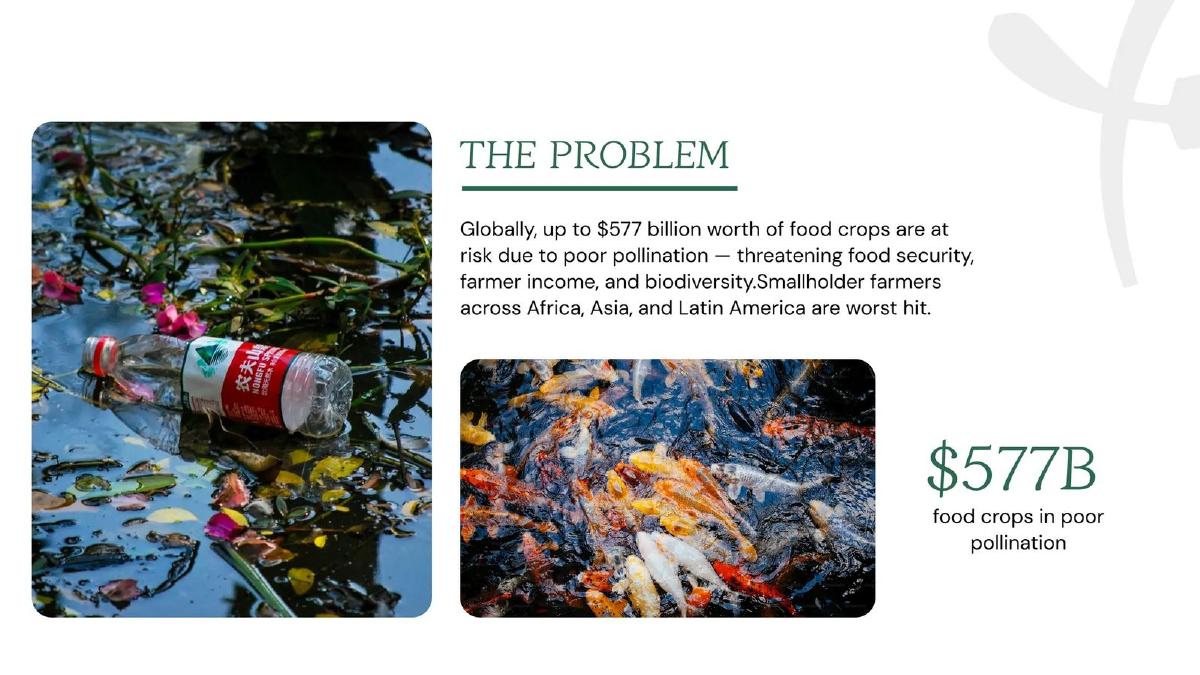
AI pollination monitoring. One sentence, two photos and a large figure.
Pollitrace deck, slide 2. Exact stored slide matched to this analysis.
Our analysis: It names an under-discussed cause and the farmers hit hardest, in one sentence.
Evidence and limitation: One figure, no source on the slide.
What a founder can adapt: Follow the global number with what poor pollination costs one farmer.
Supporting analysis
What the deck claims: "The problem." "Globally, up to $577 billion worth of food crops are at risk due to poor pollination — threatening food security, farmer income, and biodiversity. Smallholder farmers across Africa, Asia, and Latin America are worst hit." "$577B food crops in poor pollination."
Presentation choice: A single large number is easy to remember.
When it does not fit: "Up to" $577B is the value at risk, not the loss; say which. The photos don't show pollination.
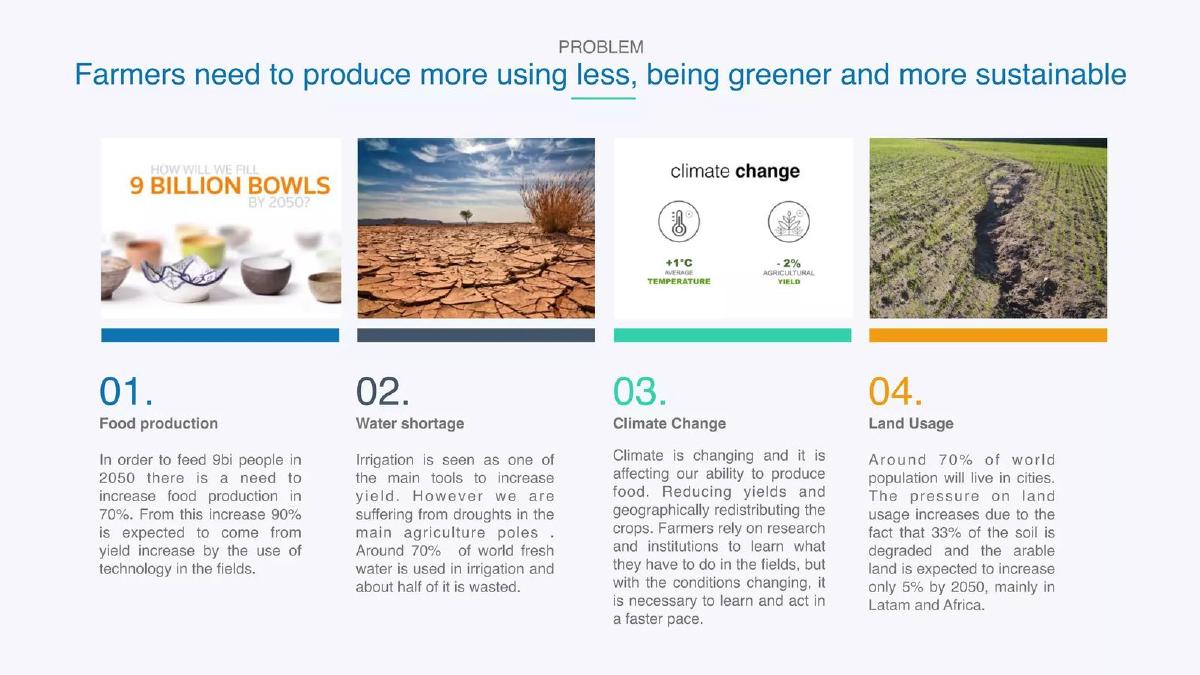
Farm technology. Four photo columns: food production, water shortage, climate change, land usage. Partial.
Hacker Unit deck, slide 2. Exact stored slide matched to this analysis.
Our analysis: The water point (half of irrigation water wasted) is a real farm problem, but it sits among three global trends.
Evidence and limitation: Several figures, no sources.
What a founder can adapt: Lead with the wasted irrigation water and what it costs a farm.
Supporting analysis
What the deck claims: "Farmers need to produce more using less, being greener and more sustainable." "In order to feed 9bi people in 2050 there is a need to increase food production in 70%." "Around 70% of world fresh water is used in irrigation and about half of it is wasted." "Farmers rely on research institutions to learn what they have to do in the fields." "33% of the soil is degraded."
Presentation choice: It shows how global framing hides the one point that matters.
When it does not fit: Food production, climate and land use belong in a short "why now" line, if anywhere.
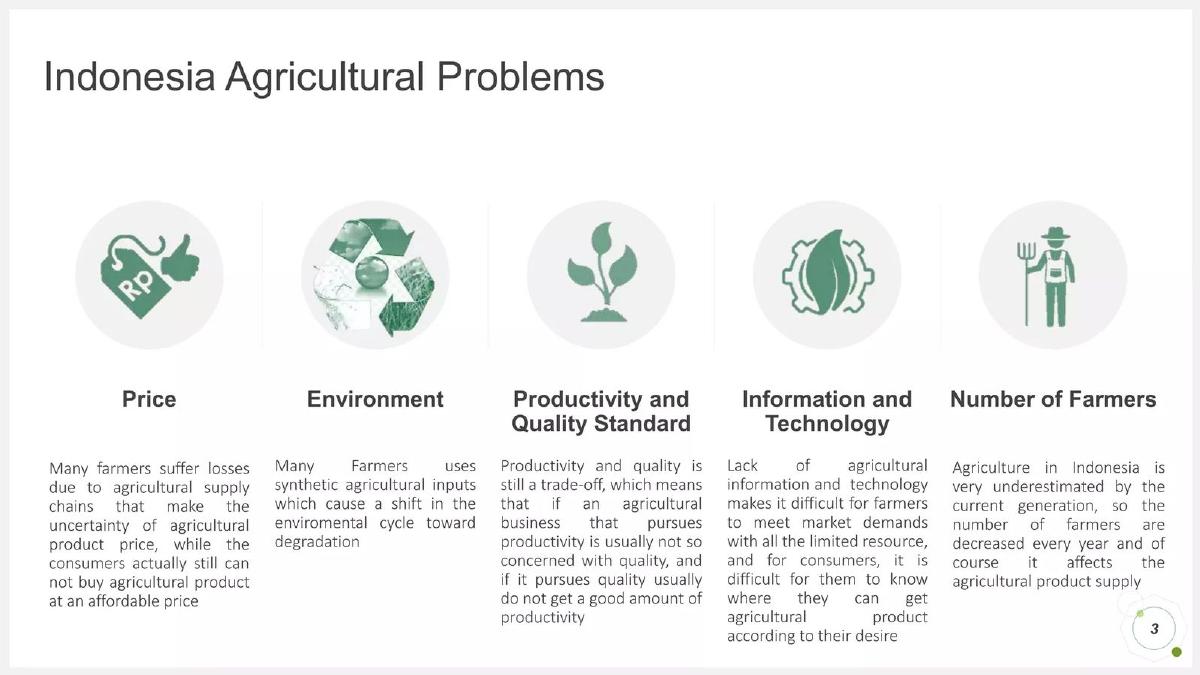
Farming platform in Indonesia. Five icons, each over a paragraph of small text. Weak on purpose.
Agreatculture deck, slide 3. Exact stored slide matched to this analysis.
Our analysis: Five separate problems, none sized, in text too small to read from a screen.
Evidence and limitation: No figures.
What a founder can adapt: Keep the price point, the one a platform can fix, and size the loss.
Supporting analysis
What the deck claims: "Indonesia Agricultural Problems." "Price": "Many farmers suffer losses due to agricultural supply chains that make the uncertainty of agricultural product price..." "Environment", "Productivity and Quality Standard", "Information and Technology", "Number of Farmers": "Agriculture in Indonesia is very underestimated by the current generation, so the number of farmers are decreased every year."
Presentation choice: It shows what the stronger slides avoid: listing every problem in a sector.
When it does not fit: Drop the other four columns or move them to an appendix.
Whether each slide names who loses, what goes wrong on the farm, and a number.
Example
Who loses
What goes wrong on the farm
Number
Farmpadi
Farm workers and owners
Yes (post-harvest loss)
Yes (50% sourced, 40%)
Bakulbakul
Farmers and buyers
Yes (selling blind)
No
Sensilize
Growers (implied)
Yes (insects and disease)
Yes (sourced)
Farmcloud
Farm managers
Yes (mixed controllers)
No
Intech Harness
Farmers
Yes (pumps, power)
Partly (water use)
Pollitrace
Smallholder farmers
Yes (poor pollination)
Yes ($577B at risk, unsourced)
Hacker Unit
Farmers
Partly (wasted water)
Global figures, unsourced
Agreatculture
Farmers
Partly (price swings)
No
Key Takeaways
Start on the farm, not with "9 billion people by 2050"; every agtech deck uses that line.
Name the failure a farmer sees: crops lost after harvest, pumps burning out, controllers that don't talk to each other.
Size it in farm terms: share of harvest lost, yield lost, value at risk ("40%", "20-40%", "$577B").
Say who pays: the farmer, the farm manager, or the buyer at the other end.
Five problems in small text is a list, not a problem; pick the one your product fixes.
Build your agtech problem slide
One farmer, one failure, one number.
Farmer. Which farmer: crop, size of farm, country?
Failure. What goes wrong on the farm, and when in the season?
Loss. Share of harvest, yield, water or money lost, with a source.
Today. What do they do about it now, and why doesn't it work?
Copyable framework: [Which farmers] lose [share/amount] of [harvest/water/income] because [failure]. Today they [current practice], which [why it fails]. (Source: [source].)
Illustrative example 1 — written by us
Before: The world needs to produce 70% more food by 2050 while agriculture faces climate change.
After: Smallholder tomato growers in Kenya lose 35% of each harvest between picking and market because they have no cold storage; a 2-acre farm loses about $900 a season. (Source: our survey of 120 growers.)
What improved: Our illustrative rewrite; the figures are invented for the example. It names the farmer, the failure and a measured loss.
What this guide adds
The food and climate problem guides include some farm decks, but mostly look at food brands and emissions. This guide looks only at startups selling to or for farmers, where the investor's question is whether a farmer will pay to fix this.
The slides range from a single farm device (Intech Harness pump controllers, Farmcloud livestock controllers) to marketplaces linking farmers and buyers (Bakulbakul) and data services (Farmpadi, Sensilize, Pollitrace).
Three things an agtech problem slide proves
Who loses: "Farmers" and "End Customers" (Bakulbakul), "Farm managers" (Farmcloud), "Smallholder farmers across Africa, Asia, and Latin America" (Pollitrace).
What goes wrong on the farm: post-harvest loss (Farmpadi), pests and disease (Sensilize), erratic power burning out pumps (Intech Harness), controllers from different brands (Farmcloud).
How much: "Post-harvest loss of 40%" (Farmpadi), "20-40% of global crop yields are lost each year" (Sensilize, sourced), "$577 billion worth of food crops" (Pollitrace).
Common mistakes
Opening with world population. Every agtech deck does it; start on the farm.
Listing every problem in farming. Pick the one your product fixes.
Value at risk as loss. "Up to $577B at risk" is not what farmers lose; say which you mean.
No farmer named. Crop, farm size and country change the whole business.
Small paragraphs. Farm slides often carry too much text; one line per point.
Diagnostic checklist
It names a specific farmer or farm manager.
It shows what goes wrong on the farm.
It gives one farm-level number, with a source.
Global population and climate are a line at most.
The product is on the next slide.
Frequently asked questions
How we chose these examples
Corpus: published pitch deck teardowns on StartupFundraising.com. Founder-uploaded private decks are excluded.
Selection (2026-09-25): we searched slides 2–5 for slides mentioning farmers, farms, agriculture, crops, livestock or growers together with a problem. Nine stored images were inspected. Decks already in the food or climate guides (for example Aviwell, Fundnesia, DDH and the hydroponic greenhouse deck) were excluded. Trym (cannabis growers) was left out to keep the page on food and farm agriculture; climate-fund and unrelated decks that only mention farming were skipped. Hacker Unit is marked partial; Agreatculture is kept as a weaker contrast.
Overlap check: none of these eight slides appears in another guide.
Review: all eight stored slide images were inspected on 2026-09-25 and matched to company, deck and slide number (editorial model review). No person has yet completed an editorial review of this page.
Claims are as shown on the slides; we have not verified them. We make no claim that any slide caused a fundraising outcome.