Sensilize is an Israeli ag-tech company founded in 2013 that specializes in remote sensing devices and machine learning for phenotyping. The deck highlights the company's participation in the Phenomics consortium, which operates with a $20 million budget alongside partners like Evogene and Elbit. Sensilize positions itself as a 'complete solution' to gather and analyze field data in real-time. The business model relies on a $30 per hectare pricing strategy, with a heavy focus on the Eastern European market. Financial projections show an aggressive revenue ramp-up across Ukraine, Russia, and B…
Key takeaways
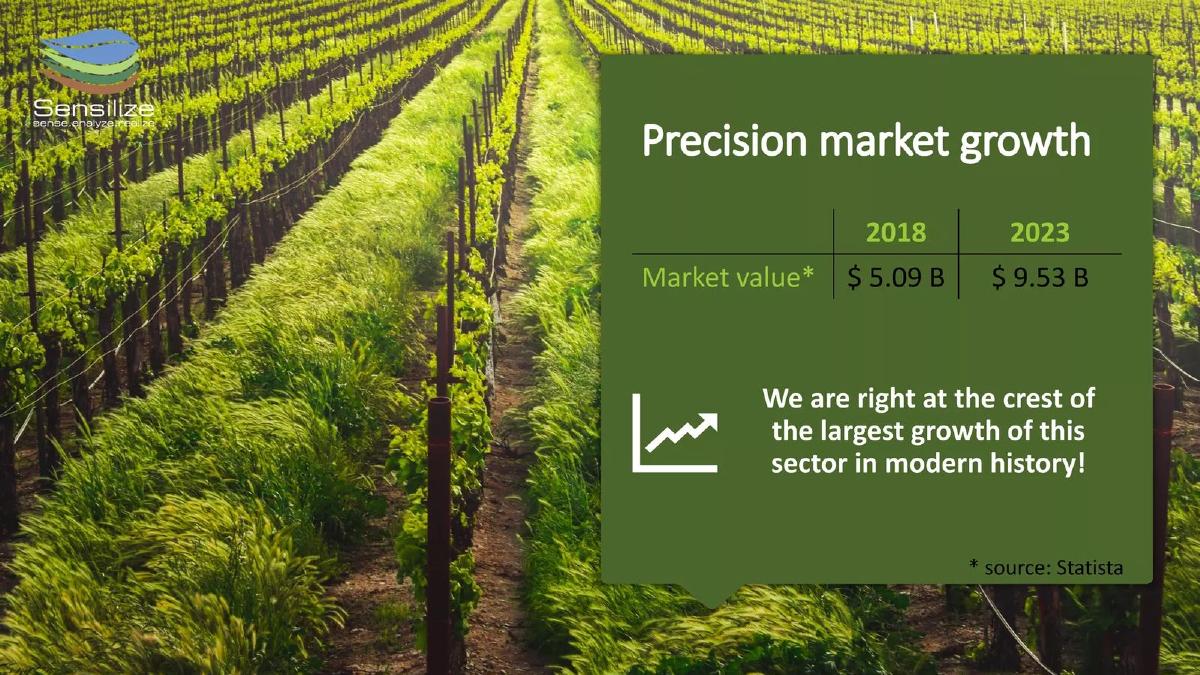
- The precision agriculture market is projected to grow from $5.09 billion in 2018 to $9.53 billion by 2023 (Slide 2).
- Sensilize was founded in 2013 by Israeli scientists and is a member of the Phenomics consortium (Slide 4).
- The company utilizes a $20 million budget within its consortium to develop deep learning and machine learning algorithms for phenotyping (Slide 4).
- The 'Sensilize Ecosystem' consists of three pillars: Sense, Analyze, and Realize, utilizing satellites, drones, and ground sensors (Slide 5).
- Data analysis includes image stitching, processing, and AI-driven insect and disease detection (Slide 6).
- A detailed 89-day 'Scenario' slide tracks plant health from sowing to maturity, including four specific drone flight milestones (Slide 7).
- The company targets a $75 million market in Ukraine, serving 12,567K hectares at a rate of $30 per hectare (Slide 8).
- Revenue projections for 2023 show a target of over $13 million across Ukraine, Russia, and Belarus (Slide 9).
Sensilize: Bridging Israeli Ag-Science and Global Field Data
Sensilize enters the precision agriculture space with a strong emphasis on its scientific pedigree. The deck positions the company not just as a software provider, but as a deeply integrated hardware and AI solution born out of the Israeli innovation ecosystem. By focusing on the 'Sense, Analyze, Realize' loop, the company attempts to solve the fragmentation often found in ag-tech where data is collected but rarely turned into actionable field decisions.
Slide 1: Title Slide
The title slide features a wide-angle shot of a wheat field being harvested, establishing the sector immediately. The company name 'Sensilize' is accompanied by the tagline 'Superior technology with a personal touch.' The logo includes the sub-text 'sense.analyze.realize,' which serves as the functional framework for the rest of the presentation.
Slide 2: Precision Market Growth
This slide serves as the 'Why Now' component of the deck. Citing Statista, it shows the precision market value growing from $5.09 B in 2018 to $9.53 B in 2023 . The slide uses a bold claim: 'We are right at the crest of the largest growth of this sector in modern history!' This is a standard macro-trend slide designed to validate the size of the opportunity for investors.
Slide 3: Sensilize is the Answer
Slide 3 introduces the company's value proposition through three pillars. First, it highlights the team composition: 'Founded and managing by both farmers, agriculture scientists and tech professionals.' Second, it promises a 'Complete solution to gather, analyze and implement the data in real time.' Third, it leverages geographic authority, claiming 'Best expertise from leading Israel AG sciences incubator.' This slide attempts to establish credibility by blending practical farming experience with high-level research.
Slide 4: The Phenomics Consortium
This is a crucial validation slide. It states as a 'FACT' that 'Israel AG science is #1 in the world.' It notes the company was founded in 2013 and is a member of the Phenomics consortium . The slide lists several partners, including Evogene, Hazera, and Elbit, and mentions scientific support from three Israeli universities. Most importantly, it notes a $20m budget for the consortium to develop deep and machine learning algorithms for phenotyping, and specifies that 'Each member of consortium will own the algorithms developed.'
Slide 5: The Sensilize Ecosystem
This slide provides a visual representation of the product in action. A 3D diagram shows a field being monitored by a satellite, a drone, and ground-based sensors. The data flows into a central hub, categorized by the three-step process: SENSE (data collection), ANALYZE (data processing), and REALIZE (actionable insights). This helps the investor visualize the 'full-stack' nature of the technology.
Slide 6: Data Analysis Deep Dive
Slide 6 focuses on the 'Analyze' portion of the workflow. It breaks the processing down into three components: Image stitching and processing , Opinion from agronomy, plant pathology and physiology experts , and Insects and disease detection AI . This suggests a hybrid approach where AI does the heavy lifting, but human expertise is still integrated into the final output.
Slide 7: Plant Health Monitoring Scenario
This is the most technical slide in the deck. It displays a 'Scenario' timeline for a crop cycle from 0 to 89 days. It identifies four specific 'Flights':
Flight №1: Weed detection (Day 7) · Flight №2: Nutrient deficiency detection (Day 21) · Flight №3: Pest detection (Day 55) · Flight №4: Maturity estimation (Day 89)
The slide also maps out variable fertilization and herbicide applications, demonstrating a granular understanding of the farming calendar.
Slide 8: Market Opportunity in Ukraine
The deck shifts from technology to economics here. It identifies a $5B+ precision agriculture market globally, but zooms in on Ukraine. Key figures include:
$75 MLN market just in Ukraine. · 12567K hectares served market in Ukraine. · Target – 2516K hectares of farmers who use new technologies. · $30 per hectare pricing model.
This slide is effective because it moves from a vague 'billions' figure to a specific, calculated unit price and target acreage.
Slide 9: Revenue Breakdown by Country
The final slide provided is a bar chart showing projected revenue from 2019 to 2023 , denominated in $'000s . The revenue is split between three countries: Ukraine (light green), Russia (medium green), and Belarus (dark green). The growth is aggressive:
2019: ~$800k total · 2021: ~$3.8M total · 2023: Over $13M total ($6,778k from Ukraine, $5,152k from Russia, and $1,472k from Belarus).
What Works in the Sensilize Deck
The deck excels at demonstrating technical depth . Slide 7, the 'Scenario' slide, is a standout because it moves beyond marketing buzzwords to show exactly how the product integrates into a farmer's existing workflow over a three-month period. It answers the 'how it works' question with significant detail.
The consortium validation on Slide 4 is also a strong move. For an early-stage or mid-stage startup, showing that you are playing in a $20 million sandbox with established industry giants like Elbit and Evogene provides a level of institutional credibility that is hard to fake. It suggests that the underlying IP is robust and backed by significant R&D investment.
What is Missing from the Sensilize Deck
The most glaring omission in the provided slides is the Team Slide . While Slide 3 mentions that the company is managed by scientists and farmers, there are no names, faces, or specific track records provided. In venture capital, the 'who' is often as important as the 'what,' especially in a field as specialized as ag-tech.
There is also a lack of Current Traction . The revenue slide (Slide 9) starts in 2019, but it is unclear if the 2019 and 2020 figures are actuals or projections. Without a clear distinction between historical performance and future estimates, the 'hockey stick' growth curve carries less weight. Furthermore, there is no mention of specific pilot programs, case studies, or named customers who have successfully used the $30/hectare service.
Finally, the Capital Ask is missing. A pitch deck is a tool to facilitate a transaction. Without knowing how much money the company is seeking or what milestones that money will buy (e.g., 'We need $5M to expand into the Russian market'), the deck feels more like a corporate brochure than a fundraising document.
Founder's Guide: What to Copy
Founders in complex technical fields should emulate the Workflow Scenario (Slide 7). Many decks stay too high-level, leaving investors wondering how the product actually touches the customer. By mapping the product to a specific timeline (the 90-day crop cycle), Sensilize makes the value proposition tangible.
The Unit Economic Market Sizing (Slide 8) is another best practice. Rather than just saying 'the market is big,' the founders calculated their TAM/SAM based on a specific price point ($30/hectare) and a specific addressable segment (farmers already using tech). This shows a level of commercial maturity that investors appreciate.
Lastly, the Ecosystem Visualization (Slide 5) is a great way to explain a multi-platform product. If your startup uses a combination of hardware, software, and third-party data, a single 'ecosystem' diagram is much more effective than three separate slides explaining each component in isolation.
Frequently asked questions
- What is the core technology behind Sensilize?
- Sensilize focuses on advanced remote sensing devices and machine learning algorithms. According to Slide 4, they are part of a $20 million Phenomics consortium developing deep learning for phenotyping. Their 'ecosystem' (Slide 5) integrates data from satellites, drones, and ground-based sensors to provide a real-time data analysis platform for farmers and agronomists.
- How does Sensilize generate revenue?
- The deck specifies a unit economic model based on land area. Slide 8 lists a price point of '$30 per hectare.' The company applies this to large-scale agricultural markets in Eastern Europe, specifically targeting a subset of farmers who already use new technologies, estimated at 2,516K hectares in Ukraine alone.
- Which geographic markets is the company targeting?
- While the company is based on Israeli ag-science (Slide 4), its commercial focus is heavily weighted toward Eastern Europe. Slide 9 provides a revenue breakdown for three specific countries: Ukraine, Russia, and Belarus, with Ukraine projected to be the largest revenue contributor by 2023.
- What does the 'Scenario' slide represent in the deck?
- Slide 7 provides a chronological workflow of the Sensilize 'Plant Health Monitoring and Protection Program.' It maps out a 90-day crop cycle, identifying specific intervention points such as weed detection (Day 7), nutrient deficiency detection (Day 21), and pest detection (Day 55), showing exactly when their technology provides value.
- Is there a specific funding request in this deck?
- No. The provided slides do not include a 'Use of Funds' or 'The Ask' slide. While the deck outlines market opportunity and revenue projections through 2023 (Slide 9), it omits the specific amount of capital being raised and how that capital would be allocated to achieve the stated goals.