Coinalytics utilized a highly minimalist 11-slide deck to secure $1.3 million in seed funding in 2017. The presentation relies heavily on the 'X for Y' analogy, specifically branding itself as the 'Bloomberg for Bitcoin' on slide 1. The deck is notable for its lack of traditional fundraising elements: there are no financial projections, no specific 'ask' or use of funds, and no detailed competitive landscape. Instead, it focuses on the rapid growth of the Bitcoin ecosystem (citing 8x market growth on slide 3) and the technical pedigree of its team, which includes former employees from Google…
Key takeaways
- The deck leads with a strong 'X for Y' analogy, positioning the company as 'Bloomberg for Bitcoin' on slide 1.
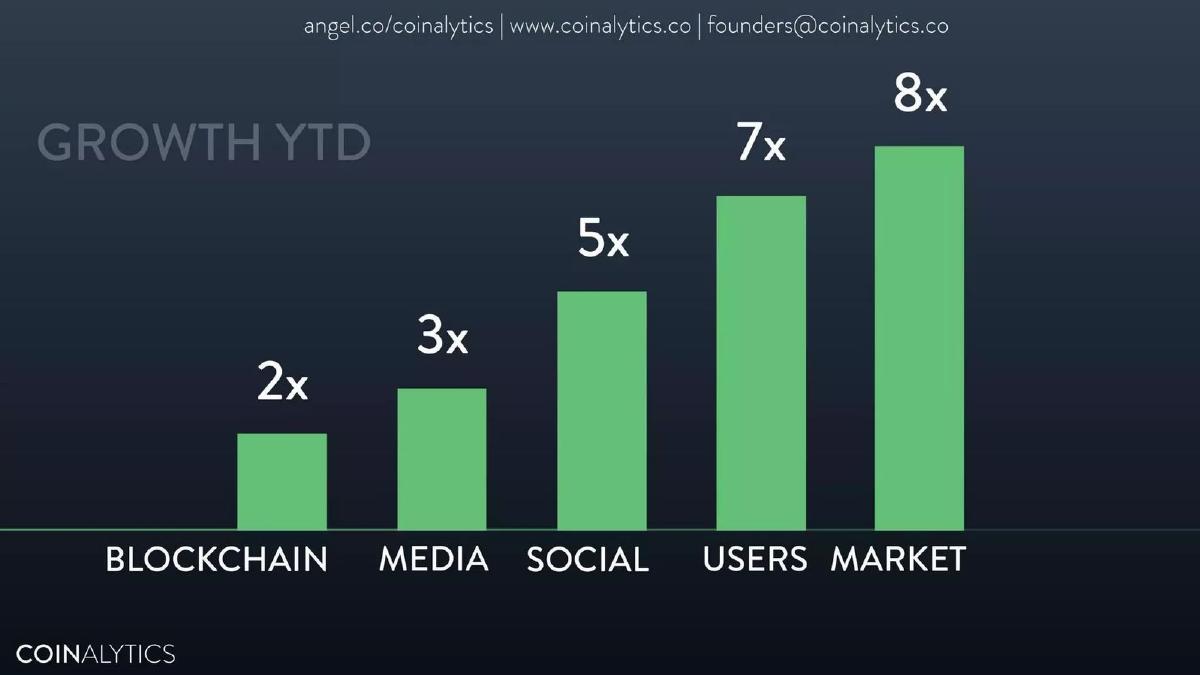
- Market growth is presented through relative multipliers rather than absolute dollar values, showing 8x growth in the 'Market' category on slide 3.
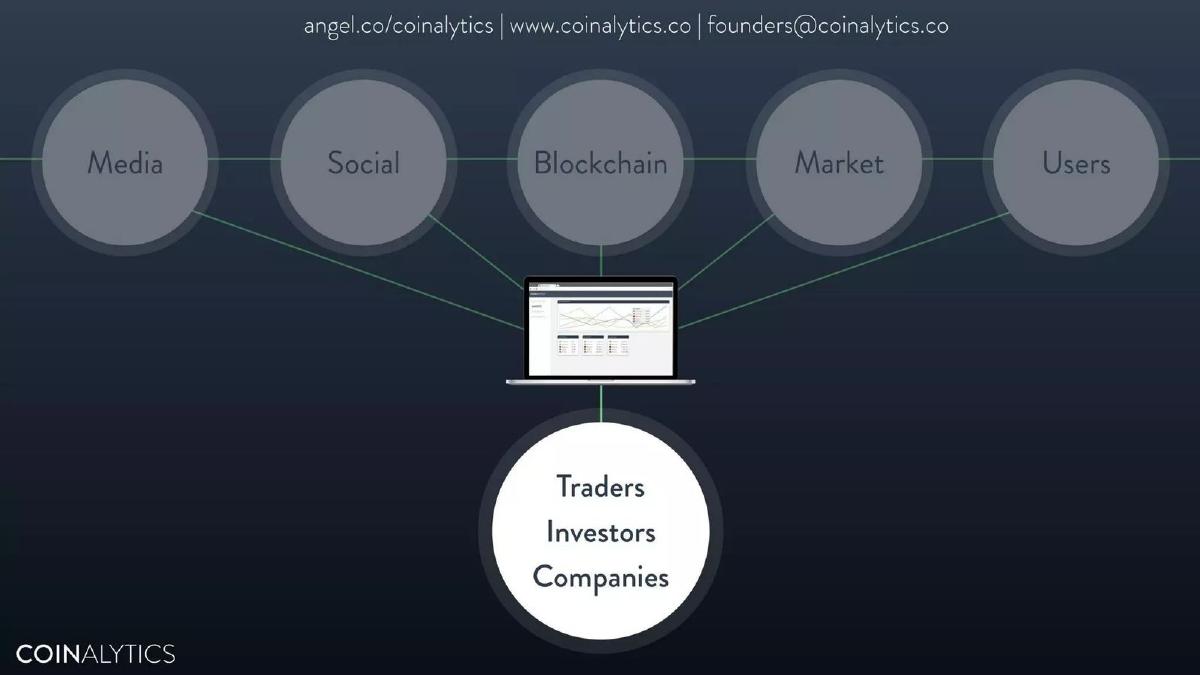
- The product is framed as a bridge between five data silos: Media, Social, Blockchain, Market, and Users, as shown on slide 5.
- The value proposition is distilled into three simple outcomes: Gain Edge (slide 6), Reduce Risk (slide 7), and Competitive Advantage (slide 8).
- The team slide emphasizes big-tech pedigree, highlighting experience at Google and Amazon Web Services on slide 9.
- There is a complete absence of unit economics, revenue models, or financial forecasts in the 11-slide deck.
- No specific funding amount or 'ask' is mentioned on any of the slides.
- The deck relies on high-fidelity dashboard mockups to demonstrate product readiness without explaining the underlying technology.
The Bloomberg for Bitcoin: A 2017 Seed Perspective
Coinalytics raised a $1.3 million seed round in 2017 using a deck that is almost aggressively minimalist. At only 11 slides, the presentation avoids the dense text and complex financial modeling often found in modern SaaS decks. Instead, it leans into the 'Gold Rush' sentiment of the early blockchain era, positioning itself as the essential toolset for those navigating the space. The deck relies on visual storytelling and high-level associations to build credibility.
Slide 1: The Hook
The cover slide establishes the company's identity through a classic pitch deck trope: the 'X for Y' analogy. By stating 'BLOOMBERG FOR BITCOIN' on slide 1, Coinalytics immediately communicates its target audience (professionals), its product category (data terminal), and its value (high-cost, high-utility intelligence). The contact information at the top includes an AngelList link, indicating a heavy reliance on the platform for this specific fundraise.
Slides 2-3: The Macro Opportunity
Slide 2 simply states 'BITCOIN: THE NEXT BIG THING.' This is a classic 'Why Now' slide that doesn't use data, but rather appeals to the investor's fear of missing out. Slide 3 follows up with 'GROWTH YTD,' using a bar chart to show relative growth. It lists 2x growth for Blockchain, 3x for Media, 5x for Social, 7x for Users, and 8x for Market. Notably, there are no absolute numbers or dates provided for this 'Year to Date' period, nor are the sources for these multipliers cited.
Slides 4-5: The Information Problem
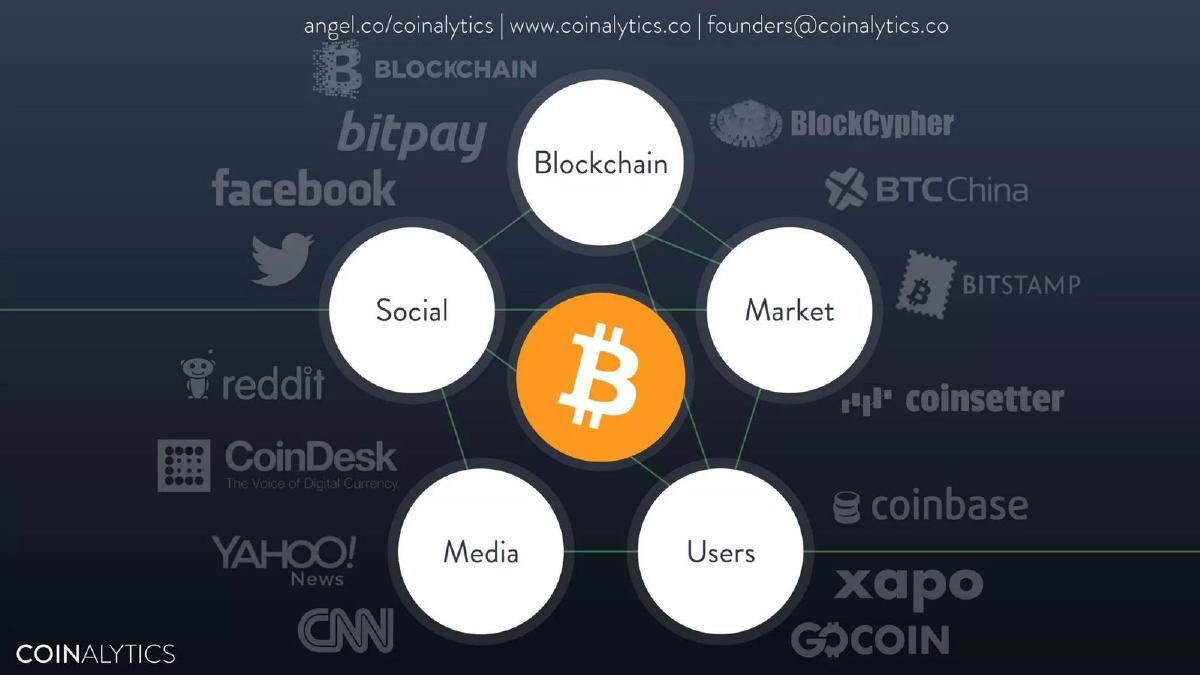
Slide 4 visualizes the fragmented nature of the crypto ecosystem. It surrounds a Bitcoin logo with logos from Facebook, Twitter, Reddit, CoinDesk, Yahoo! News, CNN, Bitpay, BlockCypher, BTC China, Bitstamp, Coinsetter, Coinbase, Xapo, and GoCoin. The implication is that data is scattered across social, media, market, and blockchain sources. Slide 5 introduces the solution: a laptop interface that aggregates these five categories (Media, Social, Blockchain, Market, Users) for three specific groups: Traders, Investors, and Companies.
Slides 6-8: The Product and Value Proposition
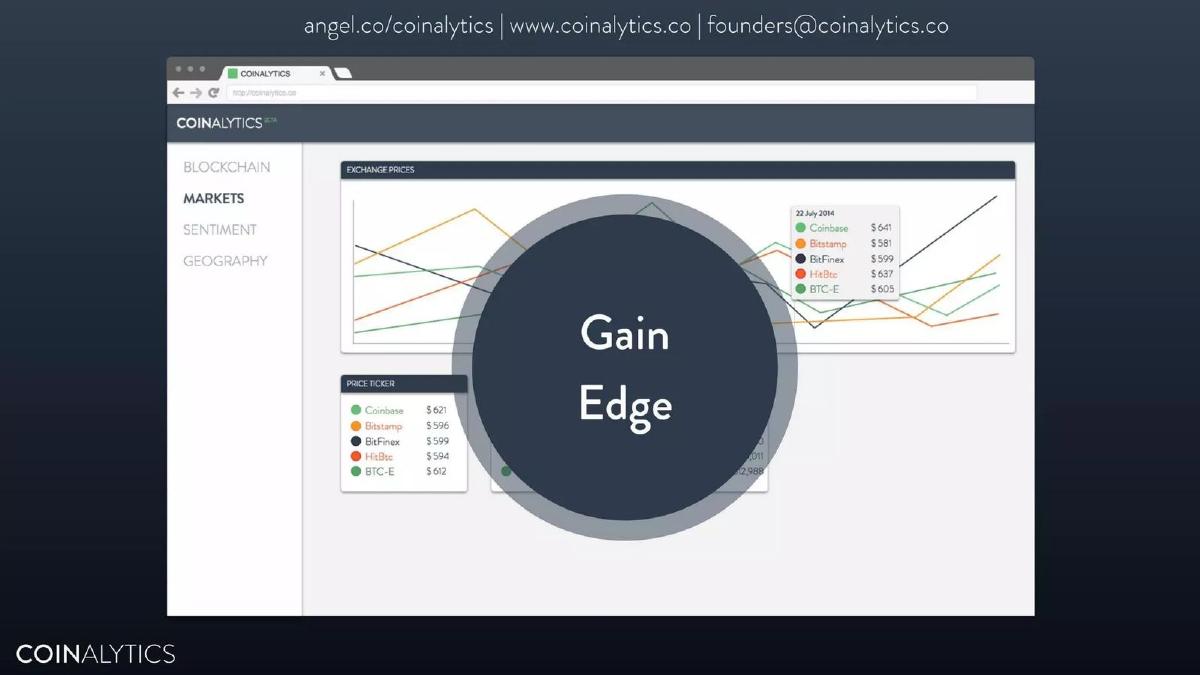
This section uses dashboard mockups to illustrate the 'Beta' version of the platform. Each slide features a large central circle with a two-word value proposition. Slide 6 shows exchange price charts with the text 'Gain Edge.' Slide 7 displays transaction size histograms and address clusters with the text 'Reduce Risk.' Slide 8 shows a geographical heat map of transaction volume with the text 'Competitive Advantage.' These slides are designed to prove the product exists and looks professional, even if they don't explain the specific features or proprietary algorithms used.
Slide 9: The Team
The team slide is a standard three-person layout. It features Fabio Federici (CEO) , Bill Gleim (Tech Lead) , and James Edwards (Data Architect) . The most prominent elements on this slide are the logos for Google and Amazon Web Services , attached to the Tech Lead and Data Architect respectively. This is a clear 'pedigree play,' intended to assure investors that the technical challenges of 'Big Data' in blockchain are being handled by engineers from the world's leading data infrastructure companies.
Slides 10-11: The Summary and Close
Slide 10 distills the company's core pillars into three circles: Information Infrastructure, Real-time Analytics, and Actionable Insights. This serves as a final reinforcement of the 'Bloomberg' analogy. Slide 11 is a simple 'Thanks' slide with the founders' email address. There is no 'Ask' slide, no roadmap, and no mention of how the $1.3 million would be spent.
What Works in the Coinalytics Deck
The primary strength of this deck is its clarity of vision. By using the Bloomberg analogy, the founders bypass the need for lengthy explanations of what their software does. Investors in 2017 understood the value of a Bloomberg terminal; by extension, they understood the potential value of a similar tool for a new, volatile asset class.
The visual design is also a highlight. The consistent dark theme, clean typography, and high-quality product mockups suggest a level of polish and professionalism that was often lacking in early crypto startups. The use of large, simple text blocks makes the deck easy to skim, which is critical for initial investor reviews.
Finally, the team positioning is excellent. By highlighting Google and AWS, the deck addresses the 'how' of the technology without getting bogged down in technical jargon. It tells the investor: 'We have the people who built the modern web, and they are now building the data layer for the blockchain.'
What Is Missing from the Coinalytics Deck
The most glaring omission is financial data. There is no mention of revenue, pricing models, or customer acquisition costs. While this is common in very early seed decks, the total lack of a business model slide leaves a significant gap in the narrative. It is unclear if this is a SaaS product, a per-seat license, or an API-first business.
There is also no competitive analysis. By 2017, other blockchain analytics firms were emerging. By ignoring the competition, the deck assumes the investor isn't looking at other deals in the space, which is a risky assumption. A simple matrix showing how Coinalytics differed from basic block explorers or existing financial terminals would have added depth.
The lack of a specific 'Ask' is another missed opportunity. While the catalogue facts state they raised $1.3 million, the deck itself doesn't tell the investor what the company needs or what milestones the funding will unlock. A roadmap slide showing the transition from 'Beta' to a full commercial launch would have provided a clearer sense of momentum.
What Founders Should Copy
Founders should emulate the 'Three Pillars' approach seen on slide 10. Distilling a complex technical product into three easily digestible benefits (Infrastructure, Analytics, Insights) helps anchor the investor's memory. If an investor can't explain what you do in one sentence after seeing your deck, you have failed; Coinalytics succeeds here by being 'Bloomberg for Bitcoin.'
The use of multipliers on slide 3 is also a clever tactic for early-stage companies that may not have impressive absolute numbers yet. Showing that a market is growing 8x year-over-year is often more compelling than showing a small, albeit growing, dollar amount. It frames the opportunity as a tidal wave that the company is positioned to ride.
Lastly, the minimalist product slides (6-8) are a great way to show progress. Instead of a 10-minute demo, these slides provide a 'vibe check' of the user interface. They prove the team can build a functional, aesthetic product, which is often enough to get a first meeting at the seed stage.
Frequently asked questions
- What was the primary value proposition of Coinalytics?
- Coinalytics positioned itself as an intelligence layer for the blockchain. According to slides 6, 7, and 8, the platform aimed to help users 'Gain Edge,' 'Reduce Risk,' and achieve 'Competitive Advantage' by aggregating data from disparate sources like social media, news, and on-chain transactions into a single dashboard.
- How did the deck demonstrate market demand?
- Rather than using traditional TAM/SAM/SOM slides, Coinalytics used slide 3 to show 'Growth YTD' across five sectors. It claimed 2x growth for Blockchain, 3x for Media, 5x for Social, 7x for Users, and 8x for the Market, suggesting a rapidly expanding ecosystem that required professional-grade analytics.
- Who were the target customers for this platform?
- Slide 5 explicitly identifies three target segments: Traders, Investors, and Companies. The deck suggests these groups need a centralized tool to process information coming from various sources, including exchanges like Coinbase and Bitstamp, and social platforms like Reddit and Twitter.
- What technical expertise did the team highlight?
- The team slide (slide 9) focuses on three key roles: CEO, Tech Lead, and Data Architect. The deck highlights the Tech Lead's background at Google and the Data Architect's background at Amazon Web Services, signaling to investors that the startup had the engineering talent to handle large-scale data processing.
- Is there a clear business model in the deck?
- No. The deck is entirely silent on how the company intended to make money. There is no mention of subscription tiers, API pricing, or enterprise licensing fees. It focuses exclusively on the utility of the data and the growth of the underlying market.