The AGS Investor Overview from June 2018 is a data-heavy presentation designed for sophisticated institutional investors, likely following their January 2018 IPO. The deck excels at demonstrating historical growth, citing a 217% revenue increase from 2014 to the LTM ending March 31, 2018. It utilizes a clear 'land and expand' narrative, showing how the company leverages its Electronic Gaming Machine (EGM) footprint to cross-sell table products and interactive gaming. While the deck is light on 'visionary' storytelling, it compensates with extreme financial transparency, including a consolidat…
Key takeaways
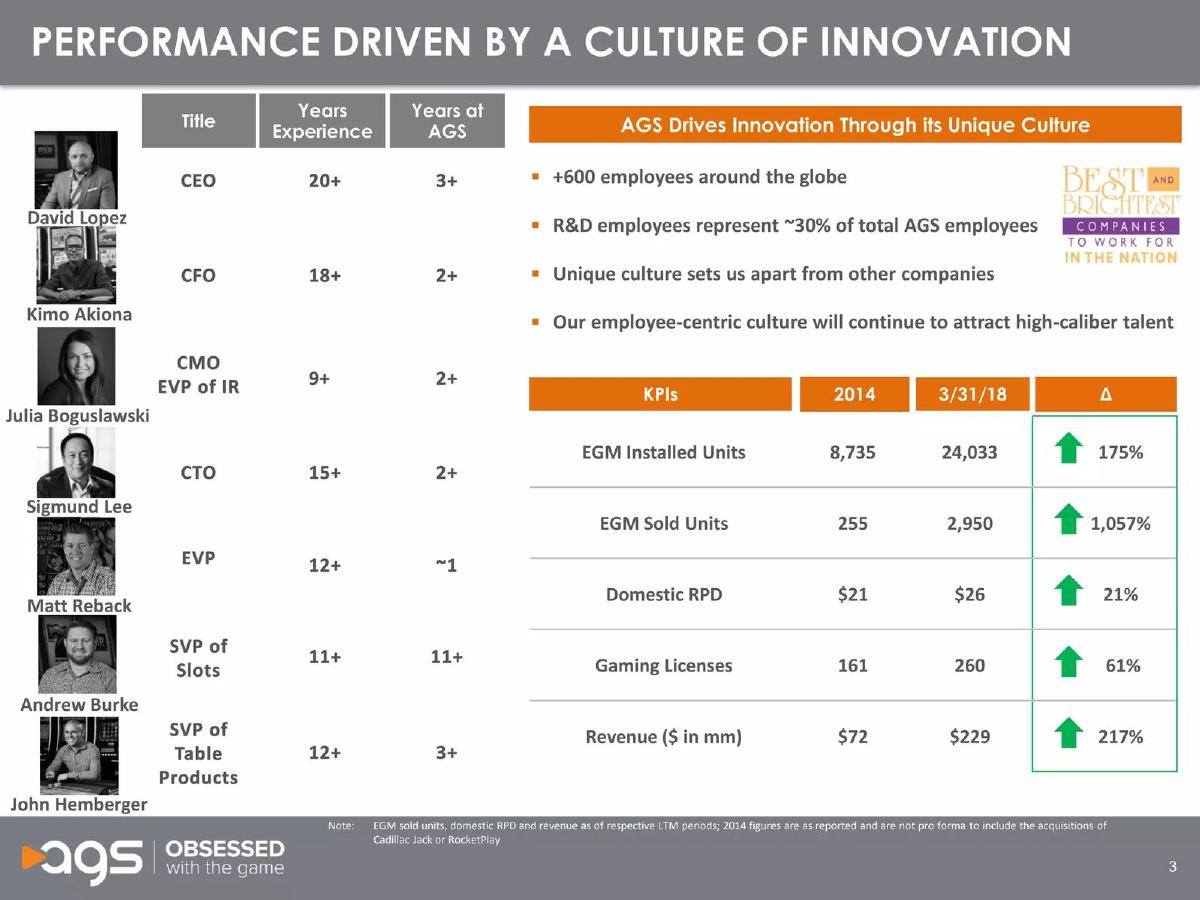
- Revenue grew from $72 million in 2014 to $229 million for the LTM period ending 3/31/18, representing a 217% increase (Slide 3).
- The company maintains a high-tenure leadership team, with the CEO and CFO possessing 20+ and 18+ years of industry experience respectively (Slide 3).
- AGS has successfully diversified its product mix into four quadrants: Cabinets, Titles, Table Products, and Interactive gaming (Slide 6).
- The Table Products segment achieved a 68.3% CAGR in its installed base from 2015 to early 2018, driven by acquisitions like Buster Blackjack (Slide 9).
- Geographic concentration remains high, with Oklahoma and Nevada accounting for the largest share of the 69% 'Established' market units (Slide 12).
- International strategy is tiered by 'Immediate Upside' (Philippines/Canada) and 'Pending Legislation' (Brazil), where they target a 500,000 machine market (Slide 15).
- Unit economics are highly efficient, boasting a 12-month payback on core EGM units and an 8-month payback on premium units (Slide 18).
- The business model is cash-flow positive, reporting a 99% cash flow conversion rate for the LTM period ending 3/31/18 (Slide 18).
Executive Summary: The Post-IPO Growth Engine
The AGS Investor Overview from June 2018 is not a typical startup pitch deck. Published shortly after the company's IPO, it serves as a comprehensive operational update for institutional shareholders. The deck is characterized by extreme data density, focusing on the 'how' and 'how much' rather than the 'why.' For founders, this deck is a masterclass in demonstrating how M&A (Mergers and Acquisitions) can be integrated into a core product narrative to show a path toward market dominance.
Slide 1: Title and Visual Identity
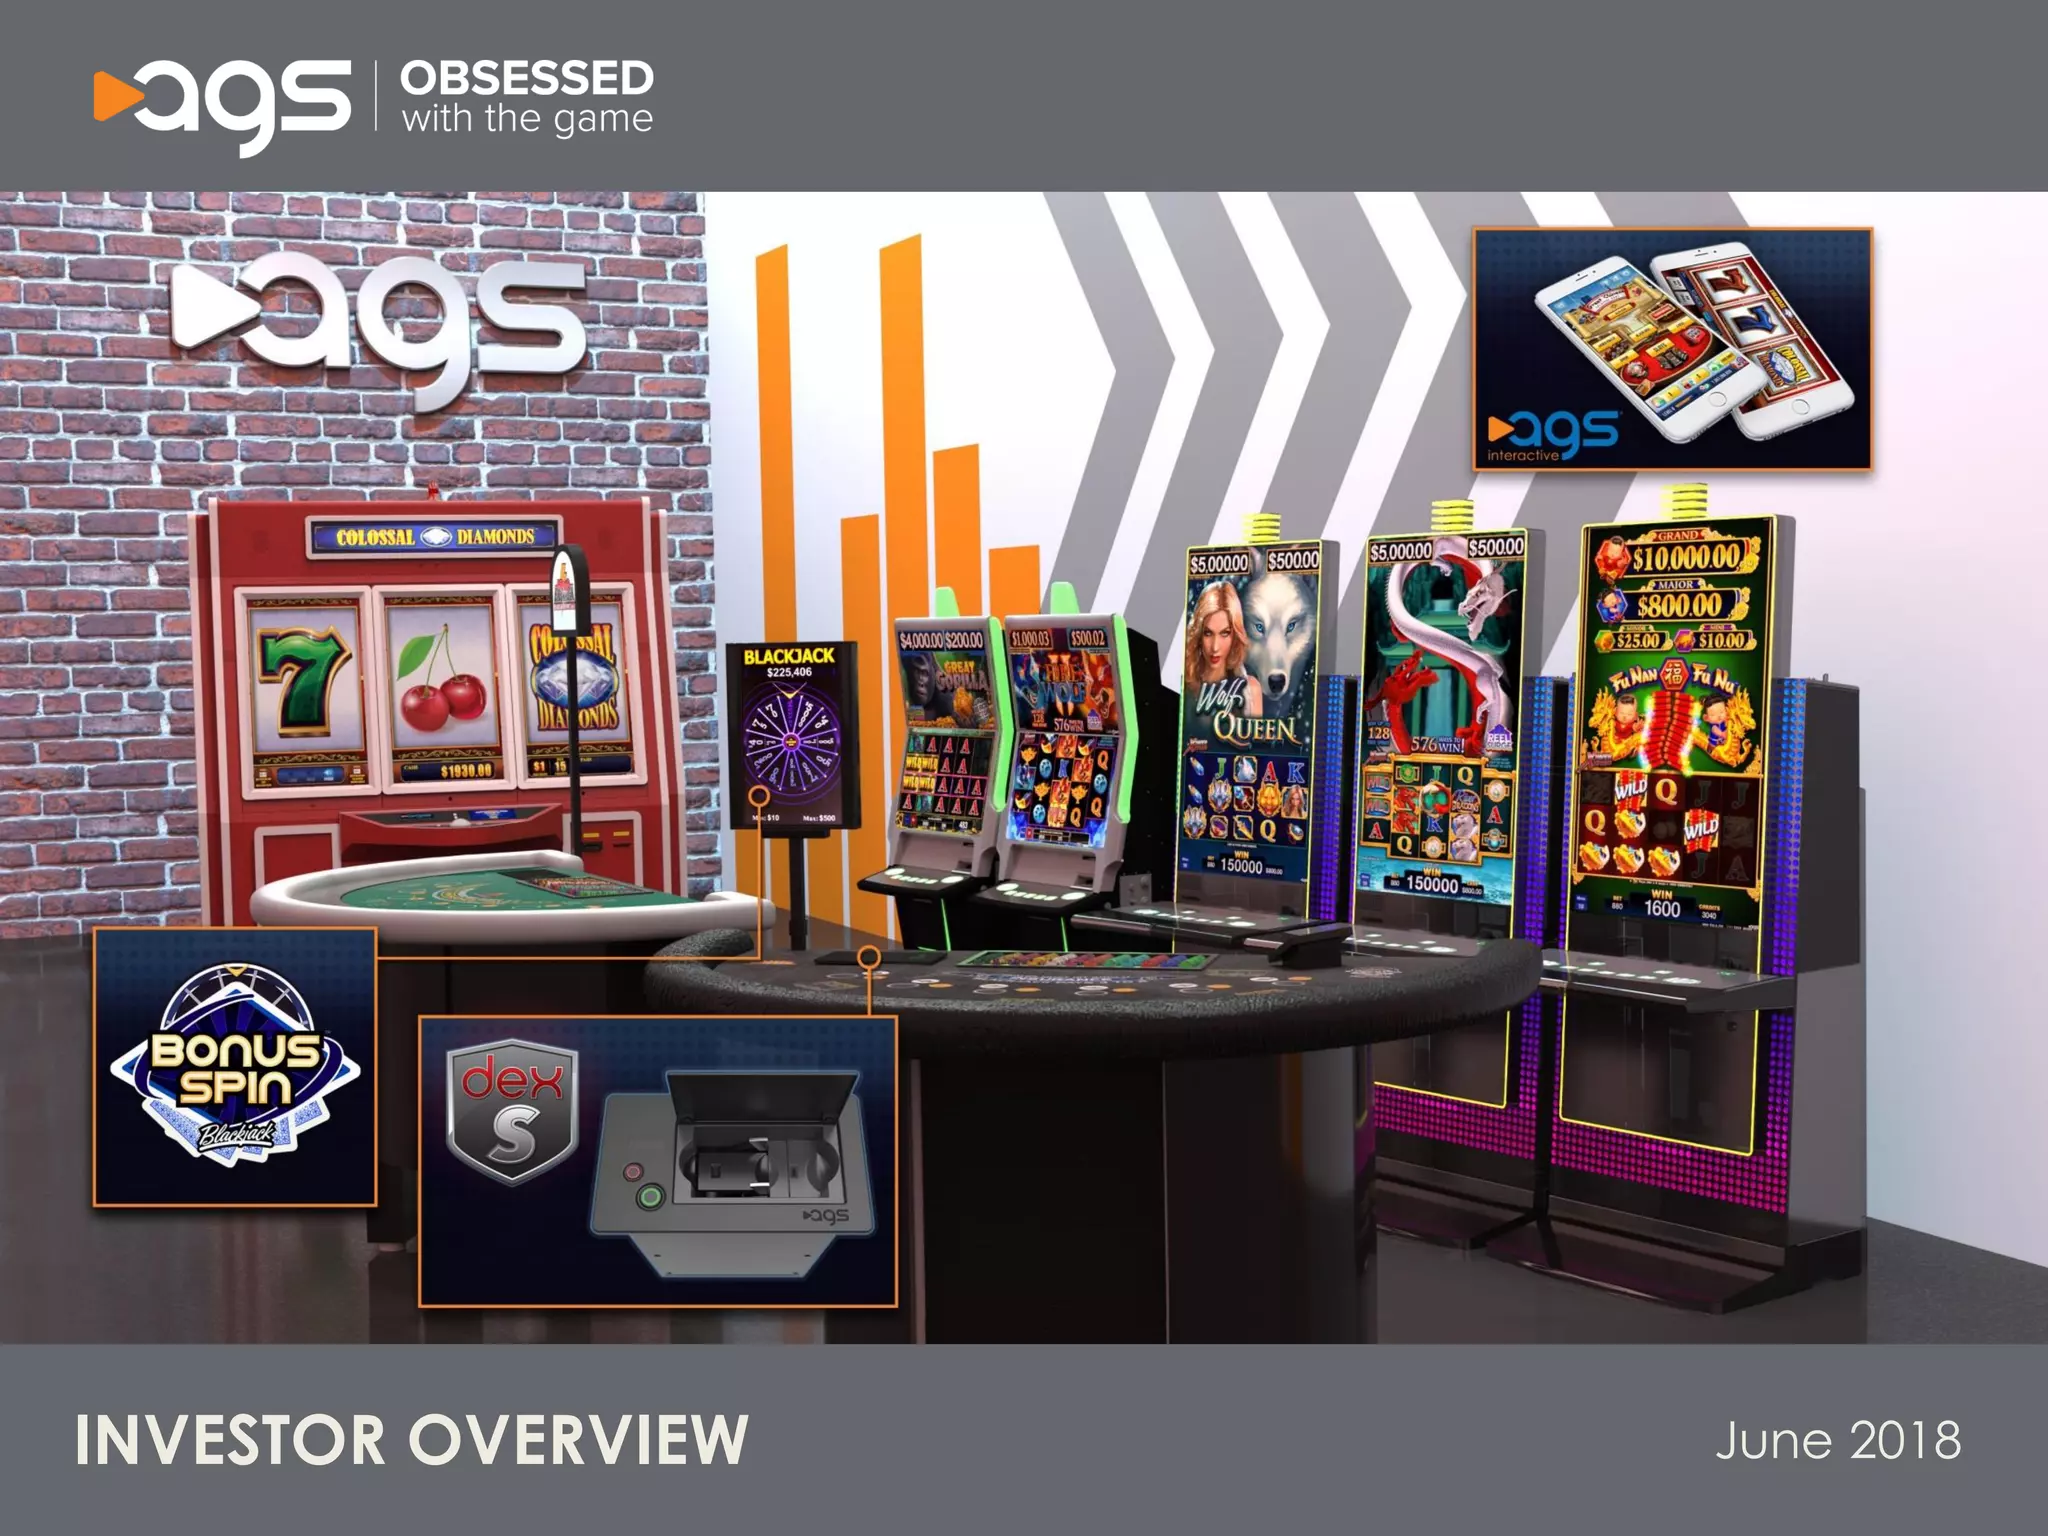
The cover slide establishes the brand's physical presence. It features a high-fidelity render of the AGS product ecosystem: the 'Colossal Diamonds' cabinet, 'Bonus Spin' blackjack tables, and the 'dex S' card shuffler. By including mobile devices in the top right corner, AGS immediately signals its omni-channel approach (land-based and interactive). The tagline 'Obsessed with the game' and the 'June 2018' date stamp set the professional tone expected of a publicly traded entity.
Slide 3: Performance and Leadership
This slide serves as the 'Team' and 'Traction' slide combined. It lists seven key executives, highlighting their deep industry roots. CEO David Lopez is noted for 20+ years of experience, while the team collectively averages over a decade in the gaming sector. The 'Years at AGS' column is particularly telling; most of the C-suite joined around 2-3 years prior to the deck, suggesting a team brought in specifically to scale the company toward its IPO.
The right side of the slide presents a powerful KPI table comparing 2014 to 3/31/18. The growth figures are staggering: EGM Sold Units increased by 1,057% (from 255 to 2,950) and Total Revenue grew by 217% (from $72 million to $229 million). The inclusion of 'Gaming Licenses' (up 61% to 260) is a crucial industry-specific metric that demonstrates the widening of their regulatory moat.
Slide 6: Product Portfolio Diversification
Slide 6 uses a puzzle-piece graphic to show how the four business segments—Cabinets, Titles, Table Products, and Interactive—fit together. The key takeaway here is the 'Ability to Cross-Sell.' AGS isn't just selling a machine; they are selling a content ecosystem. They highlight that 50+ titles are set to launch and mention the 'New Orion family' of cabinets. This slide addresses the 'Product' requirement of a pitch by showing both the hardware (cabinets/shufflers) and the software (titles/mobile games) that drive recurring revenue.
Slide 9: Table Products Segment Deep Dive
This slide focuses on the high-margin Table Products division. It notes that the segment has nearly 100% recurring revenue and recently became EBITDA positive . The bar chart shows a 68.3% CAGR in the installed base, growing from 815 units in 2015 to 2,631 units by March 2018. The timeline at the bottom is a strategic roadmap of M&A, showing the acquisition of Buster Blackjack (2015) and assets from In Bet Gaming (2017). This proves to investors that AGS can successfully identify, acquire, and integrate smaller players to fuel growth.
Slide 12: Domestic Footprint and Market Penetration
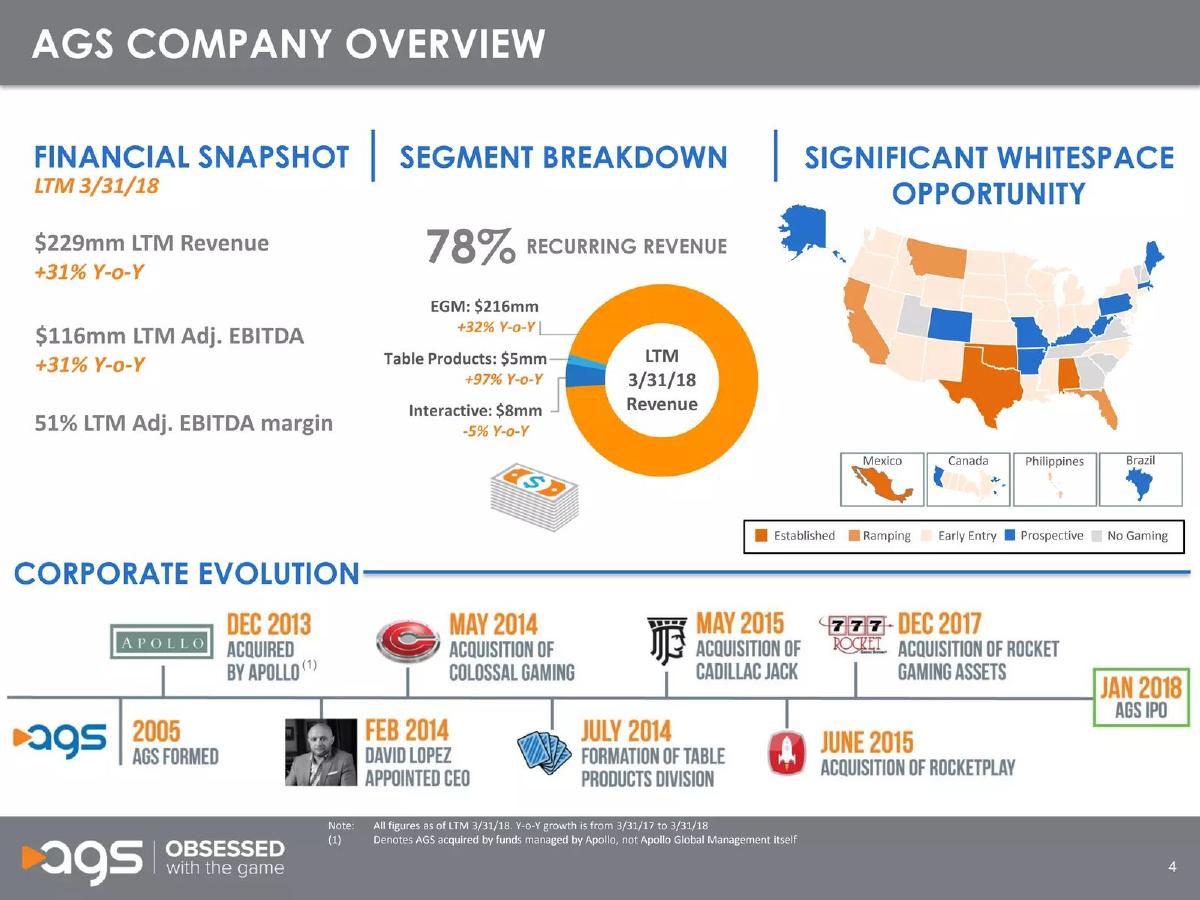
The heat map of the U.S. and Canada provides a geographic breakdown of their market share. The pie chart indicates that 69% of their units are in 'Established' markets , with Oklahoma (74,787 units) and Nevada (161,484 units) being the primary strongholds. The 'Prospective' blue-shaded states (like PA, IL, and KY) represent the immediate domestic growth runway. This slide is essential for showing that despite their size, there is still significant 'white space' in the U.S. market.
Slide 15: International Expansion Strategy
AGS categorizes its global ambitions into three tiers. The 'Immediate Upside' focuses on the Philippines, where they target 3,000-5,000 units (4-7% of the market), and Canada, where they are launching into three new jurisdictions. The 'Pending Legislation' section highlights Brazil as a massive 500,000-unit opportunity where they already have MOUs for ~8,700 leased units . This slide gives investors a clear timeline for international revenue realization.
Slide 18: Cash Flow and Unit Economics
This is arguably the most important slide for a financial analyst. It breaks down why the AGS business model is superior to its peers. They claim a Total Adj. EBITDA margin of 51% , compared to the industry average of ~32%. The slide also reveals highly attractive unit economics: a 12-month payback on core units and an 8-month payback on premium units . The bar chart showing a 99% cash flow conversion rate since 2017 demonstrates that the company is a 'cash cow,' capable of self-funding its R&D and debt deleveraging.
Slide 23 & 24: The Appendix and Consolidated Summary
Slide 23 is a simple transition to the Appendix. Slide 24, the 'Consolidated Operational Summary,' is a dense spreadsheet that would usually be hidden in a data room. It tracks every major metric from 2014 through Q1 2018. Notable figures include the Interactive segment's Average MAU of 200,741 and the EGM segment's Average Sales Price of $16,833 . This level of transparency is designed to build absolute trust with the investor base by showing the granular trends behind the headline growth numbers.
What Works in This Deck
1. Unapologetic Data Transparency: Unlike many decks that use vague 'up and to the right' arrows, AGS provides exact figures for every KPI. Citing an 8-month payback period (Slide 18) is a powerful way to prove capital efficiency.
2. Clear Segmentation: By breaking the business into EGM, Table Products, and Interactive, AGS allows investors to value the company as a sum-of-the-parts. They show that while EGMs are the current breadwinner, Table Products are the high-growth recurring revenue engine.
3. Regulatory Moat Visualization: Slide 12's map isn't just about sales; it's about licensing. In the gaming industry, licenses are the ultimate barrier to entry, and showing 260 licenses (Slide 3) proves their competitive advantage.
What is Missing
1. Competitive Landscape: The deck mentions 'peers' in passing (Slide 18) but never names them or provides a direct feature-by-feature comparison. In a crowded market with giants like IGT or Scientific Games, this is a notable omission.
2. Risk Factors: As a post-IPO deck, one might expect a slide addressing the risks of international expansion or the volatility of the 'Interactive' gaming space, though these are likely covered in their SEC filings.
3. Detailed Use of Proceeds: While they mention 'reinvestment in high ROI growth,' there is no specific breakdown of how the next $50M or $100M will be spent—likely because this is an 'Overview' rather than a specific 'Ask' deck.
Founder Takeaway: Copy the 'Unit Economics' Slide
If you are a founder in a hardware-enabled SaaS or a capital-intensive industry, Slide 18 is your blueprint. Most founders fail to articulate the 'Payback Period' of their physical assets. AGS wins by showing that their machines pay for themselves in less than a year. If you can prove to an investor that every dollar they give you will be 'returned' by the customer in 8 months, you aren't just asking for money—you are offering a high-yield investment vehicle. Additionally, the 'Consolidated Operational Summary' (Slide 24) is a great example of how to organize a multi-year data table for a series B or C round where historical trends are scrutinized as much as future projections.
Frequently asked questions
- What is the primary revenue driver for AGS according to this deck?
- The primary driver is the Electronic Gaming Machine (EGM) segment. As shown on Slide 24, EGM revenue accounted for $216.2 million of the $229 million total LTM revenue as of March 2018. The deck emphasizes a recurring revenue model through an installed base of 24,033 units, which generates a 'Domestic RPD' (Revenue Per Day) of $26.
- How does AGS handle competition and market entry?
- AGS uses a mix of organic R&D and strategic acquisitions. Slide 9 highlights four major acquisitions between 2014 and 2017 to build their Table Products division. For market entry, Slide 12 shows they categorize jurisdictions as 'Established,' 'Ramping,' or 'Prospective,' allowing them to focus resources on states like PA and MS which are in the 'Ramping' phase.
- What are the specific unit economics for their hardware?
- Slide 18 provides specific ROI metrics that are rare in most pitch decks. They claim a 12-month payback period for 'core units' and a faster 8-month payback for 'premium units.' This is supported by an industry-leading Adjusted EBITDA margin of 51%, significantly higher than the peer average of ~32%.
- What is the status of their international expansion?
- As of June 2018, the Philippines was the immediate focus with units shipping in 2018 to target a 70,000-unit market. Canada was also in 'Immediate' status with a launch planned for three jurisdictions. Brazil represents the largest long-term 'Pending' opportunity, where AGS already has MOUs for ~8,700 leased units (Slide 15).
- Is the company profitable based on these slides?
- Yes, the company emphasizes its 'Strong Cash Flow Conversion.' Slide 18 shows that since 2017, they have maintained a 99% cash flow conversion rate (defined as EGM Adjusted EBITDA minus maintenance capex, divided by EGM Adjusted EBITDA). They also noted the Table Products segment recently became EBITDA positive (Slide 9).