Agrosmart’s pitch deck focuses on the intersection of IoT hardware and data analytics within the agricultural sector, specifically targeting the Brazilian market. The company addresses the 'connectivity barrier' by deploying proprietary mesh networks that communicate via radio frequency up to 14km, bypassing the lack of cellular coverage in rural fields. Their value proposition is built on real-time monitoring of 14 environmental variables to optimize irrigation and crop management. While the deck is heavy on product features and technical infrastructure, it successfully communicates tangible…
Key takeaways
- The company identifies a critical infrastructure gap, noting that Brazil has large crop areas with poor cellphone or internet coverage (Slide 4).
- Agrosmart uses a proprietary mesh network where modules communicate via radio frequency up to 14km to reach a central data logger (Slide 4).
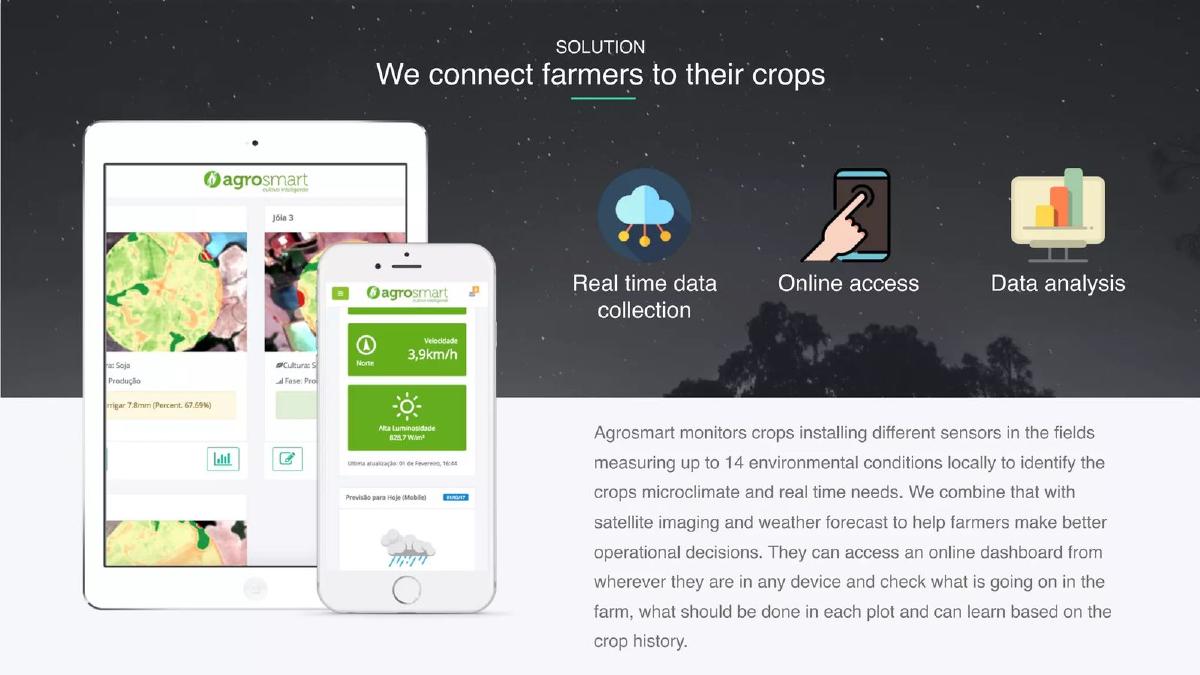
- The system monitors up to 14 different environmental conditions locally to identify microclimates and real-time crop needs (Slide 3).
- Data is collected every 15 minutes to run algorithms that generate irrigation and operational recommendations (Slide 4).
- The platform integrates multiple data sources, including soil sensors, digital rain gauges, weather stations, and satellite imaging (Slide 5, 7).
- Quantifiable results include up to 60% water reduction, 40% energy savings, and yield increases of up to 20% (Slide 9).
- The product line is segmented into tiered plans like 'Soil Smart' and 'Rain Smart' to facilitate market entry and online selling (Slide 10).
- The deck completely omits a team slide, business model details, market size (TAM/SAM), and the financial ask.
Agrosmart: Bridging the Connectivity Gap in Precision Agriculture
The Agrosmart pitch deck, titled 'Hacker unit deck' in the source listing, is a product-centric presentation that focuses heavily on the technical hurdles of precision agriculture in emerging markets, specifically Brazil. The deck follows a logical flow from the global macro-problem of food security to the specific local problem of rural connectivity, before diving deep into the hardware and software solution. While it excels at explaining the 'how' of the technology, it leaves significant gaps regarding the 'who' and the 'how much' of the business itself.
Slide 1: Title Slide
The cover slide features the Agrosmart logo with the tagline 'cultivo inteligente' (intelligent cultivation). The background image shows a vast agricultural field with green location pins scattered across the landscape, visually representing the concept of a monitored, data-driven farm. The design is clean and establishes the agricultural focus immediately.
Slide 2: The Macro Problem
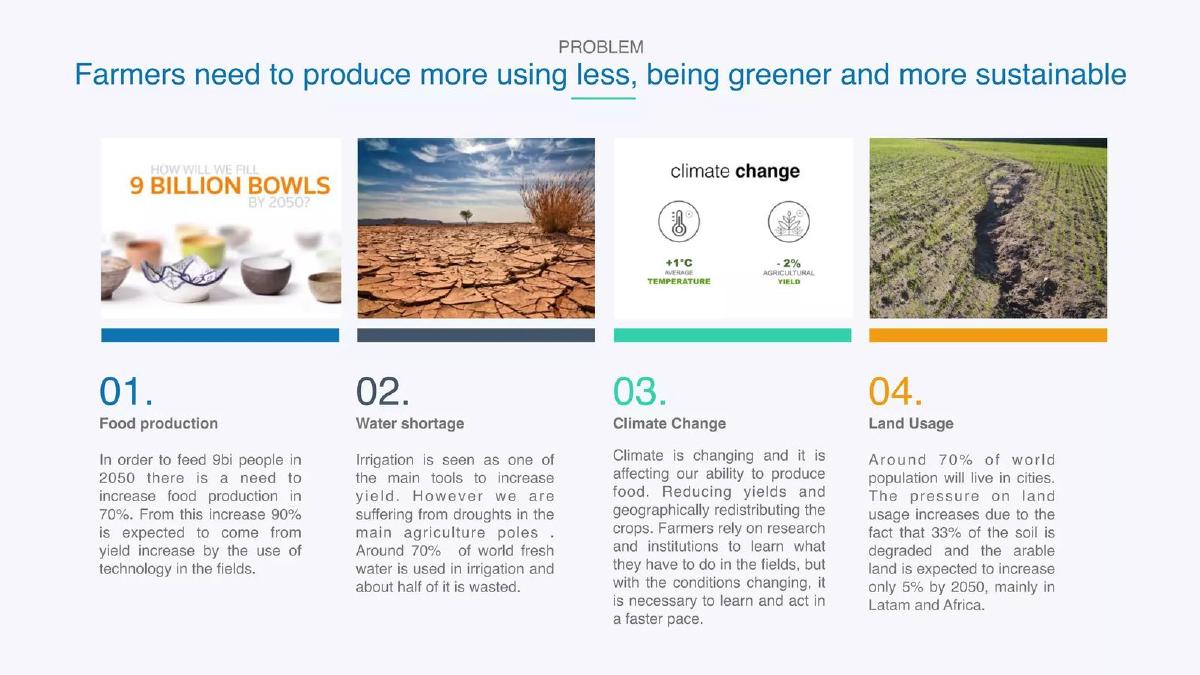
Slide 2 frames the company's mission within the global context of the year 2050. It identifies four key pillars: 01. Food production (the need to feed 9 billion people, requiring a 70% increase in production), 02. Water shortage (70% of fresh water is used in irrigation, with half wasted), 03. Climate Change (impacting yields and requiring faster adaptation), and 04. Land Usage (33% of soil is degraded). The slide uses a mix of statistics and imagery to establish urgency, citing that 90% of food production increases must come from technology-driven yield improvements.
Slide 3: The Solution Overview
The solution is summarized as 'We connect farmers to their crops.' This slide introduces the three core components of the Agrosmart platform: Real time data collection , Online access , and Data analysis . The text specifies that the system monitors up to 14 environmental conditions locally, combining sensor data with satellite imaging and weather forecasts to help farmers make better operational decisions. It emphasizes that the dashboard is accessible from any device and allows for learning based on crop history.
Slide 4: Solving the Connectivity Barrier
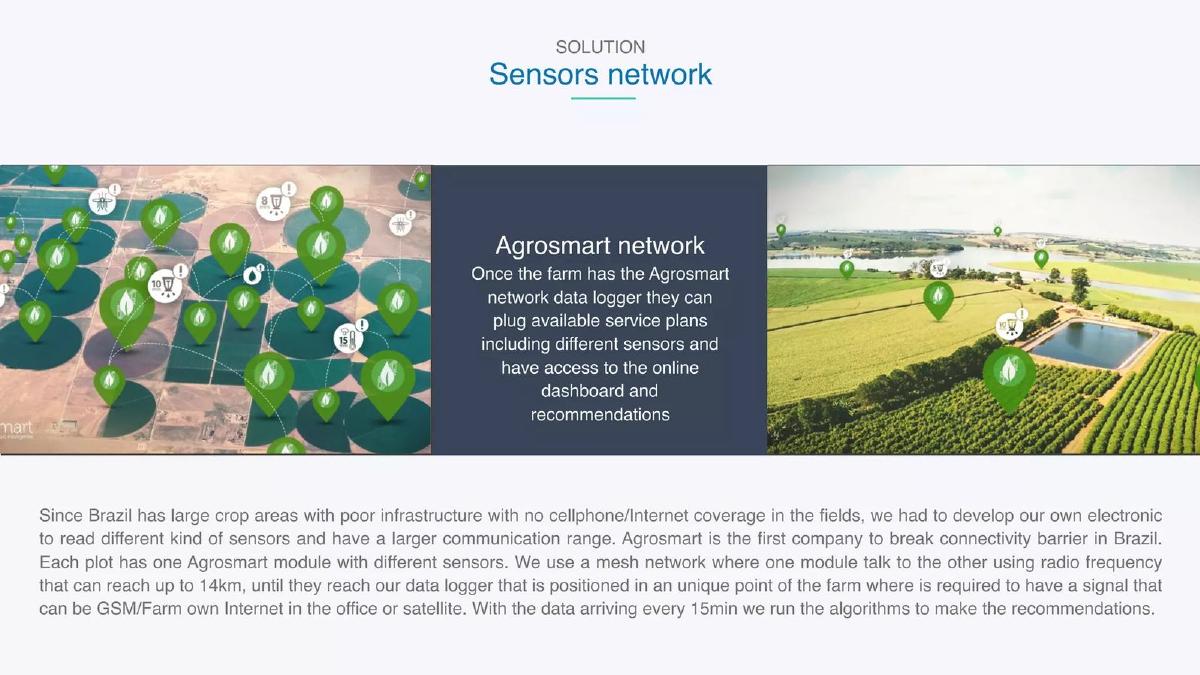
This is arguably the most important slide in the deck. It addresses a specific regional pain point: the lack of cellphone and internet coverage in Brazilian fields. Agrosmart explains that they developed their own electronic system to read sensors and a proprietary mesh network using radio frequency. This network allows modules to communicate over distances of up to 14km. The data is eventually sent to a central logger that uses GSM, local internet, or satellite to upload information every 15 minutes. This slide positions Agrosmart not just as a software company, but as an infrastructure provider for the 'last mile' of agricultural data.
Slide 5: The Hardware Ecosystem
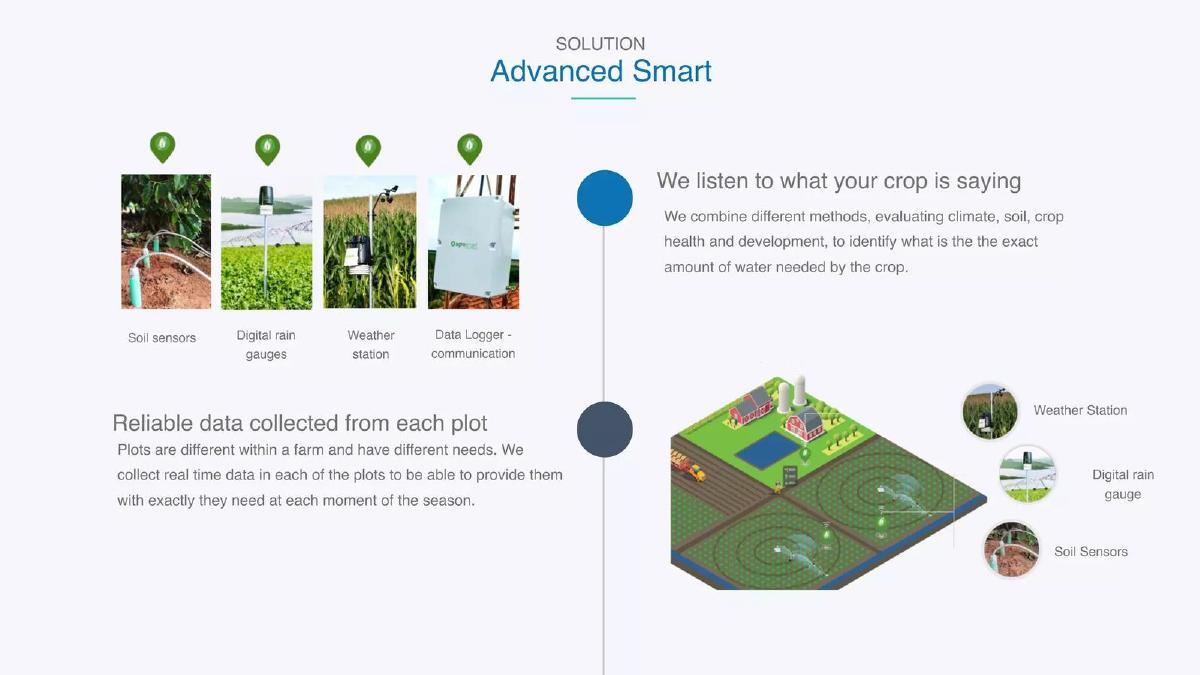
Slide 5, titled 'Advanced Smart,' visualizes the physical components of the system. It lists Soil sensors , Digital rain gauges , Weather stations , and the Data Logger . An isometric illustration shows how these components are distributed across a farm to collect real-time data from individual plots. The core message is that 'plots are different within a farm and have different needs,' justifying the density of the sensor network.
Slide 6: The User Interface and Recommendations
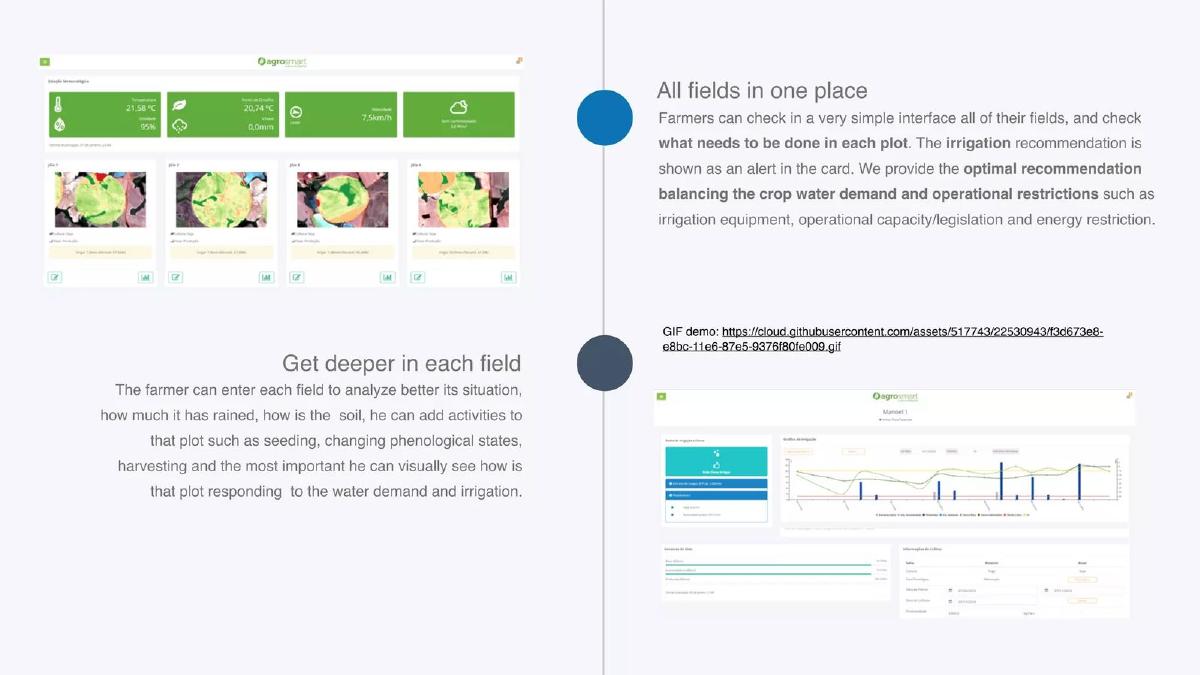
This slide focuses on the software experience. It shows a dashboard where farmers can check the status of all fields in one place. The text highlights that the system provides 'optimal recommendations' that balance water demand with operational restrictions such as irrigation equipment capacity, legislation, and energy costs. It also includes a link to a GIF demo, suggesting that the software is functional and ready for use.
Slide 7: Weather and Satellite Integration
Agrosmart details its data enrichment layers here. They claim to run 'more precise weather forecasts for the next 72 hours' by using smaller grids calibrated by local weather stations. Additionally, they use satellite imaging to provide an 'x-ray of the farm,' which helps in analyzing crop health, water stress, and equipment performance. This slide demonstrates that the company is not relying solely on ground sensors but is creating a multi-layered data model.
Slide 8: Data Accessibility
This slide emphasizes data transparency. It shows a spreadsheet-style view of historical data, stating that farmers can access raw data from sensors, choose specific plots or date ranges, and download the information as Excel or CSV files. The ability to 'integrate it in any other system' is presented as a key feature, appealing to more sophisticated agricultural enterprises that may have their own ERPs.
Slide 9: Results and ROI
Slide 9 provides the 'proof of value.' It lists four major benefits: Up to 60% water reduction , Save labor time (no manual data collection), Up to 40% in energy savings , and Yield increase in up to 20% . A testimonial from a corn farmer in Minas Gerais, Brazil, adds a human element, stating that the application is easy to use and helped increase yield by '10 bags per hectare.'
Slide 10: Product Segmentation
The final slide shows how Agrosmart has broken down its 'Advanced Smart' package into smaller, more accessible products. These include Agrosmart Network , Soil Smart , Rain Smart , Climate Smart , Weather Forecast , and NDVI images . The stated goal of this segmentation is to 'fulfill different customer segment needs' and create 'entrance products' that can be sold online to accelerate market expansion.
What Agrosmart Does Well
The deck is exceptionally strong at identifying a technical barrier—connectivity—and explaining a proprietary solution for it. In the context of Brazilian agriculture, where farms can be larger than some small countries, the 14km radio frequency mesh network is a compelling 'unfair advantage.' The deck also does a great job of translating technical features (14 sensors, 15-minute intervals) into business outcomes (60% water reduction, 20% yield increase). The use of a specific testimonial with a concrete metric (10 bags per hectare) adds significant credibility to their claims.
What is Missing from the Deck
Despite the strong product narrative, this deck is incomplete as a fundraising tool. The most glaring omission is the Team Slide . Investors back people, especially in hardware-heavy startups where execution is difficult. There is no information about the founders' backgrounds in agronomy, engineering, or the Brazilian market. Furthermore, there is no Market Size (TAM/SAM/SOM) analysis to show the scale of the opportunity, no Competitive Landscape to explain how they differ from global players like John Deere or local competitors, and no Business Model slide to explain how they charge for the hardware versus the software (SaaS). Finally, the deck lacks a Financial Ask and a roadmap for how the funds will be used.
What a Founder Should Copy
Founders should emulate the way Agrosmart handles the 'Solution' section. Instead of just showing a screenshot of an app, they explain the entire data pipeline: from the ground (sensors) to the transmission (mesh network) to the cloud (algorithms) and finally to the user (dashboard). This 'full-stack' explanation is very effective for IoT companies. Additionally, the 'Results' slide (Slide 9) is a masterclass in presenting ROI. By using large, bold percentages and a supporting testimonial, they make the economic benefit of their product undeniable. The strategy of unbundling a complex product into 'entrance products' (Slide 10) is also a smart move for companies facing long sales cycles in traditional industries like agriculture.
Frequently asked questions
- What is Agrosmart's core technological advantage?
- Agrosmart's primary advantage is its ability to provide connectivity in remote areas where cellular signals are non-existent. According to Slide 4, they developed a proprietary electronic system using a mesh network and radio frequency that can transmit data up to 14km. This allows them to collect data from sensors every 15 minutes and transmit it to a central logger connected via GSM, local internet, or satellite, overcoming the infrastructure barriers typical of large-scale Brazilian farming.
- How does the platform help farmers make decisions?
- The platform processes data from 14 environmental variables, satellite imagery, and weather forecasts to provide 'optimal recommendations' (Slide 6). These recommendations balance crop water demand with operational restrictions like equipment capacity and energy costs. Farmers receive alerts on a dashboard indicating exactly what needs to be done in each plot, moving from generic field management to precise, plot-by-plot interventions based on historical and real-time data.
- What are the specific ROI metrics mentioned in the deck?
- Slide 9 outlines several key performance indicators. The solution claims to deliver up to 60% reduction in water usage and up to 40% in energy savings. Furthermore, it highlights a yield increase of up to 20%. A testimonial from a corn farmer in Minas Gerais specifically mentions a yield increase of '10 bags per hectare' and a 'drastic' reduction in water waste, demonstrating both economic and environmental value.
- What is missing from this pitch deck for an investor?
- This deck is missing several critical components required for a standard venture capital pitch. There is no 'Team' slide to validate the founders' expertise, no 'Market Size' slide to show the total addressable market, and no 'Competition' slide. Most importantly, it lacks a 'Financials' or 'The Ask' slide, meaning the reader does not know how much capital is being raised or how it will be deployed.
- How does Agrosmart segment its product offering?
- As shown on Slide 10, the company has unbundled its 'Advanced Smart' package into smaller 'entrance products.' These include 'Soil Smart' for small crop areas with drip irrigation, 'Rain Smart' for non-irrigated areas, and digital-only products like 'NDVI images' and 'Weather Forecasts.' This strategy is designed to fulfill different customer segments and allow for faster expansion through online sales channels.