TVision's 8-slide Series C deck, used to raise $16M in 2022, is a concise exercise in narrative-driven fundraising. The deck avoids technical jargon in favor of clear market trends, specifically the decline of linear TV and the explosive growth of Connected TV (CTV). By aligning its product with industry-standard frameworks like the WFA & ANA, TVision positions itself not just as a tool, but as a foundational infrastructure for modern advertising. The financial slide shows a significant shift toward recurring revenue (85%) and CTV-related business (42%), proving the company's ability to evolv…
Key takeaways
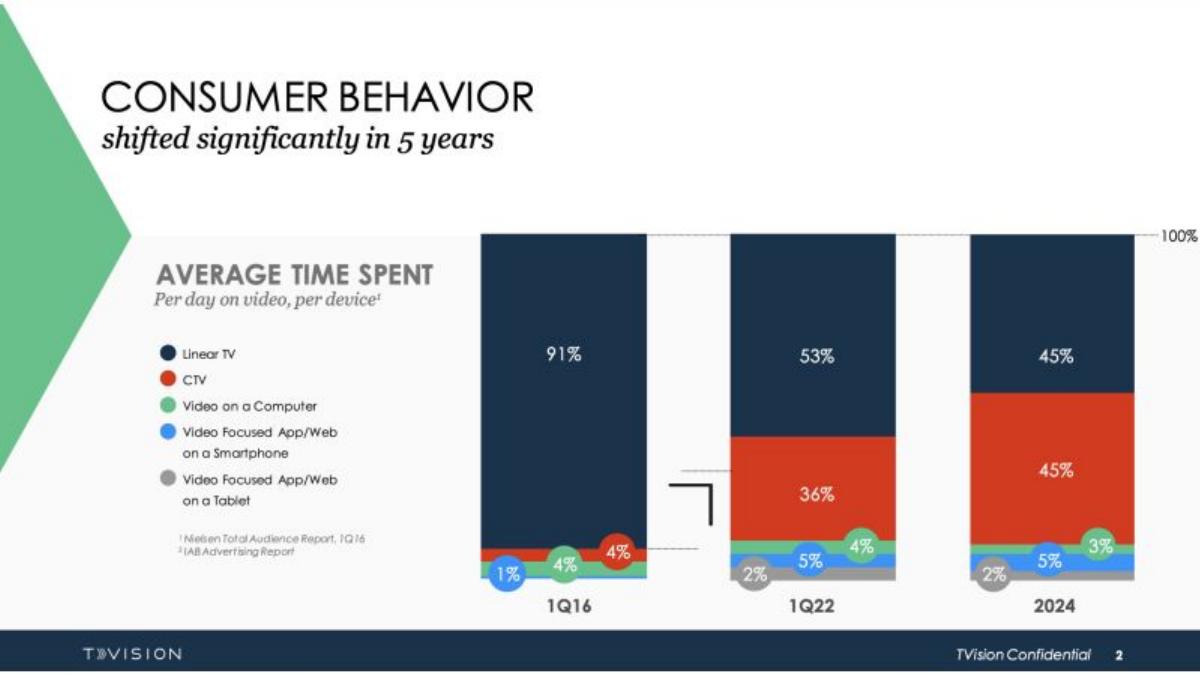
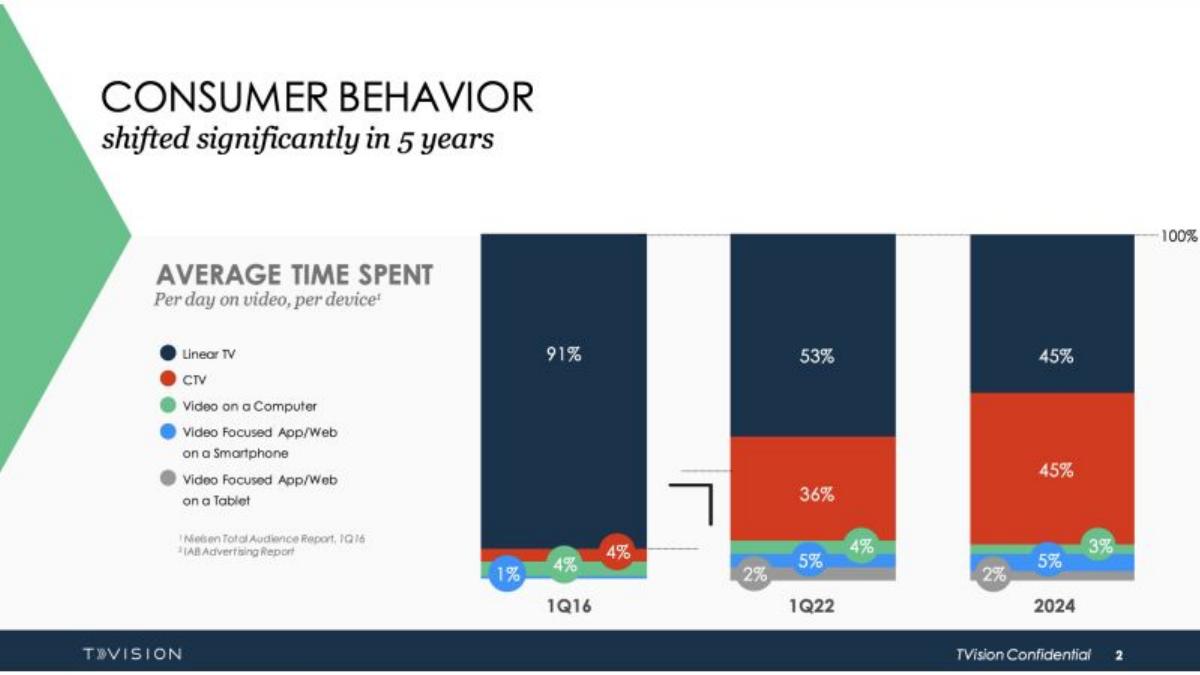
- Consumer behavior shifted from 91% linear TV time in 1Q16 to a projected 45% in 2024 (Slide 2).
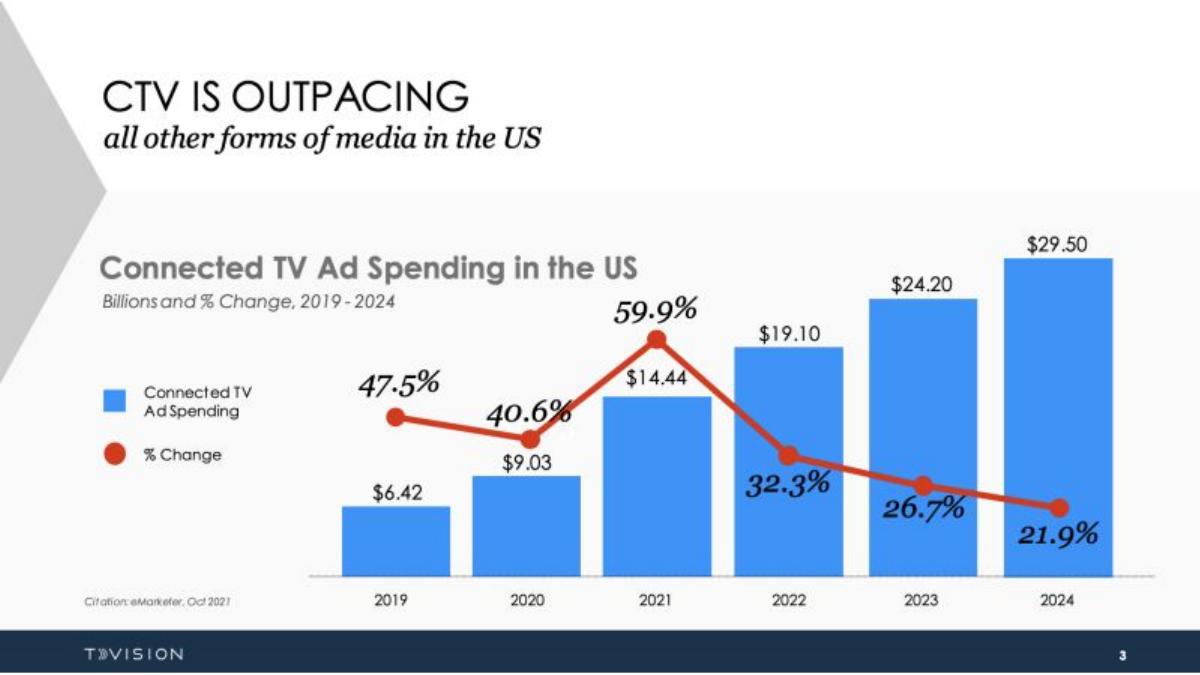
- Connected TV (CTV) ad spending is projected to reach $29.50 billion by 2024, despite a slowing growth rate (Slide 3).
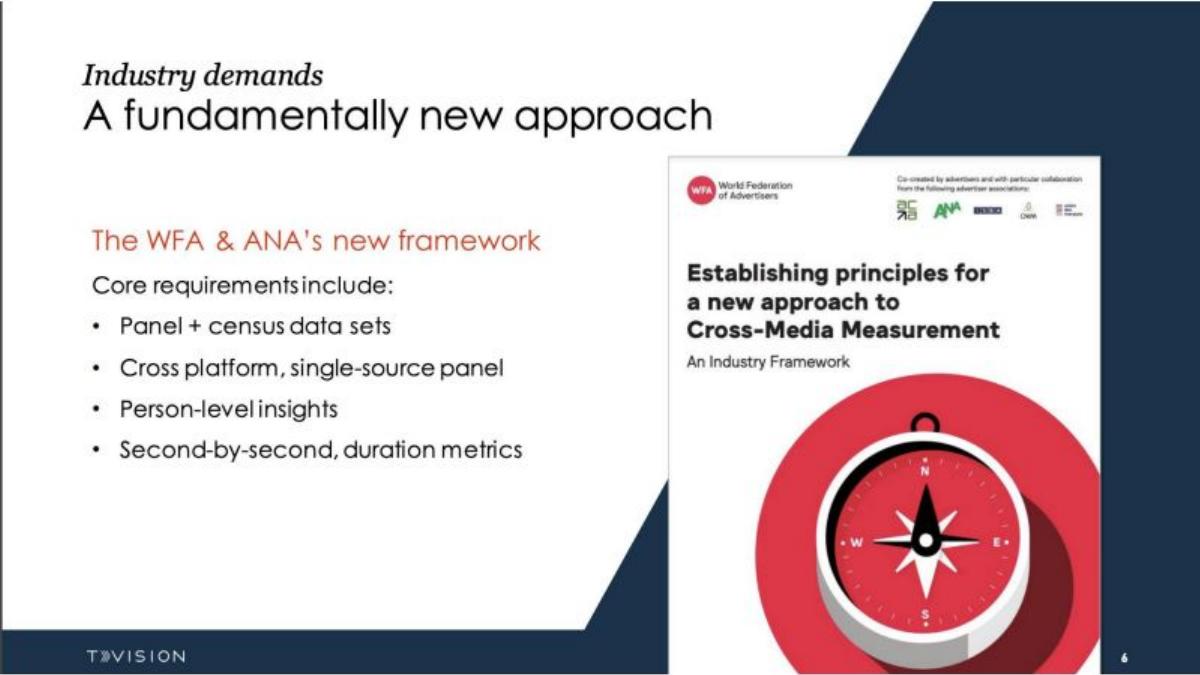
- The company aligns its solution with the WFA & ANA framework, requiring panel + census data and person-level insights (Slide 6).
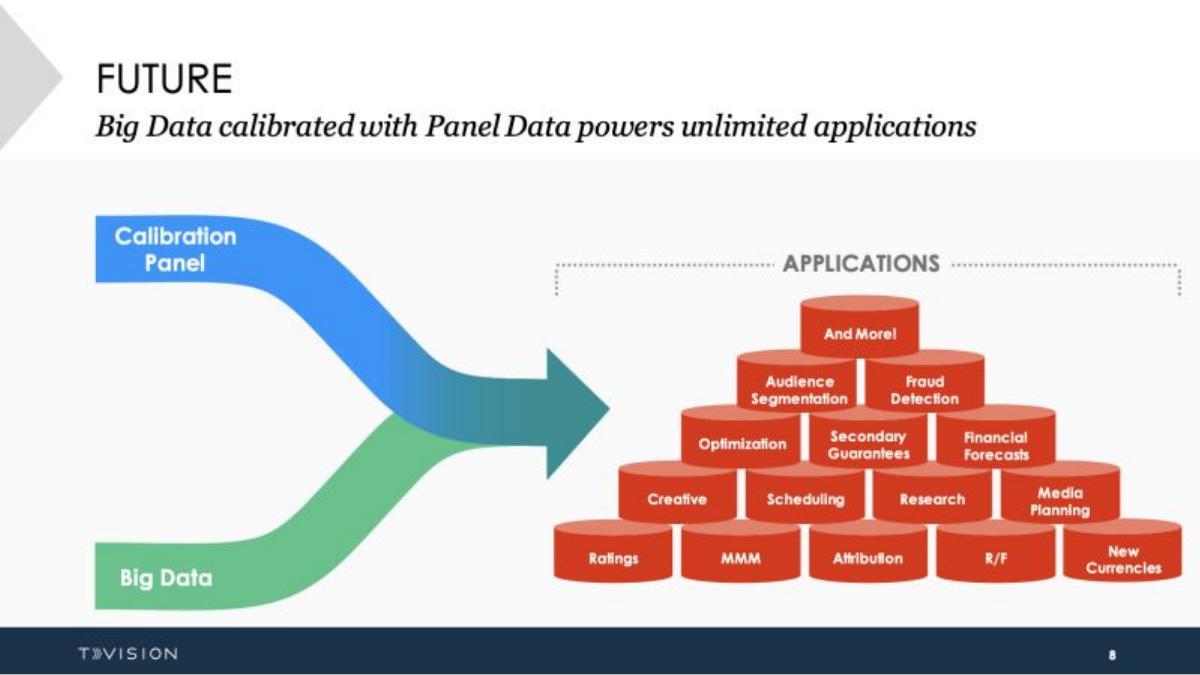
- TVision positions its proprietary panel as the 'calibration' layer that unlocks 'Big Data' for 15+ different applications (Slide 8).
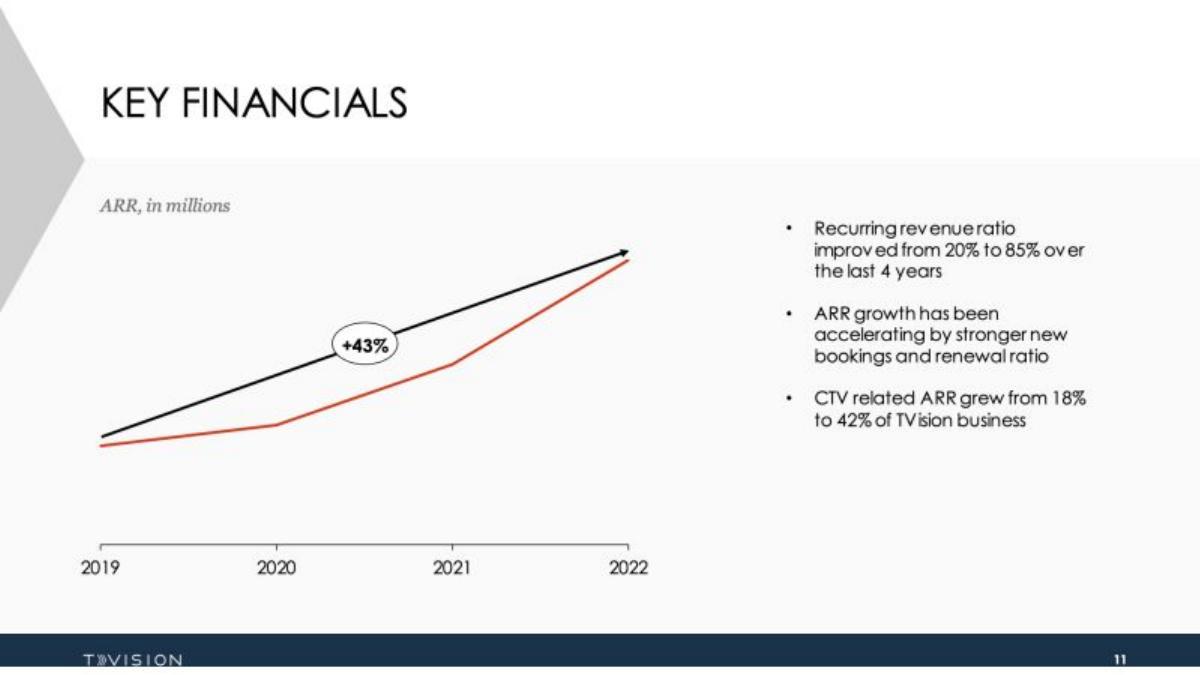
- Recurring revenue ratio improved significantly from 20% to 85% over a four-year period (Slide 11).
- Annual Recurring Revenue (ARR) grew by 43% year-over-year leading into 2022 (Slide 11).
- CTV-related ARR increased from 18% to 42% of the total business, showing successful product-market fit in new segments (Slide 11).
- The deck explicitly positions the company as a cheaper and easier-to-work-with alternative to Nielsen (Slide 12).
The Macro Shift: From Linear to Connected TV
TVision’s deck is built on a foundation of undeniable market shifts. By the time a company reaches Series C, the 'Problem' slide is often less about a niche pain point and more about a tectonic shift in the industry that the company is uniquely positioned to capture. TVision executes this by focusing on the decline of traditional television and the rise of digital alternatives.
Slide 2: Consumer Behavior Shift
Slide 2 sets the stage with a stark visual representation of time spent per day on video. In 1Q16, Linear TV dominated with 91% of consumer time. By 1Q22, that figure dropped to 53%, and the deck projects a further decline to 45% by 2024. The beneficiary of this shift is CTV (Connected TV), which grew from 4% to 36% in the same period, with a projected 45% share by 2024. This slide establishes the 'why now'—the market is in a state of rapid transition, and old measurement tools are becoming obsolete.
Slide 3: The CTV Ad Spend Boom
Following the consumer behavior shift, Slide 3 tracks the money. It shows Connected TV Ad Spending in the US growing from $6.42 billion in 2019 to a projected $29.50 billion in 2024. While the percentage change is shown to be slowing (from a peak of 59.9% in 2021 to 21.9% in 2024), the absolute dollar growth remains massive. This slide validates the total addressable market (TAM) for a measurement company specializing in this specific niche.
Aligning with Industry Standards
For a data company, credibility is everything. TVision uses the middle of its deck to prove that its methodology isn't just proprietary, but also compliant with what the largest advertisers in the world are asking for.
Slide 6: The WFA & ANA Framework
Slide 6 is a strategic 'appeal to authority.' It cites the World Federation of Advertisers (WFA) and the Association of National Advertisers (ANA) new framework for cross-media measurement. By listing core requirements like 'Panel + census data sets' and 'Person-level insights,' TVision is telling investors that the industry has already decided what the future looks like, and TVision is one of the few companies actually building to those specifications. This reduces the perceived risk of their technical approach.
The Data Calibration Strategy
The core of TVision's value proposition is how it handles data. They distinguish between 'Panel Data' and 'Big Data,' positioning themselves as the bridge between the two.
Slide 7 & 8: Today vs. Future
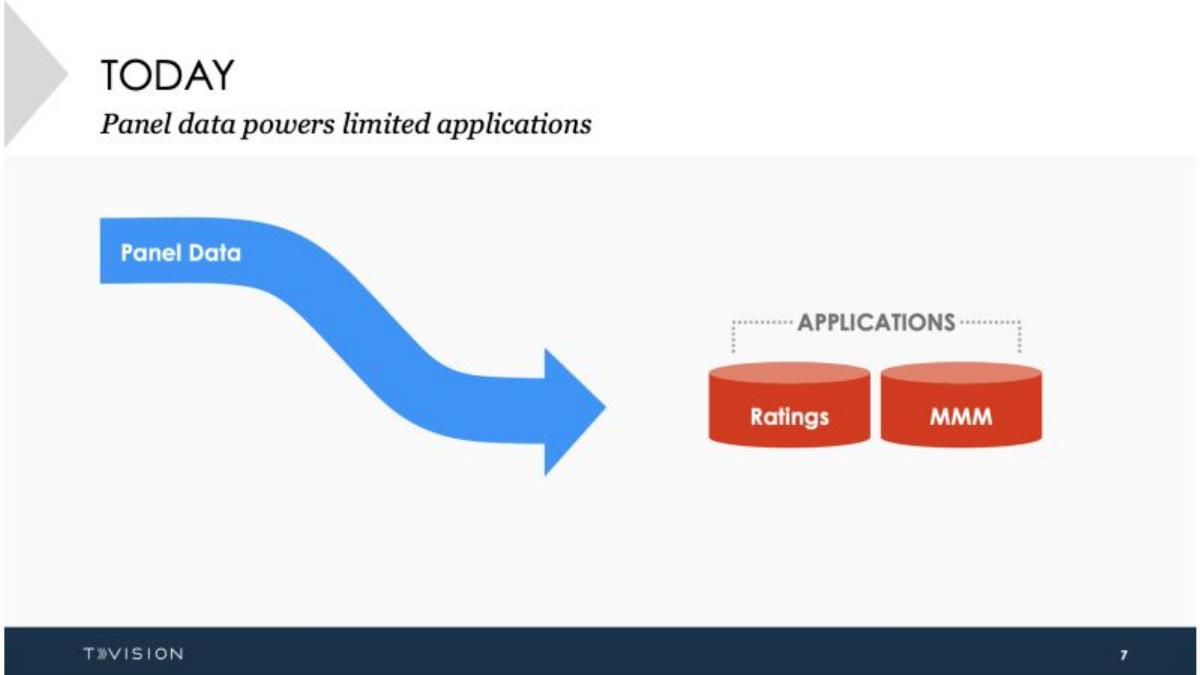
Slide 7 shows the current state: 'Panel data powers limited applications,' specifically Ratings and Marketing Mix Modeling (MMM). Slide 8 presents the 'Future,' where a 'Calibration Panel' (TVision) is combined with 'Big Data' to power a pyramid of 15+ applications. These include Audience Segmentation, Fraud Detection, Financial Forecasts, and Attribution. This is a classic 'land and expand' narrative—TVision starts with ratings but intends to become the data backbone for the entire advertising tech stack.
Financial Performance and Market Positioning
The final section of the deck focuses on the health of the business and its competitive stance against the industry incumbent.
Slide 11: Key Financials
This slide provides three critical metrics that justify a Series C valuation. First, the recurring revenue ratio improved from 20% to 85% over four years, signaling a successful transition to a SaaS model. Second, the company maintained a 43% ARR growth rate. Third, and perhaps most importantly for their narrative, CTV-related ARR grew from 18% to 42% of the business. This proves that TVision is not just a linear TV measurement company trying to survive; they are successfully capturing the growth market they identified on Slide 2.
Slide 12: Evolution and Competition
The final slide in this set explicitly names Nielsen. It positions TVision's panel as a 'cheaper' and 'easier to work with' alternative. It also claims that TVision is 'powering person-level measurement strategies for all significant Nielsen competitors.' This is a bold claim of market utility—if you aren't using Nielsen, you are likely using TVision to compete with them. The slide concludes by stating the company is well-positioned to 'capture future opportunity,' though it remains vague on what those specific opportunities are.
What is Missing from the Deck
As an 8-slide teardown of a larger deck, there are significant omissions that a founder should be aware of before using this as a template for a full pitch.
Team Slide: There is no mention of the founders or the executive team. At Series C, investors want to see a team capable of scaling a global data business. · The Ask: The deck does not state how much money is being raised (though the catalogue listing confirms $16M) or what the valuation expectations are. · Use of Funds: There is no breakdown of how the $16M will be spent—whether on R&D, sales expansion, or international growth. · Unit Economics: While ARR growth is shown, there is no mention of Customer Acquisition Cost (CAC), Lifetime Value (LTV), or churn rates, which are standard for SaaS teardowns. · Product Deep-Dive: The deck explains what the data does, but not how it is collected. For a 'proprietary panel,' the hardware or software used to track 'person-level' viewership is a key piece of the story left untold here.
What Founders Should Copy
Despite the omissions, TVision’s deck excels in its narrative clarity. Founders should take note of the following:
Trend Alignment: The deck doesn't just say 'we are growing.' It shows that the entire world is moving in their direction (Slides 2 and 3). · Regulatory/Industry Tailwinds: By citing the WFA and ANA (Slide 6), they make their success seem inevitable because the industry leaders are demanding exactly what they build. · Visualizing Data Utility: The transition from Slide 7 to Slide 8 is a perfect way to show how a product moves from a 'niche tool' to a 'platform.' · Metric Specificity: The financial slide (Slide 11) doesn't just show a line going up; it explains why (new bookings, renewal ratio) and where (CTV growth).
Frequently asked questions
- What is the primary market problem TVision addresses?
- TVision addresses the fragmentation of television viewership. As consumers move from linear TV to Connected TV (CTV), traditional measurement methods fail. Slide 2 shows linear TV time dropping from 91% to 45%, creating a gap that TVision fills with its proprietary person-level panel data, which provides the 'second-by-second' metrics that modern advertisers demand according to industry frameworks.
- How does TVision differentiate itself from competitors like Nielsen?
- TVision differentiates itself on two fronts: cost and ease of use. Slide 12 explicitly states that their panel is an 'alternative to Nielsen' that is 'cheaper and easier to work with.' Furthermore, they position their data as a calibration tool for 'Big Data,' allowing for a wider range of applications than traditional ratings, such as fraud detection and financial forecasting.
- What do the financials reveal about TVision's business model?
- The financials on Slide 11 indicate a successful transition to a SaaS model. The recurring revenue ratio jumped from 20% to 85% over four years. Additionally, the company is successfully capturing the CTV market, with CTV-related ARR growing from 18% to 42% of their total business, supported by a 43% overall ARR growth rate.
- What industry standards does TVision adhere to?
- TVision aligns its product strategy with the World Federation of Advertisers (WFA) and the Association of National Advertisers (ANA) framework. As shown on Slide 6, their solution meets core requirements including single-source panels, person-level insights, and second-by-second duration metrics, which are the new principles for cross-media measurement.
- What is missing from this pitch deck?
- This is a highly condensed 8-slide version of a Series C deck. It lacks several standard elements: a team slide, a detailed product demo, a competitive landscape (beyond the mention of Nielsen), a specific 'Ask' or valuation, and a slide detailing the use of the $16M raised. It functions more as a strategic overview than a full operational pitch.