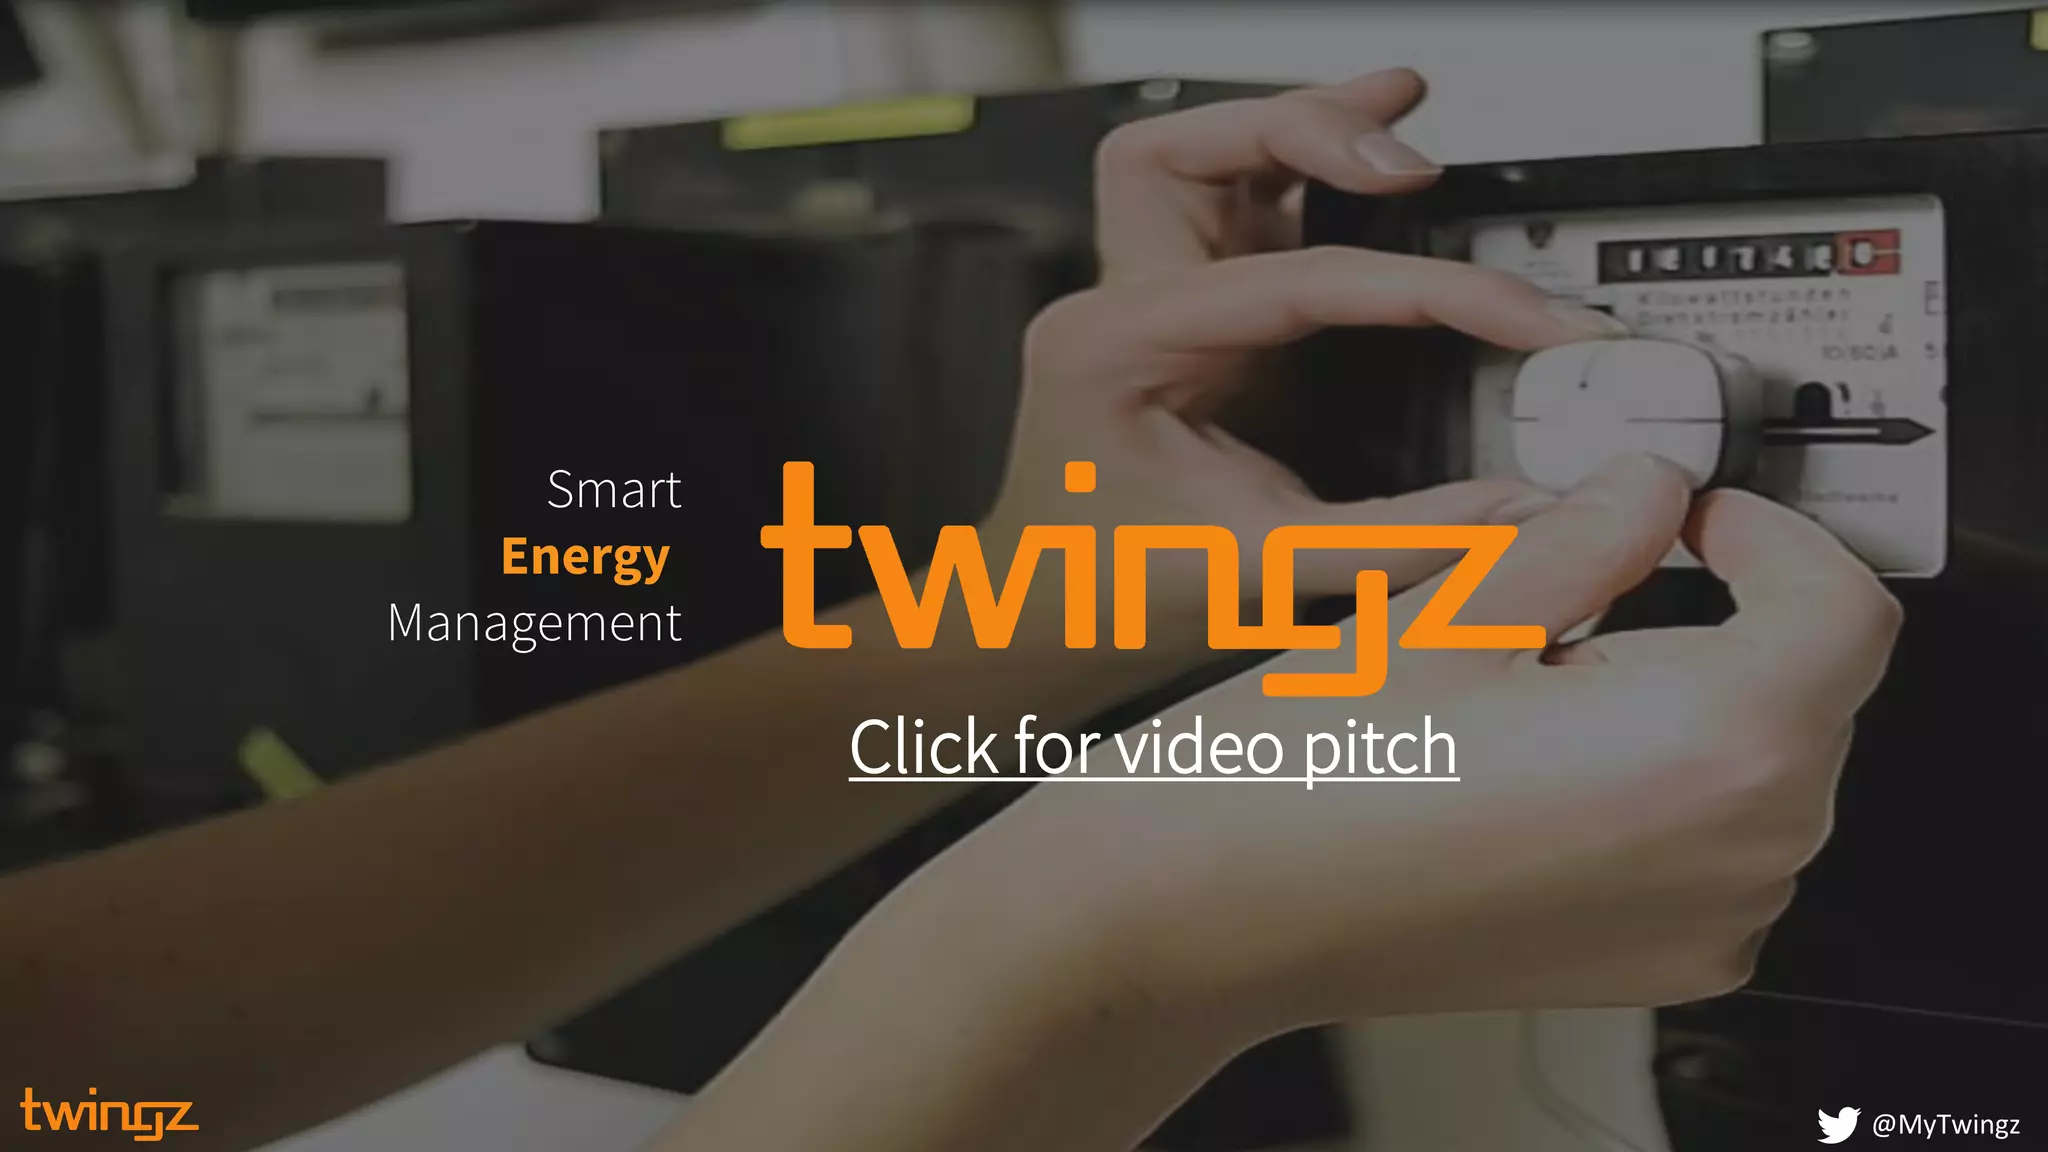
Twingz is a smart energy management startup that utilizes predictive analytics to bridge the gap between household consumption and utility-scale supply. The deck outlines a two-pronged strategy: providing consumers with 'eCoach' mobile tools for appliance-level monitoring and offering energy companies advanced forecasting dashboards to mitigate prediction errors. With €500k invested by founders and €335k previously raised, the company is seeking €1 million to capture a share of what they value as a €80 billion opportunity across 100 European energy companies. While the deck excels at visual s…
Key takeaways
- The company positions itself in the 'Smart Energy Management' sector, utilizing a video pitch link on the title slide (Slide 1).
- Twingz targets two distinct user groups: consumers via a mobile app and energy companies via a desktop analytics platform (Slide 5).
- The market opportunity is defined as €80 billion across 100 energy companies in Europe (Slide 6).
- The product offers 'appliance level accuracy' and 'user & activity profile' mapping, potentially in partnership with or comparison to 'geo GreenEnergyOptions' (Slide 7).
- Founders have committed €500k of their own capital to the venture (Slide 8).
- The company has previously raised €335k and is currently seeking a €1 million investment (Slide 8).
- The technical interface includes error quantification metrics like RMSE (Root Mean Square Error) for energy consumption forecasting (Slide 4).
- The deck lacks a dedicated team slide, business model details, or a roadmap in the provided 8-slide sequence.
Slide-by-Slide Analysis
Slide 1: Title and Vision
The opening slide establishes Twingz as a 'Smart Energy Management' company. The background image shows a hand placing a small, white circular device onto a traditional analog energy meter. This suggests a hardware-enabled software solution designed to retrofit existing infrastructure. A prominent 'Click for video pitch' call to action indicates this deck was likely intended for digital distribution or asynchronous viewing.
Slide 2: The Consumer Interface
This slide introduces the 'eCoach' app icon on a smartphone mockup, set against a lifestyle photo of a family. To the right, a circular icon depicts a stylized lock or a sensor unit, possibly representing the hardware device shown in Slide 1. The focus here is clearly on the residential user experience and the 'peace of mind' or 'family safety' aspect of energy monitoring.
Slide 3: Macro Energy Forecasting
The deck shifts from the home to the grid. A bar chart is overlaid on an image of a power plant, showing energy consumption/production cycles for 'Thursday' and 'Friday.' The 'now' marker indicates real-time tracking. This slide visualizes the volatility of energy demand that the company aims to solve.
Slide 4: Technical Validation and Data Science
This slide displays a complex desktop dashboard titled 'TSM Visuals - Forecast Quality Check.' It includes specific data science metrics such as 'RMSE' (Root Mean Square Error), 'MAPE %', and 'Mean Abs Error.' A 'Prediction vs Reference' graph shows a 'Consumption Forecast' (orange line) tracking against actual 'Consumption' (black line). A 'High RMSE!' warning box highlights a period where the forecast deviated significantly from reality, demonstrating the problem Twingz's analytics are designed to identify and correct.
Slide 5: The Dual-Sided Platform
Twingz explicitly defines its two target segments here. On the left, 'Consumers' are shown using a mobile app that features an appliance-level breakdown (pie chart). On the right, 'Energy companies' are shown using a desktop analytics tool. This slide bridges the gap between granular home data and utility-scale forecasting, suggesting that consumer data feeds the utility's predictive models.
Slide 6: Market Opportunity
The company quantifies its target market within Europe. It identifies '100 Companies' (likely Tier 1 and Tier 2 utilities) and an '€80B Opportunity.' The use of the Euro symbol and the map of Europe confirms the regional focus. However, the deck does not specify how the €80B figure was calculated (e.g., total energy spend vs. addressable software market).
Slide 7: Competitive Advantage and Partnerships
This slide highlights 'appliance level accuracy' and 'user & activity profile' as core strengths. The logo for 'geo GreenEnergyOptions' appears in the top right. Without further context, this suggests either a strategic partnership, a hardware integration, or a direct competitive comparison. The Twingz logo is centered, positioning the company as the primary intelligence layer.
Slide 8: The Ask and Financials
The final slide in this sequence, titled 'Investing in our Future,' provides a transparent look at the company's funding. It lists €500k from 'Founders,' €335k 'Raised' to date, and a current 'Raising' target of €1M. The background image of children and a horse reinforces the 'future' theme but lacks professional financial context. The presence of the @MyTwingz Twitter handle suggests an active social media presence at the time of the deck's creation.
What Twingz Does Well
Clear Segmentation: The deck does an excellent job of showing that the product serves two distinct masters. By showing the mobile app for consumers and the dashboard for utilities, Twingz demonstrates a 'B2B2C' or 'B2B + B2C' strategy that creates a data loop. The consumer gets insights, and the utility gets better forecasting data.
Technical Credibility: Slide 4 is crucial. By showing actual error metrics like RMSE and MAPE, the founders are speaking the language of utility data scientists. It moves the conversation beyond 'we have an app' to 'we have a predictive engine that understands forecasting error.'
Skin in the Game: Disclosing that the founders have invested €500k of their own money is a strong signal to investors. It demonstrates high conviction and significant personal risk, which can be a persuasive factor in early-stage fundraising.
What is Missing from the Deck
The Team: In the provided 8-slide sequence, there is no team slide. For a data-heavy energy startup, investors need to see the pedigree of the data scientists and the industry experience of the founders. Without this, the technical claims in Slide 4 lack a human anchor.
Business Model: While the market is sized at €80B, the deck does not explain how Twingz makes money. Is it a SaaS fee for utilities? A hardware sale to consumers? A data licensing model? The path to revenue is entirely omitted.
Technology Deep-Dive: The deck claims 'appliance level accuracy' but doesn't explain how it achieves this without intrusive hardware on every toaster and fridge. If they are using NILM (Non-Intrusive Load Monitoring), they should state it, as this is a highly competitive and technically challenging field.
Competitive Landscape: The energy management space is crowded with players like Smappee, Sense, and Bidgely. The deck mentions 'geo' but doesn't provide a competitive matrix or a 'why we win' slide.
Founder Takeaways
Use Data to Prove the Problem: Twingz's use of a 'High RMSE!' warning in their dashboard slide is a clever way to visualize the 'pain' their customer feels. Founders should look for ways to visually represent the failure of current systems rather than just describing them in text.
Quantify Founder Commitment: If you have self-funded a significant portion of your startup, put it on the slide. It differentiates you from founders who are only playing with 'other people's money' and shows a level of commitment that is highly valued in the seed and Series A stages.
Bridge the Micro and Macro: If your product collects data at the individual level to solve a problem at the industrial level, make that connection explicit. Twingz does this well by showing the family on one side and the power plant on the other, linked by their analytics engine.
Frequently asked questions
- What is the primary value proposition for energy companies?
- Based on Slide 4 and Slide 5, Twingz provides energy companies with a desktop-based forecasting tool. The interface shows 'Prediction vs Reference' data and quantifies errors using metrics like RMSE. This suggests the platform helps utilities reduce the financial and operational costs associated with inaccurate energy demand forecasting by providing more granular data from the consumer level.
- How does the consumer-facing product work?
- The consumer product, branded as 'eCoach' on Slide 2, is a mobile application. Slide 5 shows a pie chart within the app that breaks down energy usage by specific appliances, including the dishwasher, electric oven, fridge, microwave, washing machine, and heat pump. This allows residents to see exactly which devices are driving their energy costs.
- What is the total capital history of Twingz according to the deck?
- Slide 8 details a three-part capital structure: the founders have invested €500k, the company has already raised €335k from external sources, and they are currently in the market for an additional €1 million. This indicates a total project capitalization of €1.835 million if the current round is successful.
- What geographic market is Twingz targeting?
- Slide 6 features a map of Europe highlighted in grey, accompanied by the figures '100 Companies' and '€80B Opportunity.' This indicates a clear focus on the European utility market rather than a global or North American launch strategy.
- Does the deck explain the technology behind appliance detection?
- Slide 7 mentions 'appliance level accuracy' and 'user & activity profile,' but the provided slides do not detail the underlying technology. It is unclear if Twingz uses Non-Intrusive Load Monitoring (NILM) software, hardware sensors, or a combination of both, though Slide 1 shows a hand interacting with a physical meter-like device.