The Twitter IPO deck, used in late 2013, represents a pivotal moment in social media history where the narrative shifted from simple 'blogging' to a global, real-time information utility. The deck highlights a massive scale of 230 million monthly active users (Slide 6) and a staggering 1 billion tweets created every two days (Slide 9). Rather than competing directly with Facebook on social graphs, Twitter positioned itself as a 'distributed' platform where 44% of Americans heard about tweets through other media channels daily (Slide 21). The financial narrative focused on mobile-native ad for…
Key takeaways
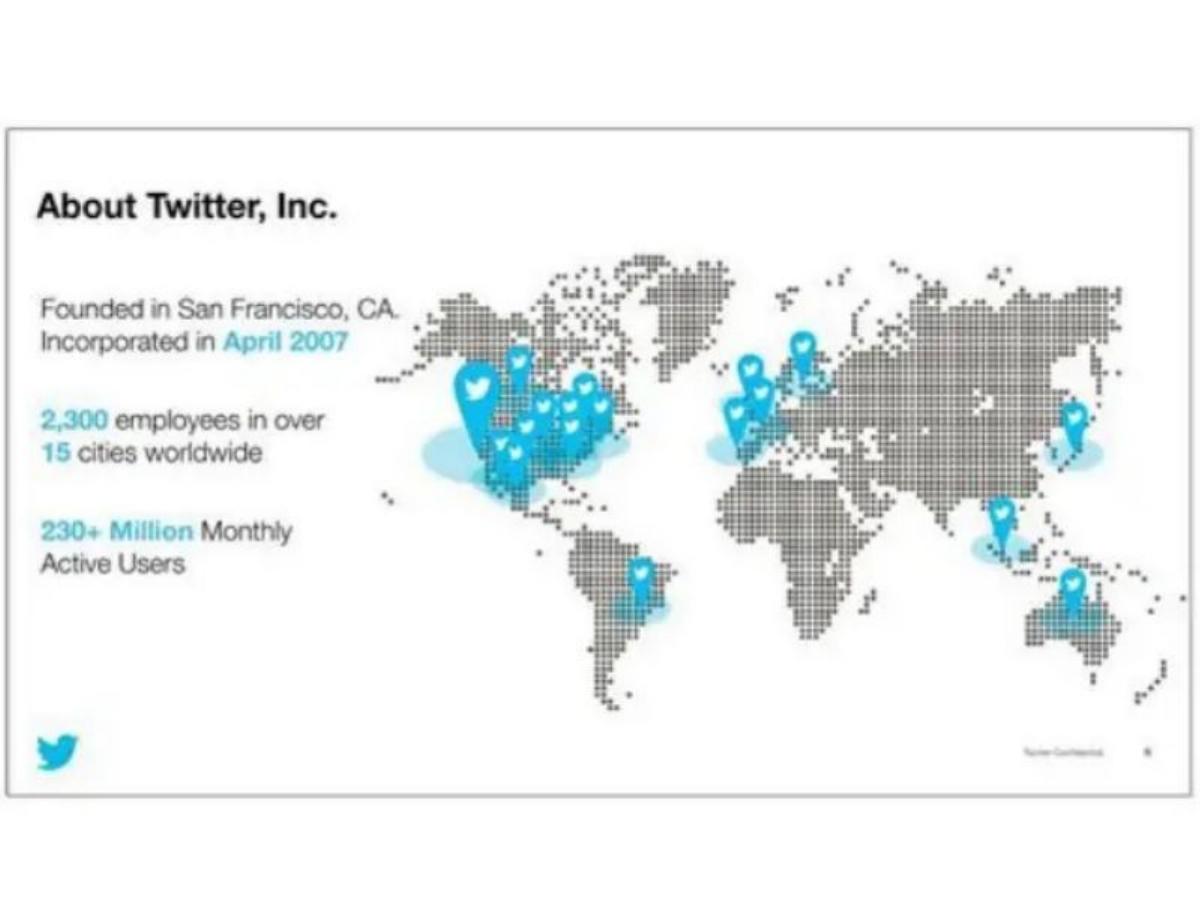
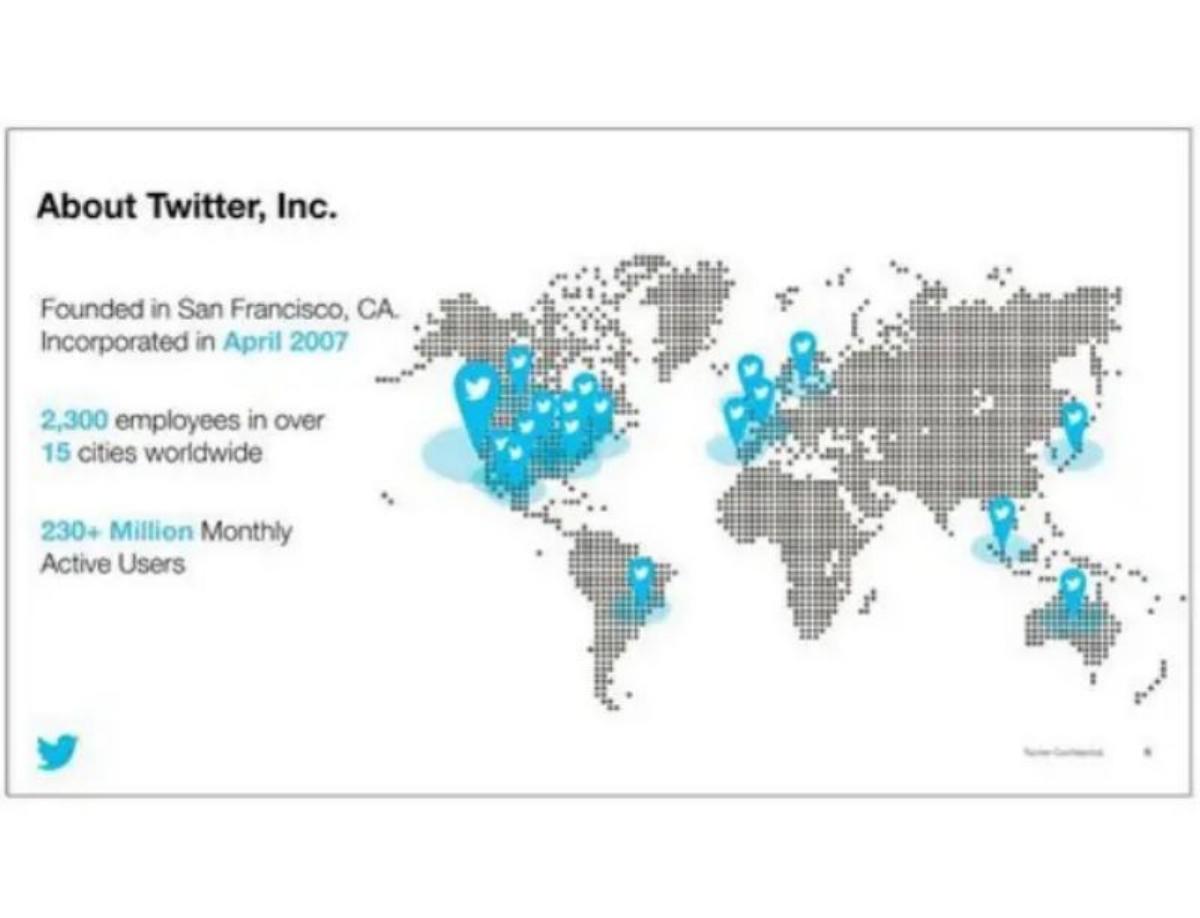
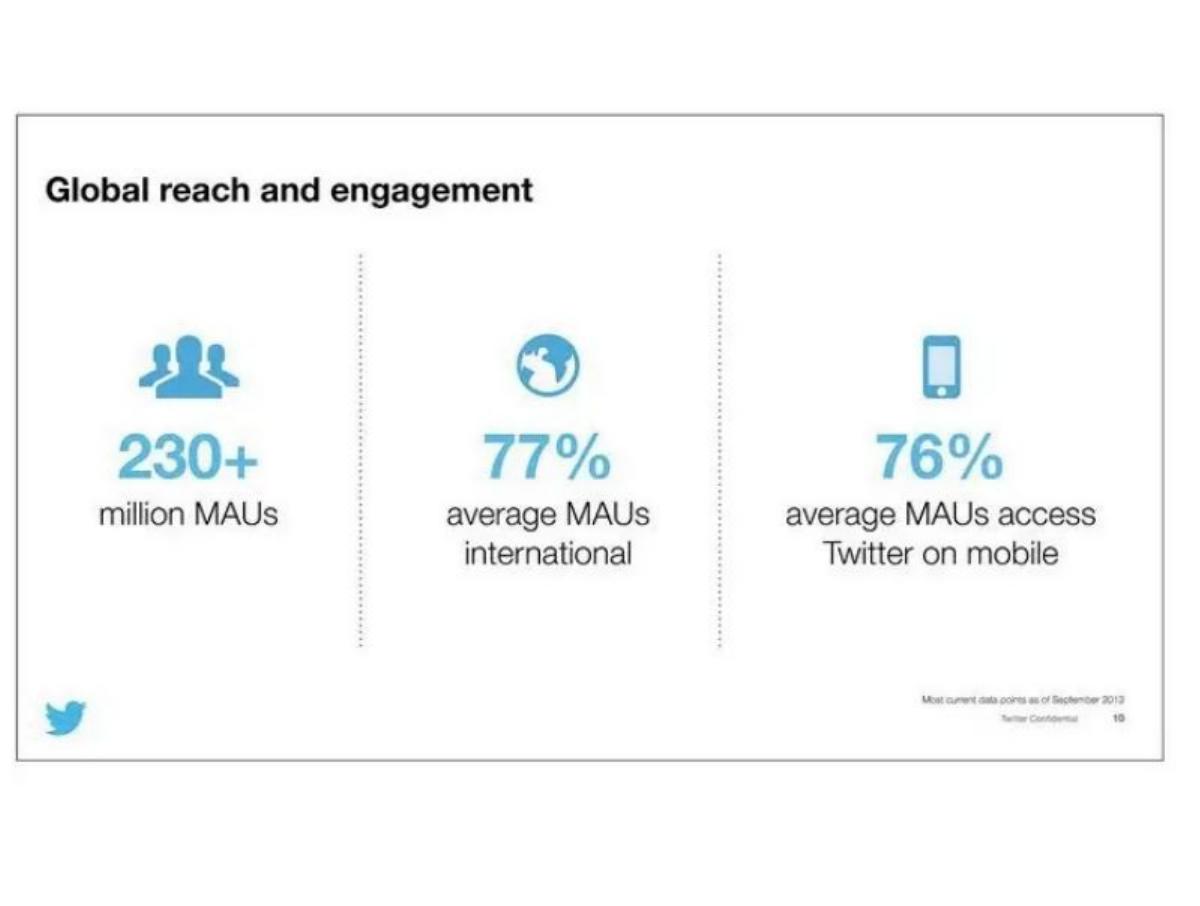
- Twitter reported 230+ million Monthly Active Users and 2,300 employees across 15 cities at the time of the IPO (Slide 6).
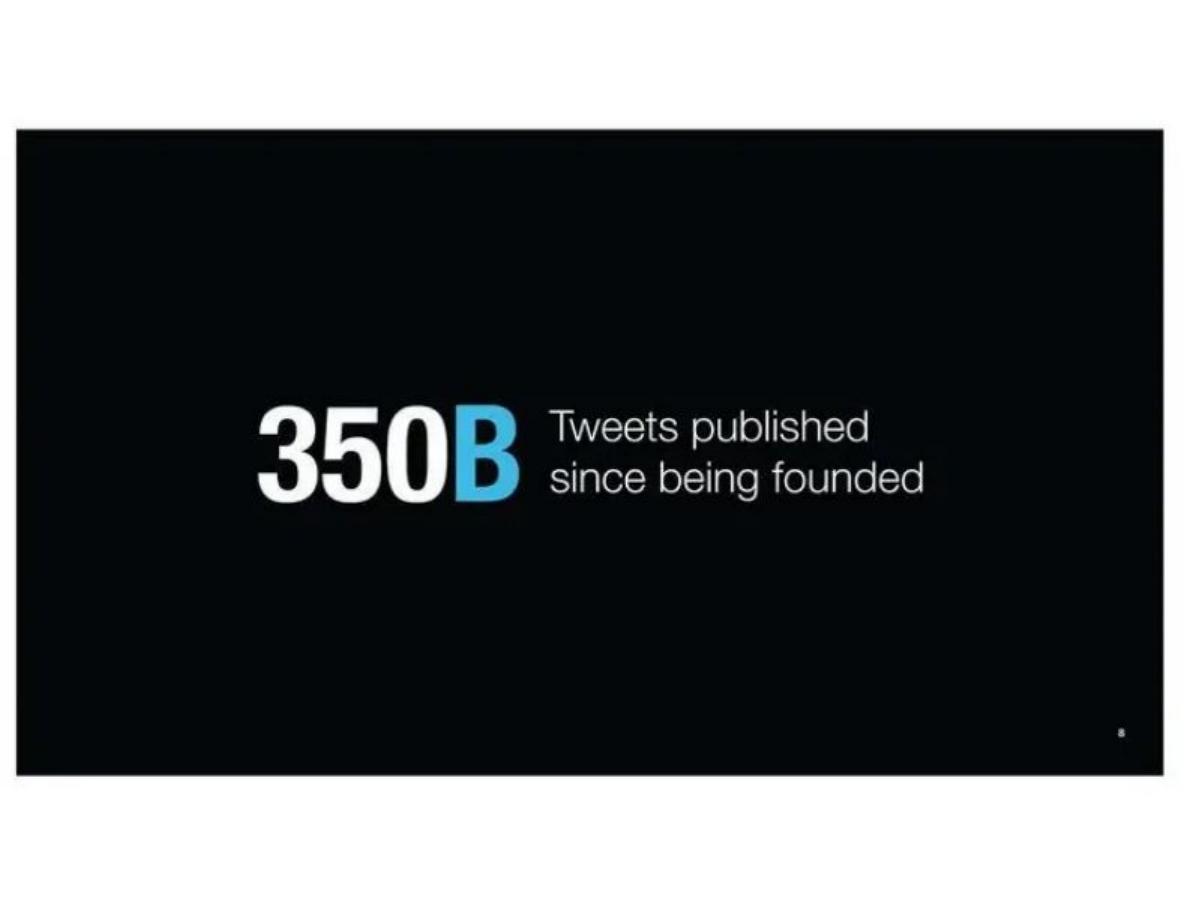
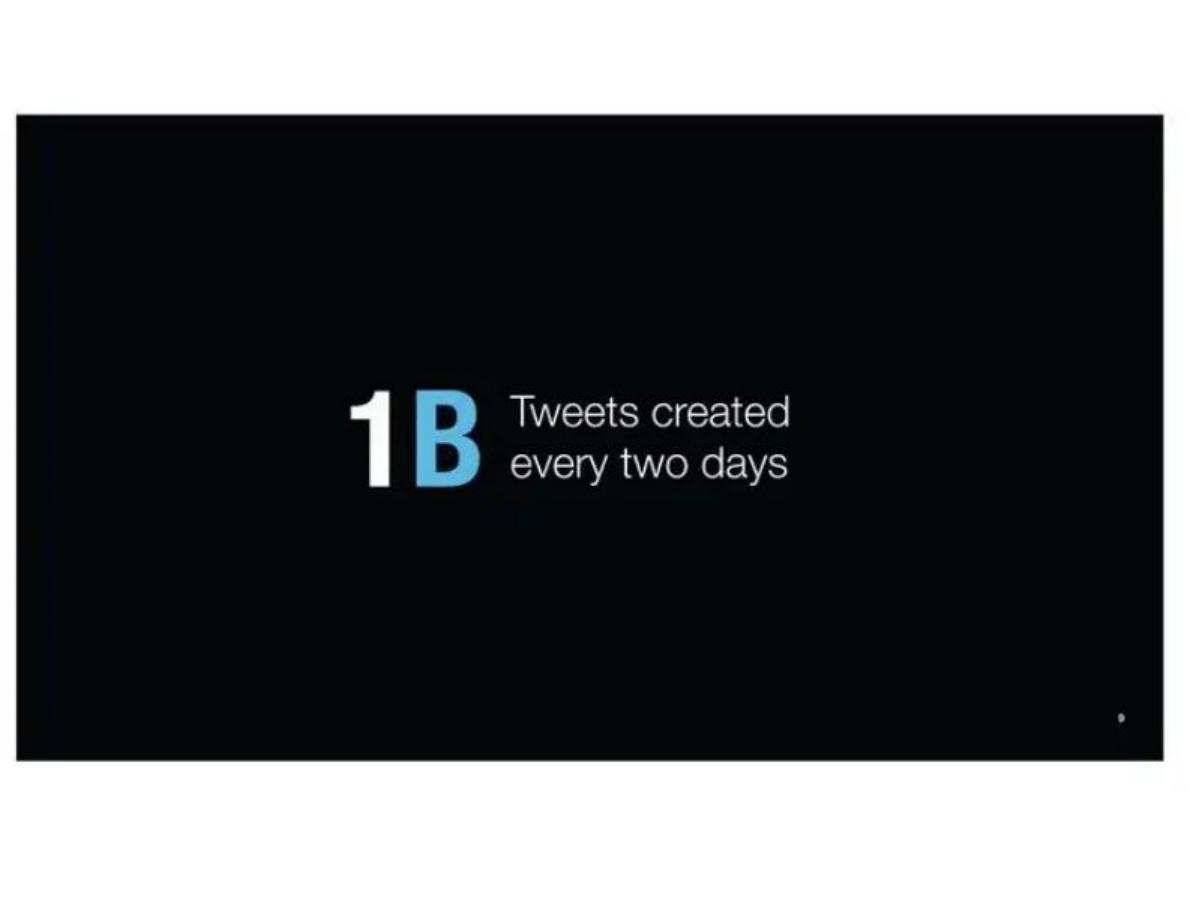
- The platform's velocity was defined by the creation of 1 billion tweets every two days (Slide 9).
- Twitter positioned itself as a 'personal broadcast network,' using high-profile examples from Carl Icahn and Clarence House to demonstrate influence (Slide 12).
- The deck emphasizes 'distributed' reach, noting that 44% of Americans hear about tweets through other media channels almost every day (Slide 21).
- A strategic partnership with Nielsen was highlighted to establish Twitter as the 'new standard for TV engagement' (Slide 36).
- Monetization was nascent but growing, with Q3 2013 ad revenue at $0.97 per 1,000 timeline views (Slide 55).
- Timeline views reached 159 billion in Q3 2013, a 50% year-over-year increase (Slide 58).
- Operational expenses nearly doubled from $161 million in 2012 to $320 million in the first nine months of 2013 (Slide 64).
The Road to $1.8 Billion: Analyzing the Twitter IPO Deck
In November 2013, Twitter went public in one of the most anticipated tech IPOs of the decade. The deck used for this roadshow is a fascinating artifact because it doesn't just sell a company; it sells a new behavior. By 2013, Twitter had moved past the 'what I had for breakfast' phase and was positioning itself as the global nervous system. The deck focuses on three pillars: reach, engagement, and monetization. With 230 million monthly active users (MAUs), the company had to prove to Wall Street that it could turn cultural relevance into a sustainable B2B advertising powerhouse.
Slides 6-9: The Scale of the Global Nervous System
Twitter opens with its 'About' slide (Slide 6), establishing immediate credibility through scale. Founded in 2006 and incorporated in 2007, the company had grown to 2,300 employees across 15 cities. The headline metric here is 230+ Million Monthly Active Users . This is followed by Slide 9, a high-impact 'big number' slide stating 1B Tweets created every two days . This slide is intended to show velocity. For an IPO investor, the sheer volume of data being generated is a proxy for the platform's stickiness and its potential for data mining and ad targeting.
Slides 12-15: Defining the Product as a Public Utility
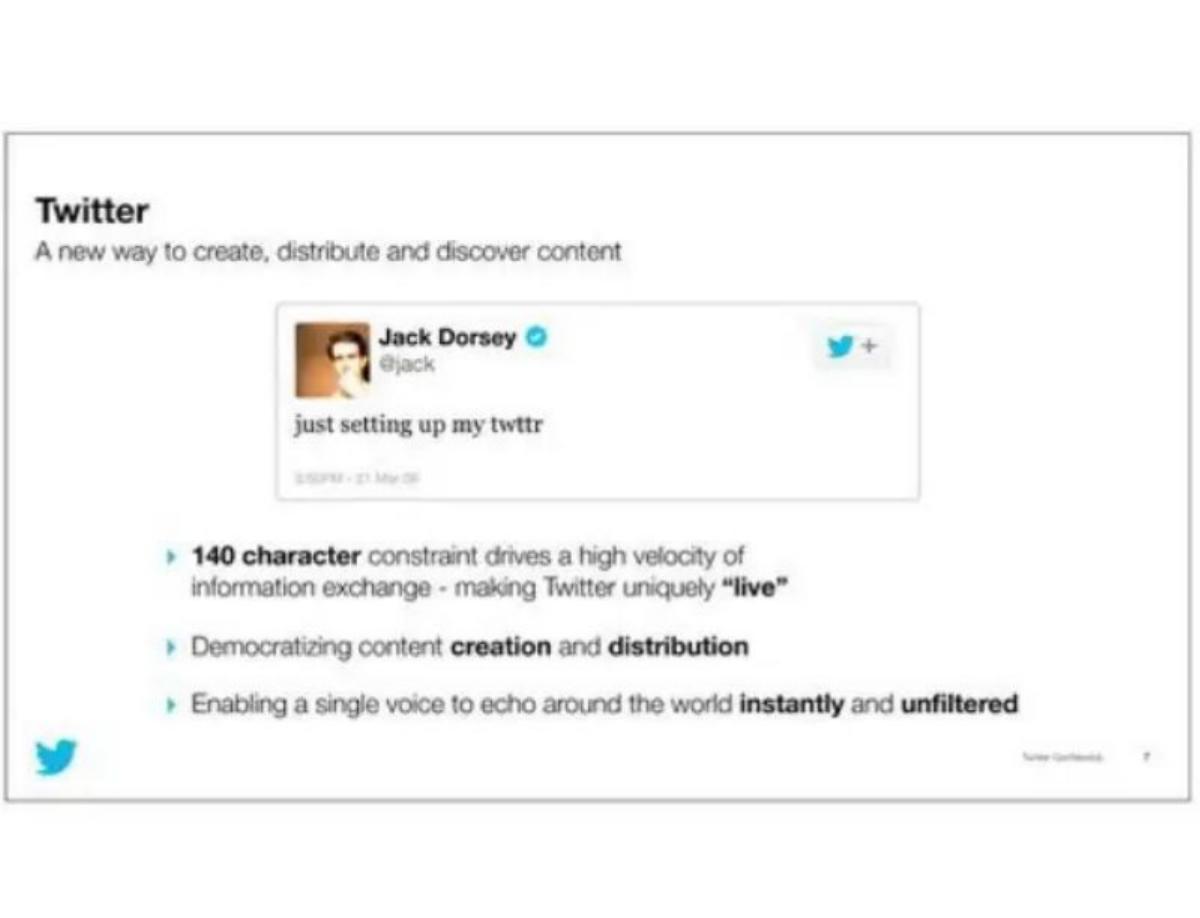
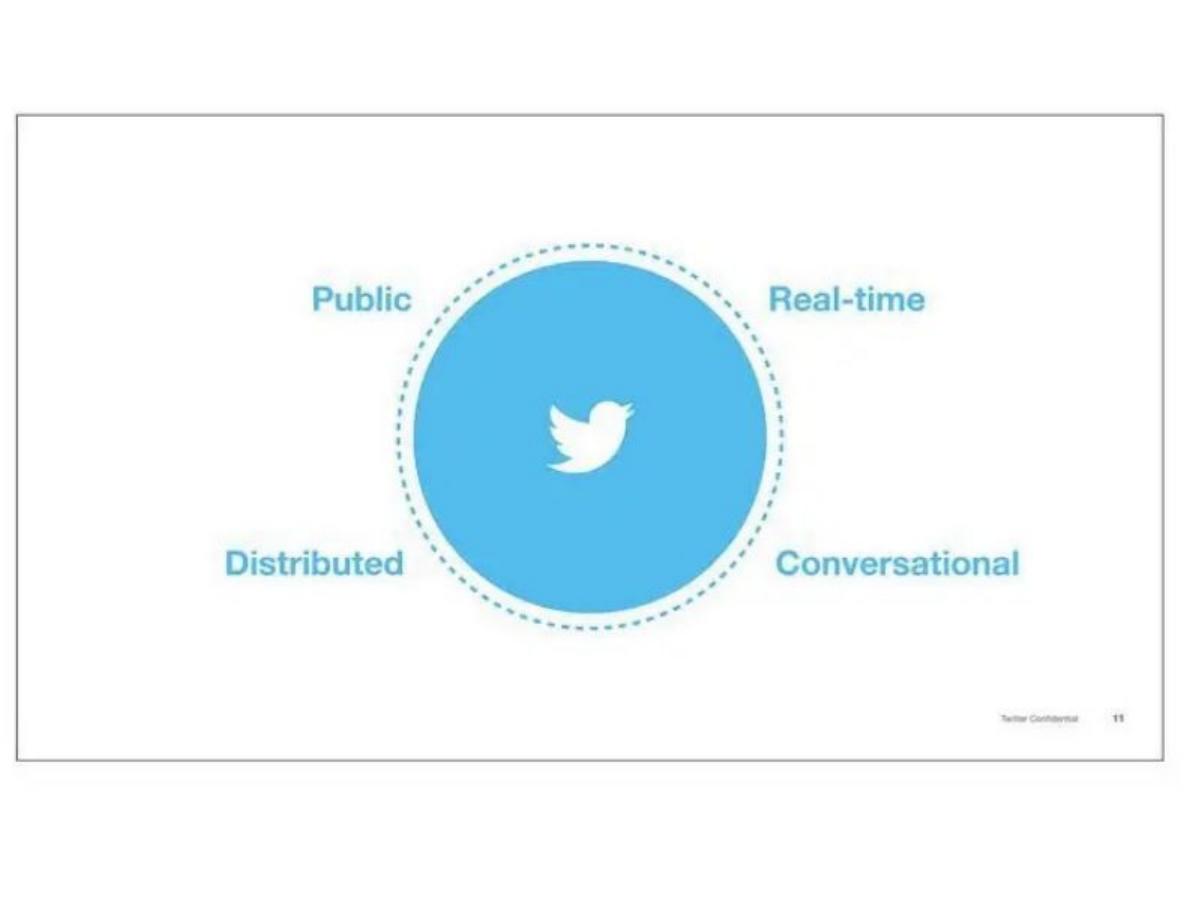
Twitter differentiates itself from competitors by using the hashtag #Public . Slide 12 describes the platform as a 'personal broadcast network.' It uses screenshots of tweets from diverse sources: athlete Drew Brees, activist investor Carl Icahn, and the British Royal Family (Clarence House). This selection is deliberate; it shows that Twitter is the place where news breaks across sports, finance, and global politics. Slide 15 introduces #Conversational , highlighting 'unique user-to-user interaction' through a thread involving chef Mario Batali. This establishes that Twitter isn't just a one-way broadcast; it is a multi-directional dialogue between celebrities and the public.
Slides 18-21: The Power of Distribution
One of the most unique arguments in this deck is found on Slide 18: #Distributed: Tweets go everywhere . It shows Barack Obama’s 'Four more years' tweet on an NBC news broadcast. This leads to the powerful statistic on Slide 21: 44% of Americans hear about Tweets through media channels other than Twitter almost every day . This is a brilliant defensive maneuver. It suggests that even if a person isn't a registered user, they are still consuming Twitter content. This 'off-platform' reach is a value proposition that few other social networks could claim at the time.
Slides 24-30: Value Propositions and Platform Partners
Slide 24 focuses on the user value proposition, showing a tweet about voting in Kenya. This frames Twitter as a tool for democracy and real-time information. Slide 27 and 30 shift to 'Platform Partners.' Slide 30 introduces Twitter Cards , which allowed for 'enhanced content' like media summaries from The New York Times and in-tweet video from Lowe’s. This was the technical foundation for making the feed more than just 140 characters, turning it into a rich media canvas for publishers and advertisers.
Slides 33-36: The TV Connection
Twitter leans heavily into its role as the 'second screen.' Slide 33 shows a graph of 'Live reach,' illustrating how engagement spikes during a show or event and tapers off afterward. Slide 36 is the 'killer' slide for media investors: TV x Twitter: A new standard for TV Engagement . By showcasing the Nielsen Twitter TV Ratings , Twitter proved it had a measurable impact on television viewership. The slide lists programs like Breaking Bad (1.2 million tweets) and The Voice, positioning Twitter as an essential partner for the multi-billion dollar TV ad industry.
Slides 39-42: The Ad Engine
The monetization strategy is detailed starting on Slide 39, which highlights Ad formats native to mobile experience . This was crucial in 2013, as the 'mobile shift' was the primary concern for tech investors. The deck shows Promoted Tweets, Promoted Accounts, and Promoted Trends. Slide 42 lists the targeting capabilities: Keywords, Interests, TV ads, Device, Followers, Look-a-likes, Search, Location, and Gender . This was Twitter's way of saying their ad tech was as sophisticated as Facebook's or Google's, despite the different nature of their data.
Slides 45-48: Growth Vectors
Slide 45 identifies three key growth vectors: Users, Platform partners, and Advertisers . Slide 48 expands on the advertiser opportunity, specifically mentioning the expansion of self-serve platforms to attract SMBs (Small and Medium Businesses) and the use of MoPub for real-time bidding. The funnel on the right side of Slide 48—Awareness, Message Association, Brand Favorability, and Direct Action—shows that Twitter intended to capture the entire marketing budget, not just 'top of funnel' brand awareness.
Slides 52-61: The Financials
The deck transitions to the CFO, Mike Gupta (Slide 52). Slide 55 summarizes the Key metrics for Q3 2013 : 230+ Million MAUs, 685 Timeline Views per MAU, and $0.97 Ad Revenue per 1,000 Timeline Views . Slide 58 shows the growth in Timeline Views, which hit 159 billion in Q3 2013, a 50% year-over-year increase. Slide 61 provides a visual of the ad products in action, emphasizing 'Pay for performance,' which was a key selling point for performance-oriented marketers.
Slides 64-71: Investing and Reconciliation
The final data slides show the cost of growth. Slide 64, Investing against the opportunity , shows that 9-month Opex rose from $161 million in 2012 to $320 million in 2013. Capex also increased from $120 million to $142 million. This demonstrated that the company was aggressively reinvesting its capital into infrastructure and R&D. Finally, Slide 71 provides a Non-GAAP reconciliation , a standard requirement for IPO decks to help investors understand the 'real' earnings by stripping out stock-based compensation and amortization of acquired assets.
What Twitter's IPO Deck Does Well
The deck is exceptionally strong at narrative positioning . By calling itself a 'distributed' and 'public' network, Twitter avoided being compared directly to Facebook's 'friends and family' model, which was much larger at the time. It successfully argued that Twitter was a different kind of beast—a media utility rather than just a social network. The inclusion of the Nielsen data was a masterstroke, as it tied Twitter's success to the existing, massive television advertising market.
What is Missing from the Twitter IPO Deck
Notably absent is a Competitor Slide . In an IPO context, this is common, as the 'Risk Factors' section of the S-1 filing handles the competitive landscape. However, for a startup founder, omitting competitors is usually a mistake. Twitter also glosses over User Retention . While it shows MAU growth, it doesn't show cohorts or churn, which later became a major point of contention for the company. Finally, there is no Unit Economics slide (like LTV/CAC), which is typical for high-growth social platforms of that era but would be expected in today's more disciplined market.
Founder Lessons: What to Copy
The 'Big Number' Slide: Slide 9 (1B tweets every two days) is a perfect example of how to use a single, undeniable stat to prove product-market fit and scale. · Third-Party Validation: Using the Nielsen partnership (Slide 36) to prove the value of the platform is much more effective than the company simply claiming it is valuable. · Native Visualization: Showing the ads exactly as they appear in the mobile feed (Slide 39) helps investors visualize the product and the revenue stream simultaneously. · The 'Off-Platform' Argument: If your product has influence beyond its direct users (like Twitter's 44% media reach on Slide 21), make sure to quantify it. It expands your perceived TAM (Total Addressable Market).
Frequently asked questions
- What was Twitter's primary growth metric in 2013?
- Twitter focused heavily on 'Timeline Views.' Slide 58 shows that total timeline views grew 50% year-over-year, reaching 159 billion in Q3 2013. They also tracked 'Timeline Views per MAU,' which grew 8% to 685 in the same period. This indicated that not only was the user base growing, but existing users were consuming significantly more content.
- How did Twitter differentiate itself from other social networks?
- Twitter used the term 'Distributed' (Slide 18) and 'Personal Broadcast Network' (Slide 12). Unlike private social networks, Twitter highlighted that its content 'goes everywhere,' citing that 44% of Americans hear about tweets on other media daily (Slide 21). This positioned Twitter as a top-of-funnel information source rather than a closed social loop.
- What was the core of Twitter's monetization strategy?
- The strategy relied on 'native' mobile ad formats. Slide 39 shows Promoted Tweets, Accounts, and Trends integrated directly into the user experience. Slide 48 outlines a growth plan targeting SMBs and brand advertisers through self-serve platforms and real-time bidding, aiming to move beyond simple awareness to 'Direct Action.'
- How did Twitter link its platform to traditional television?
- Twitter explicitly branded itself as the 'new standard for TV engagement' on Slide 36. By showcasing a 'Nielsen Twitter TV Rating' leaderboard (where Breaking Bad held the #1 spot with 129 million impressions), they argued that Twitter was the essential companion for live broadcast, making it a 'must-buy' for TV advertisers.
- What were the financial risks shown in the deck?
- The deck shows a significant ramp-up in spending. Slide 64 reveals that 9-month operating expenses jumped from $161 million in 2012 to $320 million in 2013. While revenue was growing, the cost of scaling the infrastructure and global workforce (2,300 employees) was substantial, requiring the $1.8 billion IPO capital.