Sales Pipeline on a Pitch Deck: What a Pipeline Number
How founders put a sales pipeline figure on a pitch deck: stages, probability weighting, what counts as qualified.
How to Show Your Sales Pipeline on a Pitch Deck So Investors Can Judge It
Twelve slides from real pitch decks that put a pipeline figure in front of investors. For each, we record what the slide states, what it leaves undefined, and whether its own numbers add up.
TL;DR
A pipeline figure is the value of deals a company is working on but has not closed. On a pitch deck it signals demand, but it is the least certain number on a traction slide: most pipeline never closes. It earns trust when the slide says what counts as pipeline (qualified by what test), breaks it into stages, says whether the figure is the full contract value or weighted by the chance of closing, states the period the deals would close in, and sets it beside revenue already closed.
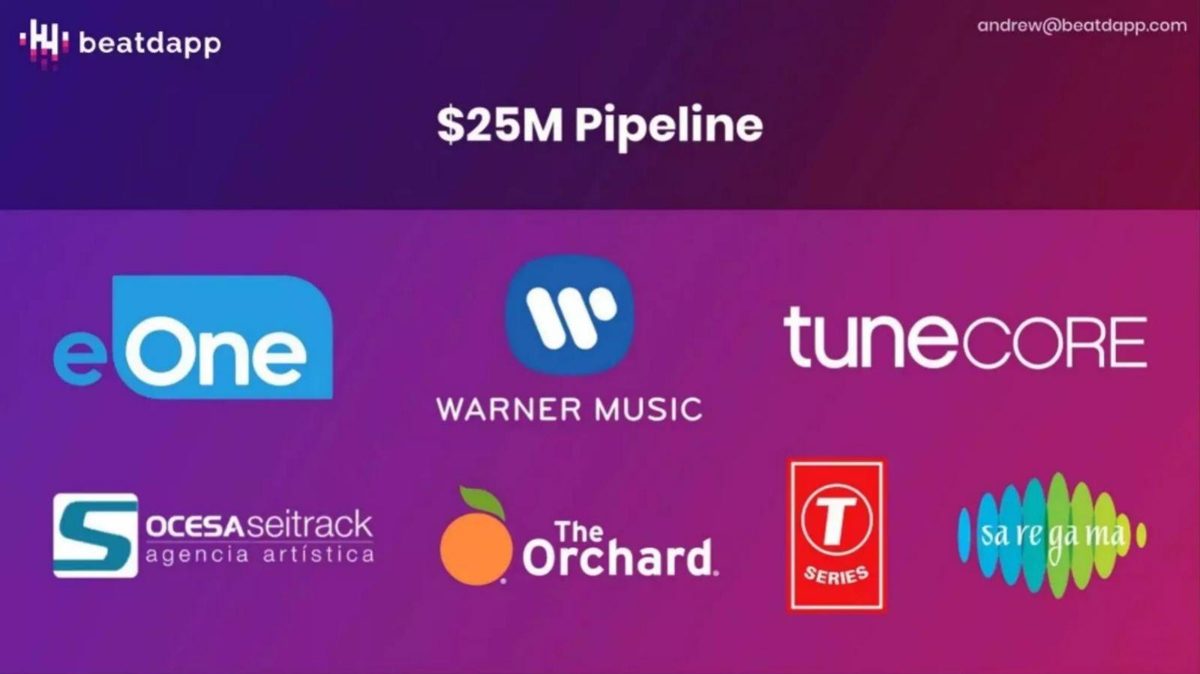
In this set, Venn and Twentyeight Health come closest: Venn lists deals, units and ARR for each of five stages, and Twentyeight Health counts deals by stage and reports a probability-adjusted total. Even these do not fully reconcile. Venn's stage rows add up to 123 deals against the 110 in its headline (our count), and Twentyeight Health's bars add up to 76 against its stated 75. Most other slides give a single headline figure, such as Beatdapp's "$25M Pipeline" above a row of logos, which a reader cannot test at all.
Sales pipeline slides from real pitch decks
Each example shows the exact page from the original public deck above its analysis and links to the full teardown. Figures are the companies' own and have not been verified. Calculations are ours and are labelled. Page numbers are PDF pages.
Venn traction slide — slide 21
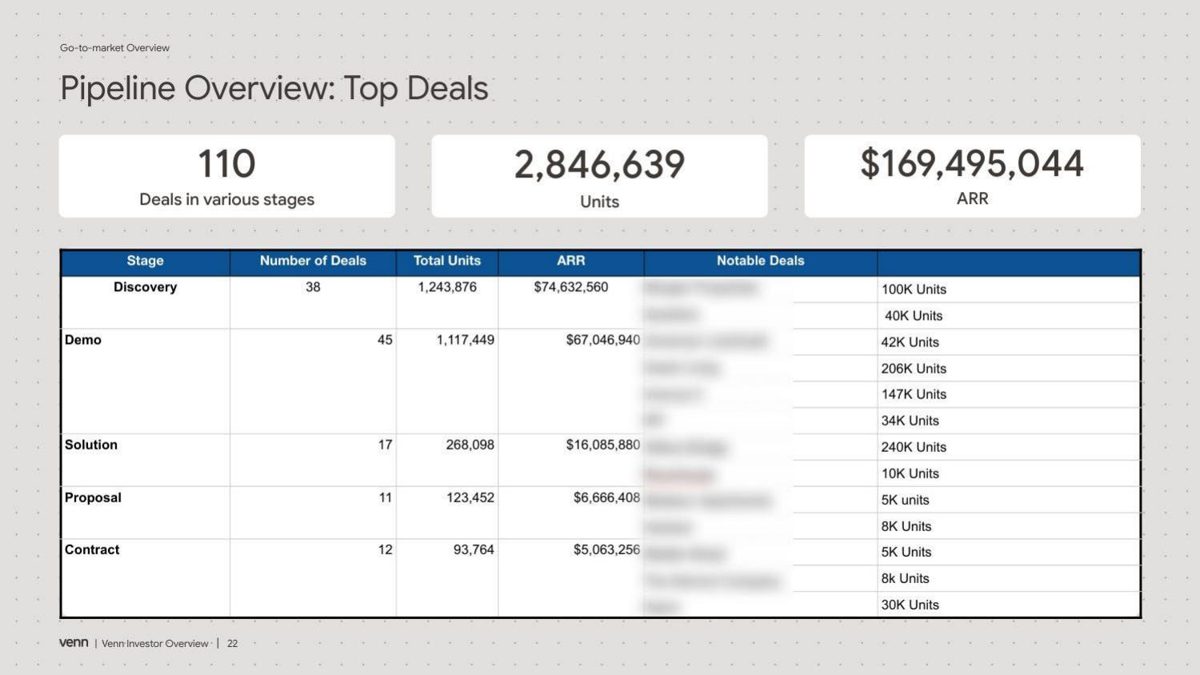
"Pipeline Overview: Top Deals" in the go-to-market section of a 26-page investor overview. Deal names are blurred in the public copy.
Venn deck, slide 21. Exact stored slide matched to this analysis.
Our analysis: Every headline figure is split by stage, and the units and ARR rows add up exactly to the totals (our calculation), so a reader can see that about 84% of the value is in the two earliest stages.
Evidence and limitation: The deal counts in the rows add up to 123, not the 110 in the headline (our count); explain overlaps or update the headline.
What a founder can adapt: Add the price per unit used (the rows imply $60 early and $54 at Proposal and Contract, our calculation) and a weighted total.
Supporting analysis
What the deck claims: "110 Deals in various stages"; "2,846,639 Units"; "$169,495,044 ARR". Five stage rows: Discovery 38 deals / $74,632,560; Demo 45 / $67,046,940; Solution 17 / $16,085,880; Proposal 11 / $6,666,408; Contract 12 / $5,063,256.
Presentation choice: Every headline figure is split by stage, and the units and ARR rows add up exactly to the totals (our calculation), so a reader can see that about 84% of the value is in the two earliest stages.
When it does not fit: The deal counts in the rows add up to 123, not the 110 in the headline (our count); explain overlaps or update the headline.
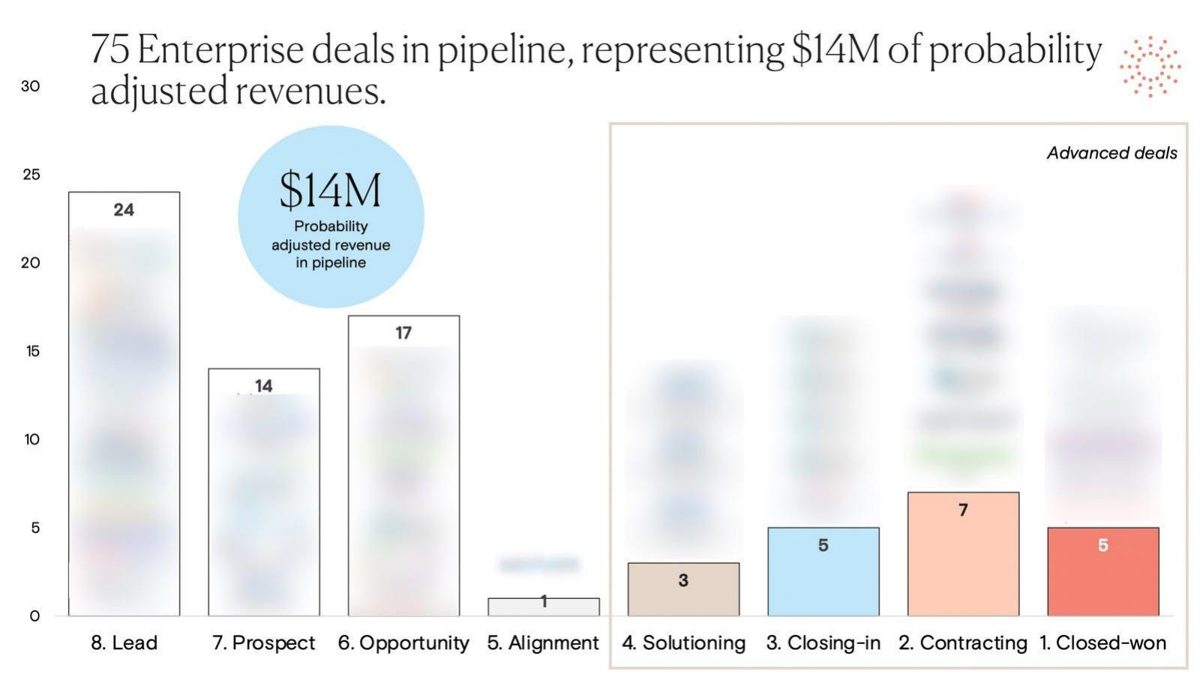
Women's health company selling to enterprise customers. Pipeline slide in a 15-page deck; company names in the bars are blurred.
Twentyeight Health deck, slide 13. Exact stored slide matched to this analysis.
Our analysis: It states that the $14M is probability-adjusted and shows the count at each of eight numbered stages, separating advanced deals from early ones.
Evidence and limitation: The bars add up to 76 (our count), or 71 without closed-won; say which deals the headline 75 includes.
What a founder can adapt: State the probability used for each stage and the unweighted total.
Supporting analysis
What the deck claims: "75 Enterprise deals in pipeline, representing $14M of probability adjusted revenues." Bars: Lead 24, Prospect 14, Opportunity 17, Alignment 1; "Advanced deals": Solutioning 3, Closing-in 5, Contracting 7, Closed-won 5.
Presentation choice: It states that the $14M is probability-adjusted and shows the count at each of eight numbered stages, separating advanced deals from early ones.
When it does not fit: The bars add up to 76 (our count), or 71 without closed-won; say which deals the headline 75 includes.
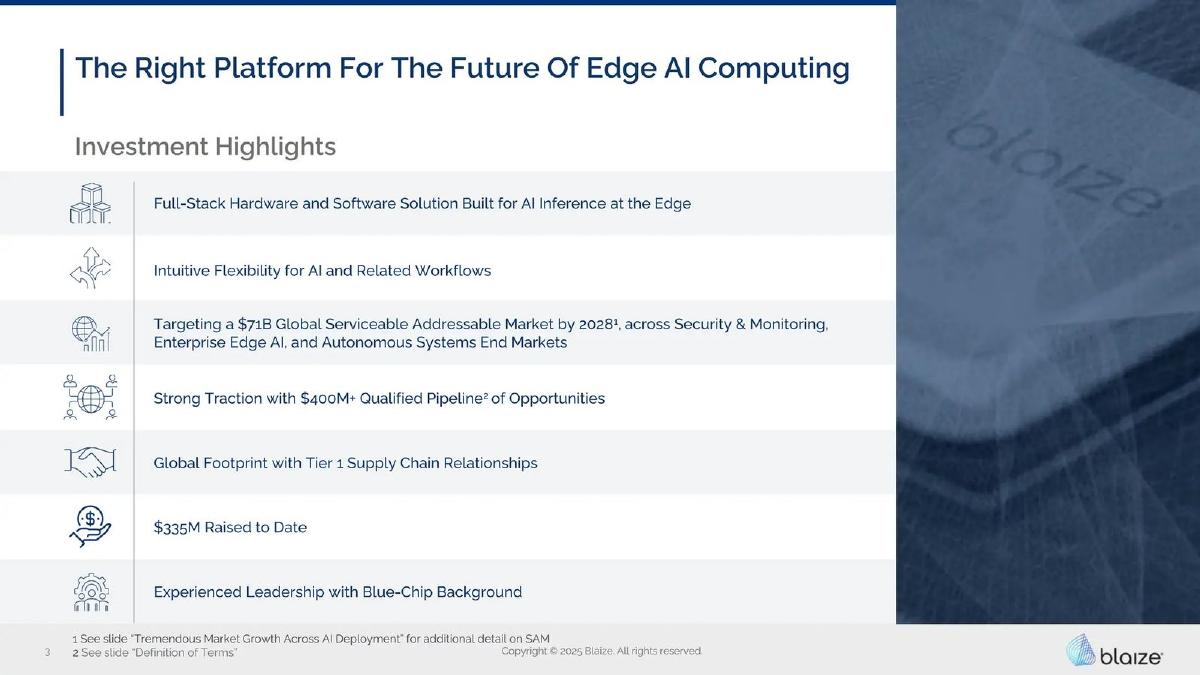
Edge AI computing company. "Investment Highlights" page of a 28-page public-company presentation (2025).
Blaize deck, slide 3. Exact stored slide matched to this analysis.
Our analysis: The headline uses "qualified" and points to where the term is defined, so the short claim is backed by a stated test.
Evidence and limitation: A highlights list gives no stage split or closed revenue; show those on the traction slide that follows.
What a founder can adapt: A private-company deck can do the same in one footnote line on the page itself.
Supporting analysis
What the deck claims: "Strong Traction with $400M+ Qualified Pipeline of Opportunities", footnoted "See slide 'Definition of Terms'"; also "$335M Raised to Date" and a "$71B Global Serviceable Addressable Market by 2028".
Presentation choice: The headline uses "qualified" and points to where the term is defined, so the short claim is backed by a stated test.
When it does not fit: A highlights list gives no stage split or closed revenue; show those on the traction slide that follows.
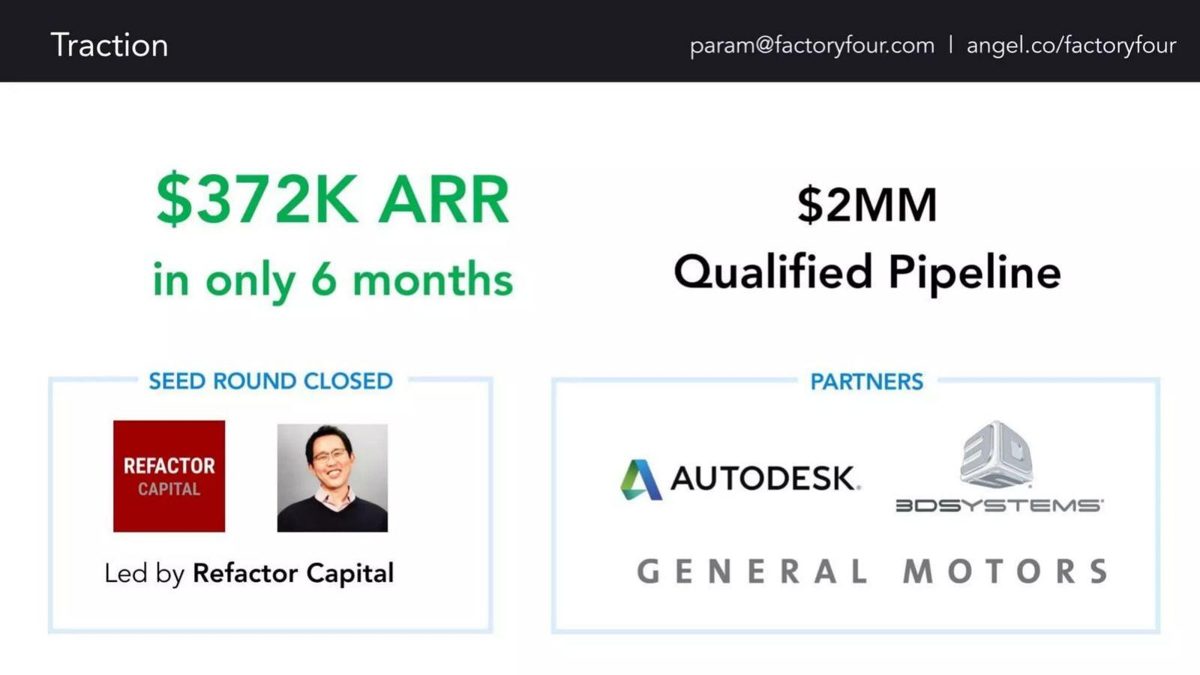
Manufacturing software. "Traction" slide in a 13-page deck.
Factory Four deck, slide 12. Exact stored slide matched to this analysis.
Our analysis: Closed ARR sits beside the pipeline at the same size, so a reader sees the pipeline is about 5.4 times current ARR (our calculation).
Evidence and limitation: Partners next to the pipeline figure read as pipeline deals; say whether they are.
What a founder can adapt: Say whether the $2MM is annual contract value, like the ARR, and when it is expected to close.
Supporting analysis
What the deck claims: "$372K ARR in only 6 months"; "$2MM Qualified Pipeline"; "Seed round closed, led by Refactor Capital"; partners Autodesk, 3D Systems and General Motors.
Presentation choice: Closed ARR sits beside the pipeline at the same size, so a reader sees the pipeline is about 5.4 times current ARR (our calculation).
When it does not fit: Partners next to the pipeline figure read as pipeline deals; say whether they are.
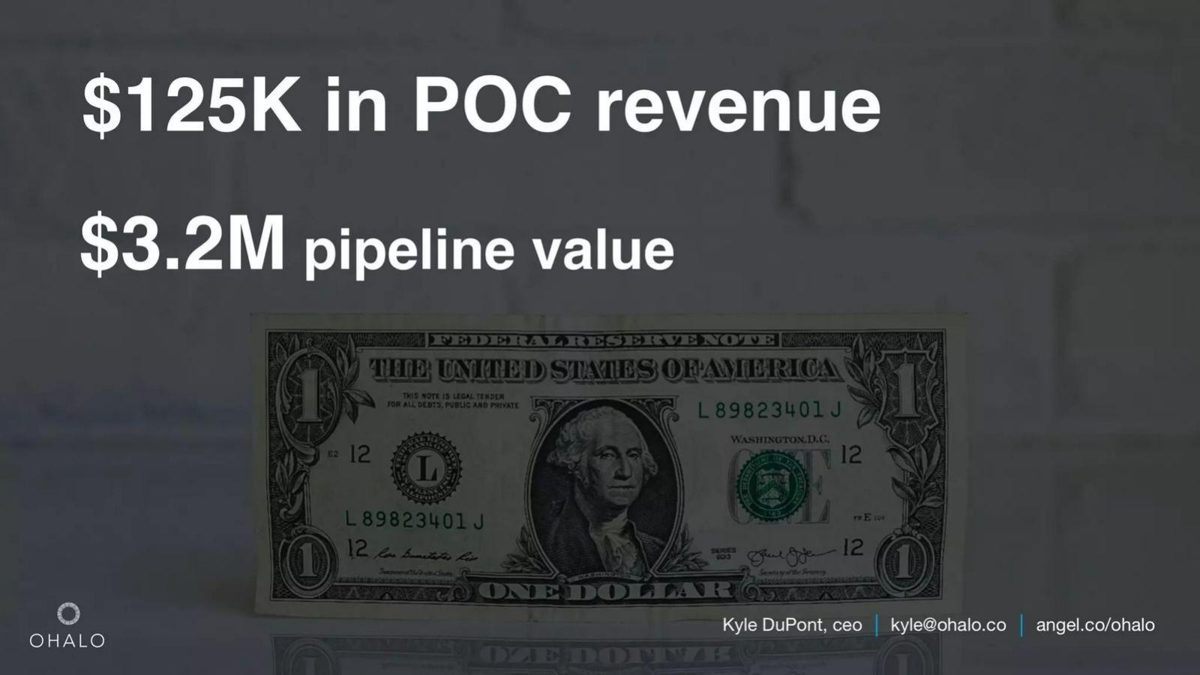
Ohalo deck, slide 7. Exact stored slide matched to this analysis.
Our analysis: Paid proof-of-concept revenue appears first, ahead of the pipeline, so the closed figure leads.
Evidence and limitation: The pipeline is 25.6 times closed revenue (our calculation); without stages or weighting, a reader cannot judge how much is realistic.
What a founder can adapt: Say how many proofs of concept make up the $125K and how much of the $3.2M comes from converting them.
Supporting analysis
What the deck claims: "$125K in POC revenue"; "$3.2M pipeline value".
Presentation choice: Paid proof-of-concept revenue appears first, ahead of the pipeline, so the closed figure leads.
When it does not fit: The pipeline is 25.6 times closed revenue (our calculation); without stages or weighting, a reader cannot judge how much is realistic.
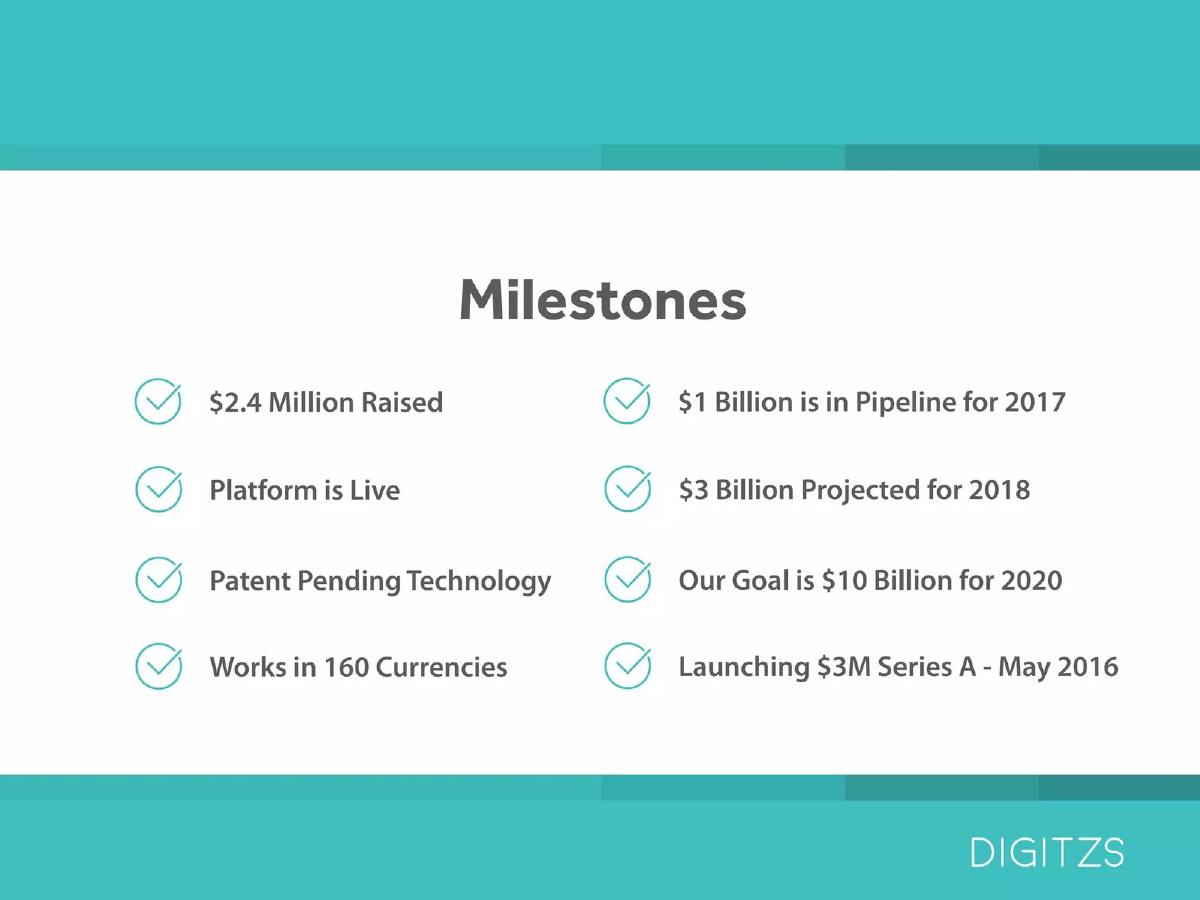
Payments platform. "Milestones" slide in a 13-page deck announcing a $3M Series A for May 2016.
Digitzs deck, slide 2. Exact stored slide matched to this analysis.
Our analysis: Pipeline, projection and goal are worded differently, which keeps them apart.
Evidence and limitation: A check mark beside a pipeline or a goal presents it as a completed milestone.
What a founder can adapt: Name the unit (payment volume, not revenue) and the revenue to the company at its take rate.
Supporting analysis
What the deck claims: "$1 Billion is in Pipeline for 2017"; "$3 Billion Projected for 2018"; "Our Goal is $10 Billion for 2020"; "$2.4 Million Raised".
Presentation choice: Pipeline, projection and goal are worded differently, which keeps them apart.
When it does not fit: A check mark beside a pipeline or a goal presents it as a completed milestone.
Each cell reports only what the slide itself states. "Not stated" means the page gives no figure.
Example
Pipeline
Definition / weighting
Stages shown
Closed figure beside it
Adds up?
Venn
$169,495,044 ARR
Not stated
5 stages
No
Units and ARR yes; deals 123 vs 110 (our count)
Twentyeight Health
$14M
Probability-adjusted
8 stages (counts)
5 closed-won deals
Bars 76 vs 75 (our count)
Blaize
$400M+
"Qualified", defined on another slide
No
No
Not testable
Factory Four
$2MM
"Qualified", not defined
No
$372K ARR
Not testable
ProcureNow
$835K
"Sales qualified", not defined
No
No
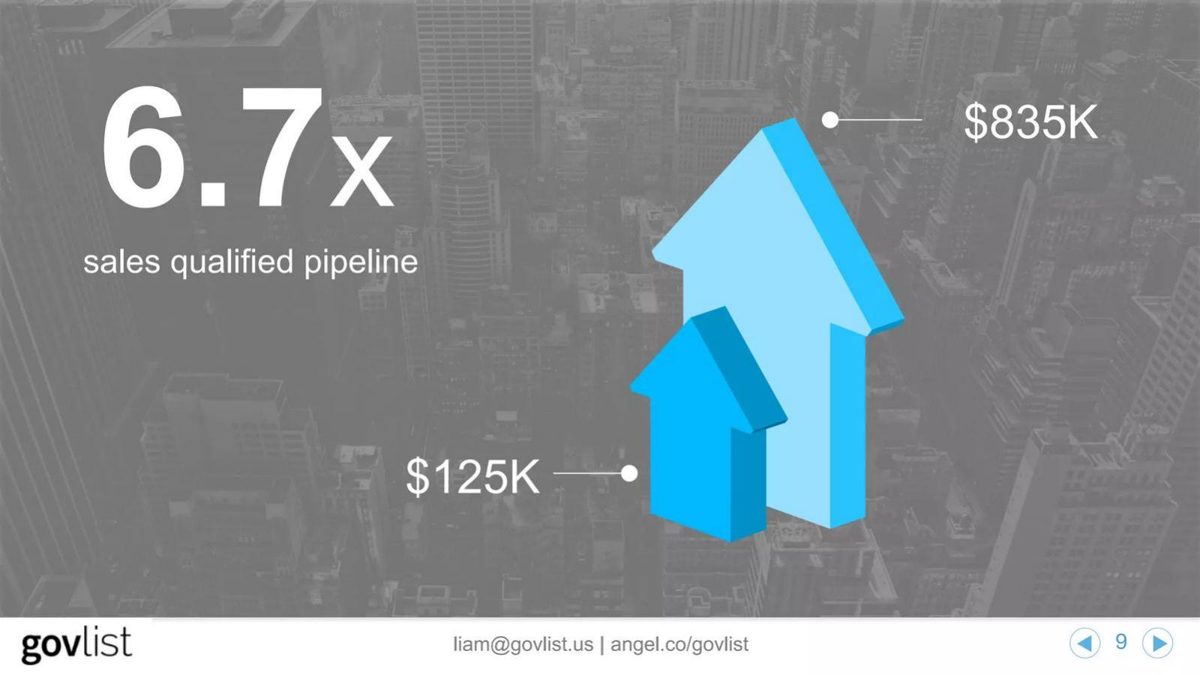
6.7x yes (our calc.)
Ohalo
$3.2M
Not stated
No
$125K POC revenue
Not testable
FPD
$1.4M (one customer)
Not stated
No
$128,000 closed
Not testable
VR Motion
$4M
Not stated
No
$266K in 12 months
Not testable
MoBagel
$19M
Not stated
No
$4.8M contract
Not testable
Beatdapp
$25M
Not stated
No
No
Not testable
Digitzs
$1B for 2017
Unit not stated
No
No
Not testable
Scopio
~$875K
Not stated
No
30+ clients
Not testable
Key Takeaways
Define pipeline. Blaize footnotes "Qualified Pipeline" to a separate definitions slide; most slides here give no definition at all.
Break it into stages. Venn's table (Discovery, Demo, Solution, Proposal, Contract) shows that most of its $169M sits in the two earliest stages.
Say whether it is weighted. Twentyeight Health's "$14M of probability adjusted revenues" is weighted; Ohalo's "$3.2M pipeline value" does not say.
Put closed revenue beside it. FPD shows "$1.4 Million Opportunity Pipeline" next to "$128,000 Closed Business", about 11 times more pipeline than closed (our calculation).
Check that the totals match the parts. Our counts find 123 deals in Venn's rows against a headline of 110, and 76 in Twentyeight Health's bars against 75.
Keep the unit clear. Digitzs's "$1 Billion is in Pipeline for 2017" appears to describe payment volume, not revenue to Digitzs, but the slide does not say.
Write your pipeline line
Fill in what you know. Leave a field blank rather than guess, and label weighted figures as weighted.
Definition. What must a deal have to count as qualified pipeline?
Stages. How many deals and how much value at each stage?
Weighting. Unweighted total, weighted total, and the weight at each stage.
Unit. Annual contract value, total contract value, or volume?
Closed. Revenue or signed contract value for the same period.
Track record. What share of an earlier period's qualified pipeline closed?
Copyable framework: $[unweighted] qualified pipeline ([n] deals; qualified = [test]); $[weighted] weighted at [weights]. [n] deals / $[x] in proposal or contracting. Closed in the same period: $[closed]. Of Q[n] pipeline, [x]% closed within [months].
Illustrative example 1 — written by us
Before: $5M pipeline with top brands.
After: $5.0M qualified ARR pipeline (42 deals; qualified = budget confirmed and proposal requested); $1.4M weighted (early 10%, proposal 40%, contracting 80%). $1.1M in contracting. Closed ARR to date: $610K. Of Q1 qualified pipeline, 26% closed within six months.
What improved: Placeholder figures showing the format: definition, weighting, stages, closed revenue and a track record make the pipeline testable.
Why a pipeline figure needs more context than revenue
Revenue has happened. Signed contracts are committed. Pipeline is a list of possibilities: prospects who have taken a meeting, asked for a proposal or started a trial. The same company can report a very different pipeline depending on where it starts counting. Include every prospect who took a first call, and pipeline can be many times revenue; count only deals with a proposal out, and it will be much smaller.
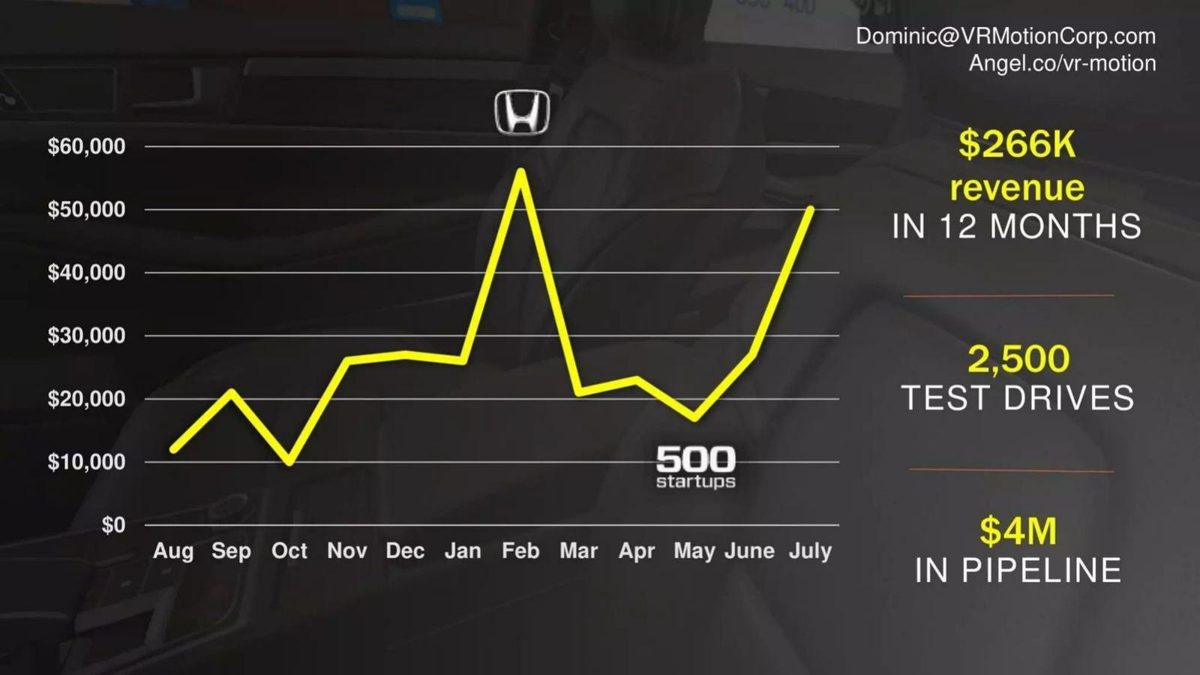
Investors therefore read a pipeline figure for its definition before its size. A $4M pipeline built from 2,500 test drives (VR Motion) and a $4M pipeline of proposals awaiting signature describe very different businesses. The slides that are easiest to trust in this set are the ones that let a reader see which of these they are looking at.
Pipeline is also easy to inflate unintentionally. A deal that was lost can stay on a list; a large company can be counted at the value of its whole budget rather than the likely first order; the same prospect can appear under two products. None of the slides here say how their pipeline is cleaned, and few founders do. A short definition line solves most of this.
Stages: where the value actually sits
A stage breakdown shows how close the deals are to closing. Venn's page 21, "Pipeline Overview: Top Deals", is the most complete example in this set. The headline boxes read "110 Deals in various stages", "2,846,639 Units" and "$169,495,044 ARR". The table below splits these into Discovery (38 deals, 1,243,876 units, $74,632,560), Demo (45; 1,117,449; $67,046,940), Solution (17; 268,098; $16,085,880), Proposal (11; 123,452; $6,666,408) and Contract (12; 93,764; $5,063,256).
Our calculation: the units and ARR in the rows add up exactly to the headline figures. The deal counts do not: 38 + 45 + 17 + 11 + 12 = 123, not 110. The slide does not say why; some deals may appear in more than one row, or the headline may predate the table. The breakdown also shows that $141.7M of the $169.5M, about 84%, sits in Discovery and Demo, and $11.7M in Proposal and Contract (our calculation). A reader who sees only the headline would not know that.
The same arithmetic shows how Venn priced its pipeline: ARR divided by units is exactly $60 per unit in Discovery, Demo and Solution, and exactly $54 per unit in Proposal and Contract (our calculation). That pattern suggests a list price early and a discounted price at the stages where terms are negotiated, but the slide does not say so. Stating the price assumption on the slide would make the ARR figure easier to trust.
Twentyeight Health's page 13 uses a bar chart with eight numbered stages, from "8. Lead" to "1. Closed-won": Lead 24, Prospect 14, Opportunity 17, Alignment 1, Solutioning 3, Closing-in 5, Contracting 7, Closed-won 5. The last four sit in a box labelled "Advanced deals". The headline reads "75 Enterprise deals in pipeline". The bars as read add up to 76 (our count), and 71 if closed-won deals are excluded; the slide does not say which deals the 75 includes. The names in each bar are blurred in the public copy.
Weighted or unweighted value
An unweighted pipeline adds up the full value of every open deal. A weighted pipeline multiplies each deal by an estimated chance of closing, often set by stage (for example 10% at first meeting, 50% at proposal, 90% at contract). Both are legitimate; they answer different questions, and the difference can be large.
Twentyeight Health is explicit: "$14M Probability adjusted revenue in pipeline". The slide does not give the probabilities it applied to each stage or the unweighted total, so a reader cannot see how much of the $14M depends on early-stage deals. Adding one line such as "weights: lead 5%, opportunity 20%, contracting 80%" would let a reader check it.
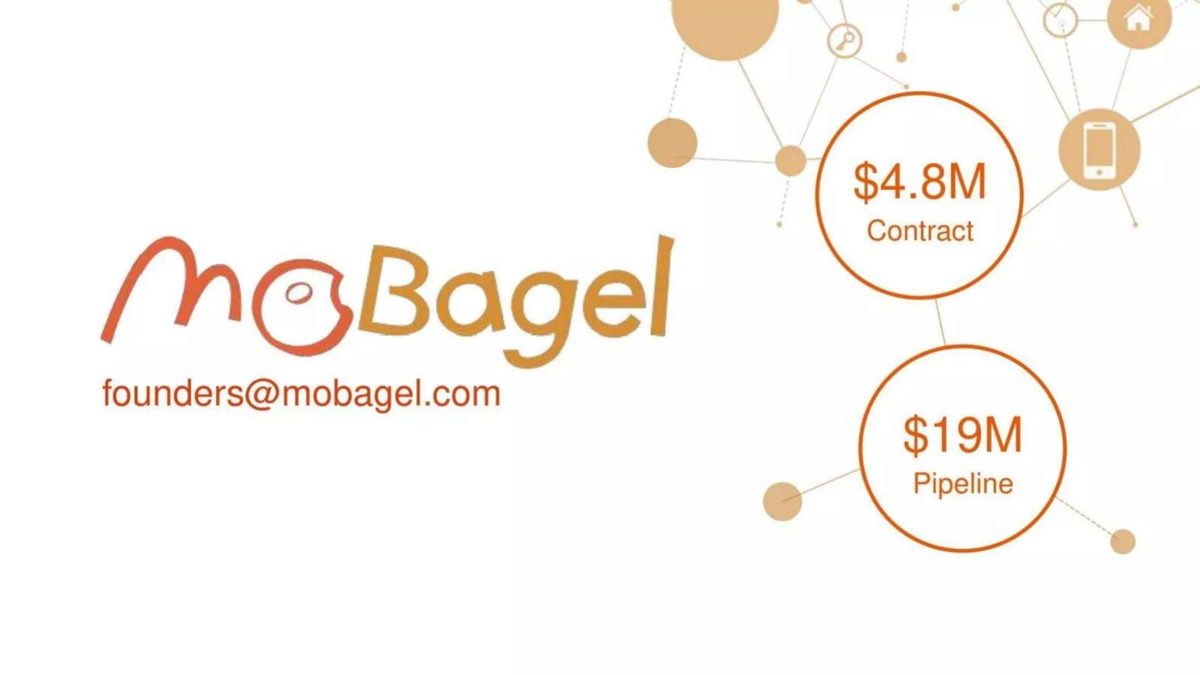
Most other slides in this set do not say. Ohalo's "$3.2M pipeline value", MoBagel's "$19M Pipeline", Scopio's "~$875K in pipeline" and VR Motion's "$4M in pipeline" are all presented without a weighting or a stage split. Readers are likely to assume they are unweighted, which makes them the most optimistic version of the number.
What "qualified" means
"Qualified pipeline" usually means deals that passed a test: a confirmed budget, a named decision-maker, a stated need and a timeline. Each company sets its own test, so the word only helps if the slide says what it is.
Blaize, a public-company presentation, lists "Strong Traction with $400M+ Qualified Pipeline of Opportunities" among its investment highlights and footnotes it to a slide called "Definition of Terms". That is the right structure: the headline stays short and the definition is one reference away. This guide shows only page 3; we did not review the definition itself.
Factory Four's "$2MM Qualified Pipeline" and ProcureNow's "6.7x sales qualified pipeline" use the same word without a definition on the page. ProcureNow's chart shows two arrows labelled $125K and $835K; 835 ÷ 125 is 6.68, which matches the 6.7x (our calculation), but the slide does not say what the $125K was or over what period the pipeline grew.
Pipeline beside closed business
The most useful comparison for a pipeline figure is the company's own closed revenue or signed contracts. It lets a reader see how much of the pipeline has turned into money so far, and how large the pipeline is relative to the business today.
FPD's page 6 does this for a single customer: "$1.4 Million Opportunity Pipeline", "$128,000 Closed Business" and "$24,000 Memberships Generated" at the Berkeley City Club. By our calculation the pipeline is about 11 times the closed business. The slide does not say over what period the $128,000 closed, so a reader cannot turn that into a conversion rate.
Other slides in this set make the same comparison across the whole company. By our calculations: Ohalo's pipeline is 25.6 times its "$125K in POC revenue"; VR Motion's is about 15 times its "$266K revenue in 12 months"; Factory Four's is about 5.4 times its "$372K ARR"; MoBagel's "$19M Pipeline" is about 4 times its "$4.8M Contract". These ratios are not directly comparable, because the slides do not say whether pipeline means annual or total contract value or over what period it is expected to close. They do show a reader how much of the story depends on deals that have not happened yet.
Logos and unit mismatches
Beatdapp's page 7 is titled "$25M Pipeline" and shows seven logos: eOne, Warner Music, TuneCore, OCESA Seitrack, The Orchard, T-Series and Saregama. The slide does not say whether these are customers, prospects or partners, which deals make up the $25M, or at what stage they are. A logo on a pipeline slide tells a reader a company has been in conversation with that brand; it does not tell them a deal exists.
Digitzs's page 2, a milestones slide, lists "$1 Billion is in Pipeline for 2017", "$3 Billion Projected for 2018" and "Our Goal is $10 Billion for 2020" beside "$2.4 Million Raised". Digitzs is a payments company, so these figures most likely describe payment volume processed rather than revenue to Digitzs, but the slide does not say so. When pipeline is measured in volume, bookings or units rather than revenue, name the unit.
Scopio's closing slide reads "30+ Clients", "2 Partnerships" and "~$875K in pipeline". It gives a client count next to the pipeline, which helps, but not the revenue from those clients, so a reader cannot compare what is closed with what is hoped for.
How to build your pipeline line
Start with the definition in one line: "Qualified = budget confirmed, decision-maker met, proposal requested." Then give the stage split, even in three buckets: early, proposal, contracting. Give both the unweighted total and a weighted total with the weights stated. Put your closed revenue or signed contract value beside it for the same period. Finally, add the expected close window: "expected to close in the next two quarters".
Check the arithmetic before the deck goes out. The stage rows should add up to the headline for every column you show, the weighted total should follow from the stated weights, and a ratio such as "6.7x" should be reproducible from figures on the slide. Two of the most detailed slides in this set, Venn and Twentyeight Health, have deal counts that do not match their own headlines by our count; a reader who notices will wonder what else does not add up.
If you have tracked pipeline for a while, one historical figure makes the whole slide more credible: the share of qualified pipeline from an earlier period that closed. None of the slides here gives one. "Of $1.2M qualified pipeline at the end of Q1, $310K closed by the end of Q3" is a measured conversion rate and turns the pipeline figure from a hope into a forecast with a track record.
Common mistakes
No definition. "Pipeline" and "qualified" mean different things at every company; say what yours means.
Unweighted only. Give a weighted total as well, with the weights, or readers will discount the headline themselves.
Totals that don't match. Stage rows should add up to the headline in every column.
No closed figure. Put revenue or signed contract value beside pipeline for the same period.
Logos as pipeline. Mark each logo as customer, pilot or prospect.
Unclear unit. Volume, total contract value and annual revenue are not interchangeable.
Diagnostic checklist
Pipeline is defined, including what "qualified" means.
Value is split by stage.
Weighted and unweighted totals are both shown, with weights.
The unit (ARR, contract value, volume) is named.
Closed revenue for the same period sits beside it.
Stage figures add up to the headline.
Frequently asked questions
Should I put my sales pipeline on my pitch deck?
Yes, if you can define it and show stages. A pipeline figure is most useful beside closed revenue; on its own it is the least certain number on a traction slide. Slides like Venn's, which split every figure by stage, let investors judge it; single headline figures such as Beatdapp's "$25M Pipeline" cannot be tested.
Weighted or unweighted pipeline: which should I show?
Show both, and state the weights. Twentyeight Health reports "$14M of probability adjusted revenues" but not the weights or the unweighted total, so a reader cannot see how much depends on early-stage deals.
What ratio of pipeline to revenue is normal?
There is no single benchmark, and the slides here are not comparable: by our calculations the ratios run from about 4 to 1 (MoBagel) to about 26 to 1 (Ohalo), with different definitions and units. Show your own history instead: the share of earlier qualified pipeline that closed.
Can I list prospects' logos next to my pipeline figure?
Only if you say what each one is. Beatdapp's logos sit under a "$25M Pipeline" headline without saying which are customers, pilots or prospects. Label them, and make sure you are allowed to show them.
How we chose these examples
Search (2026-09-30): the durable corpus index (docs/seo/artifacts/corpus-search, 70,729 unique pages, deduplicated by deck-file sha256 + page) was searched for pipeline figures near a currency amount and for weighted or qualified pipeline (45 hits, many describing oil or gas pipelines, drug-development pipelines or data pipelines). Existing guides were read first: the traction, paid pilots, deal size and go-to-market guides mention pipeline only in passing, and the sales cycle guide covers time to close rather than the value of open deals, so this guide asks a question none of them answers.
Fifteen candidate pages were rendered from the original public deck files and read from the images; twelve are used: Venn 21, Twentyeight Health 13, Blaize 3, Factory Four 12, ProcureNow 9, Ohalo 7, FPD 6, VR Motion 7, MoBagel 14, Beatdapp 7, Digitzs 2, Scopio 11. Twelve images were stored from the original PDFs on 2026-09-30.
Left out: Cerebrium 12 (every figure a placeholder, and Cerebrium's redacted traction slide is already used in the traction guide), Relevize 5 (the pipeline figures are a product screenshot of its customers' partners, not its own pipeline), SuperScale 11 ("targets in pipeline" describes upside per deal, already cited in other guides), Globe Keeper 16, Paramark 3, Forethought 6 and Bliinx 13 (already used in the paid pilots and partnerships guides), and pages about oil, gas, drug or data pipelines.
All calculations are ours and labelled; counts of bars and rows are our readings of the slide images. How we built this: drafted and checked with AI assistance (editorial model review against the original slide images); no human editor has reviewed this guide.