Food Startup Go-to-Market Slide Examples: 8 Real Pitch
How food and grocery startups explain how they will win customers: workplace partners, channel cost tables, sampling budgets.
Food Startup Go-to-Market Slide: Name the Partner, Cost the Channel, Show the Repeat Order
Food is bought often and cheaply, so a food startup's go-to-market slide has a different job from most. One order is worth little. What matters is whether the customer orders again, and whether a partner such as an employer, a school, a restaurant or a chain can bring many customers at once. This guide uses eight go-to-market slides from food and grocery startups, from a meal-kit company that puts cost, value and retention side by side to a growth slide with no figures at all.
TL;DR
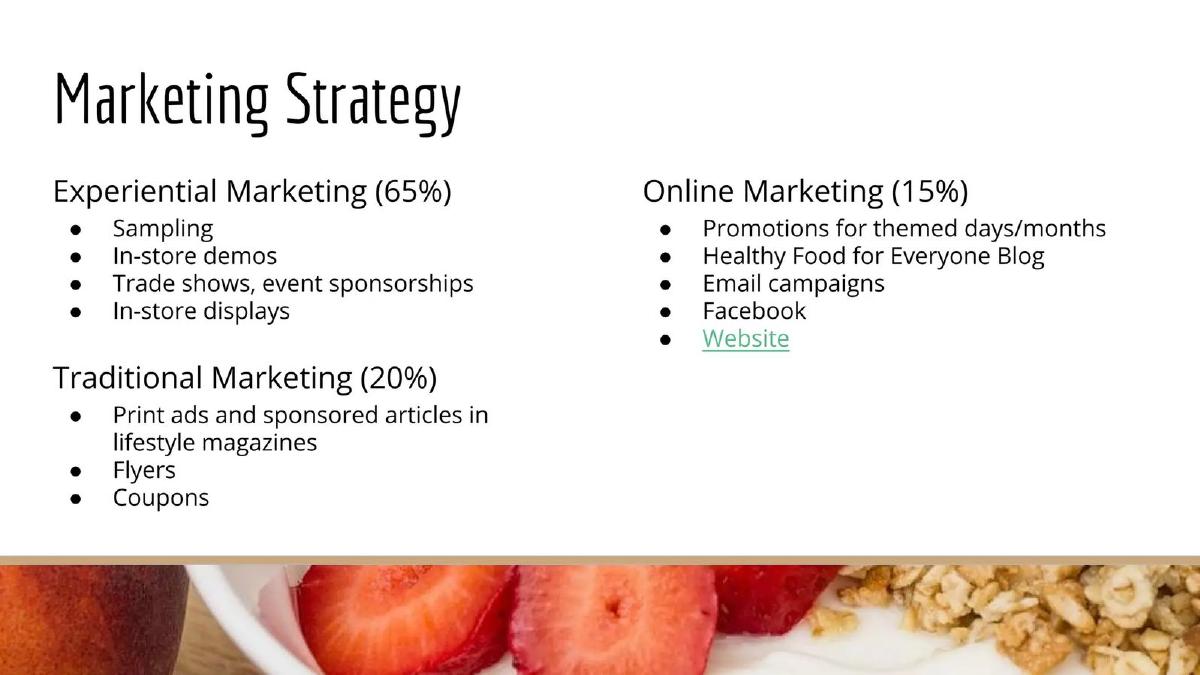
Name the partner who brings customers in groups, give the cost of each channel and show how often customers come back. Tomato Sherpa sells through wellness teams at companies with 400+ employees and gives $44 a week per customer, 65% retention after a year, $120 to win a customer and $800 lifetime value. Fetch prices 11 channels in a table, $950 up front and $509 a month, then projects the cost of each customer falling from $5.40 to $1.40. Parfait splits its marketing 65% in-person, 20% traditional and 15% online. Freshmart and Miel de Tierra describe aggressive campaigns with no channel, cost or result.
Eight food go-to-market slides
Strongest first, warning examples last. Each example quotes the slide and notes what an investor can and cannot learn from it.
Tomato Sherpa go to market slide — slide 4
Meal-kit subscriptions delivered to offices. Slide titled "Benefits for employees and employers".
Tomato Sherpa deck, slide 4. Exact stored slide matched to this analysis.
Our analysis: A partner channel with cost, value and retention side by side.
Evidence and limitation: Company figures; the slide does not say which are results and which are assumptions.
What a founder can adapt: Say whether $800 is revenue or gross profit, and whether the figures are measured.
Supporting analysis
What the deck claims: "Go-to-Market strategy: Promote service to wellness and employee services teams, then sell subscriptions directly to employees and deliver to the office to take home and cook." Customer profile: "28-54 year old professionals"; "Ave. customer value: $44 weekly"; "12 month retention: 65%"; "COA: $120"; "LTV: $800"; "Users per company: 5%". Corporate partner profile: "Teams of 400+ employees"; "Target companies in SF Bay area: 4500".
Presentation choice: Investors can check whether the cost of winning a customer is repaid.
When it does not fit: A lifetime value that does not match weekly spend and retention without explanation.
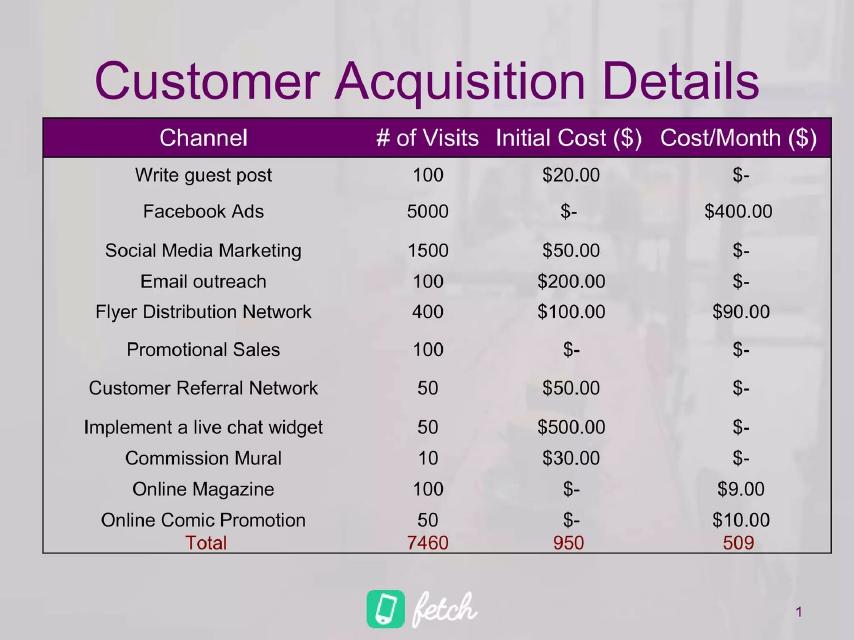
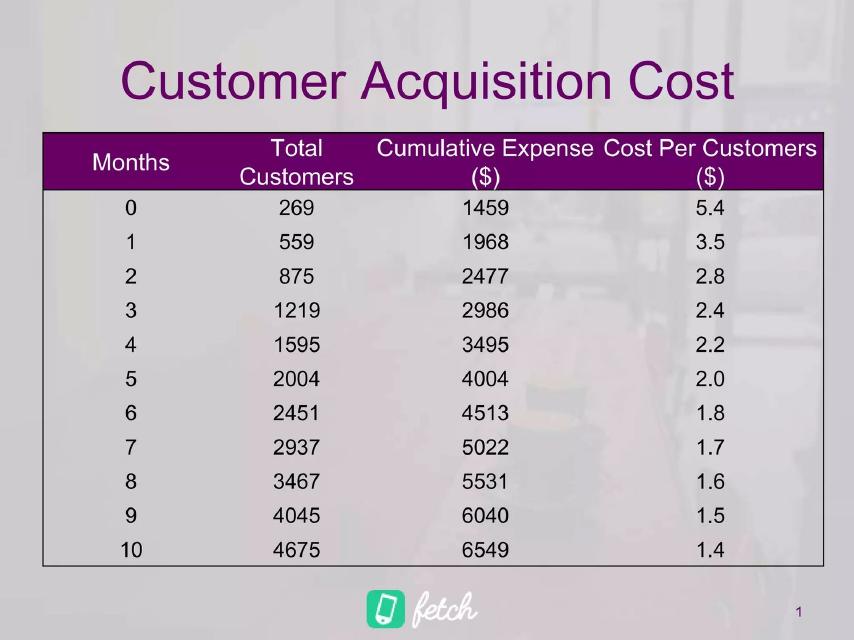
Food ordering app piloting in Toronto. Slides titled "Customer Acquisition Details" and "Customer Acquisition Cost".
Fetch deck, slide 16. Exact stored slide matched to this analysis.Fetch deck, slide 17. Exact stored slide matched to this analysis.
Our analysis: Every channel priced, and two tables that agree with each other.
Evidence and limitation: Company forecasts; the cumulative spend matches the channel table.
What a founder can adapt: Label the monthly table as a forecast and add actual results from the pilot.
Supporting analysis
What the deck claims: Channel table: "Facebook Ads" 5,000 visits, $400 a month; "Social Media Marketing" 1,500 visits, $50 up front; "Flyer Distribution Network" 400 visits, $100 up front and $90 a month; "Commission Mural" 10 visits, $30; "Total" 7,460 visits, $950 up front, $509 a month. Cost table by month: month 0, 269 customers, $1,459 cumulative, $5.4 per customer; month 10, 4,675 customers, $6,549, $1.4 per customer.
Presentation choice: Investors can see which channel carries the plan and test the arithmetic.
When it does not fit: Future months presented without a "projected" label.
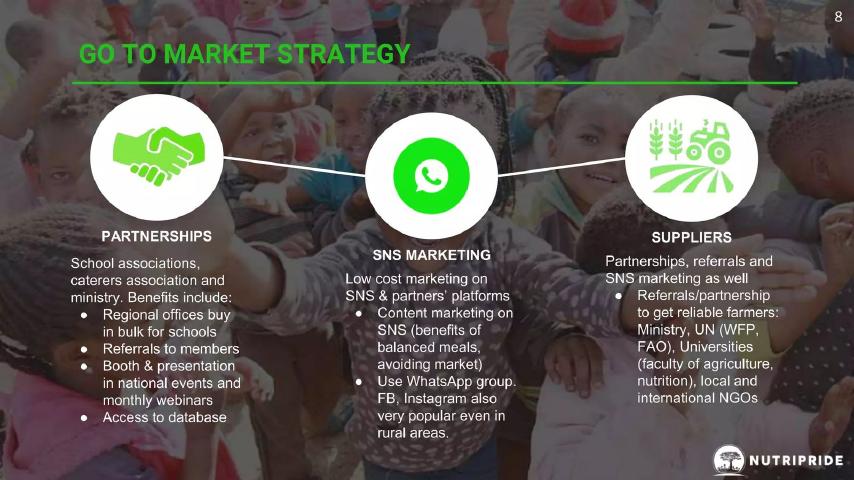
Nutritious food products for schools and rural families. Slide titled "Go to Market Strategy".
Nutripride deck, slide 9. Exact stored slide matched to this analysis.
Our analysis: Bulk buyers named, with what each partnership gives the company.
Evidence and limitation: Company plan; no figures.
What a founder can adapt: Say which partnerships are signed and what they have ordered.
Supporting analysis
What the deck claims: "Partnerships: School associations, caterers association and ministry. Benefits include: Regional offices buy in bulk for schools; Referrals to members; Booth & presentation in national events and monthly webinars; Access to database." "SNS Marketing: Low cost marketing on SNS & partners' platforms"; "Use WhatsApp group, FB, Instagram also very popular even in rural areas." "Suppliers: Partnerships, referrals and SNS marketing as well", naming the ministry, the UN (WFP, FAO), universities and NGOs.
Presentation choice: One ministry or association can bring many schools at once.
When it does not fit: Listing the UN and a ministry without saying whether any agreement exists.
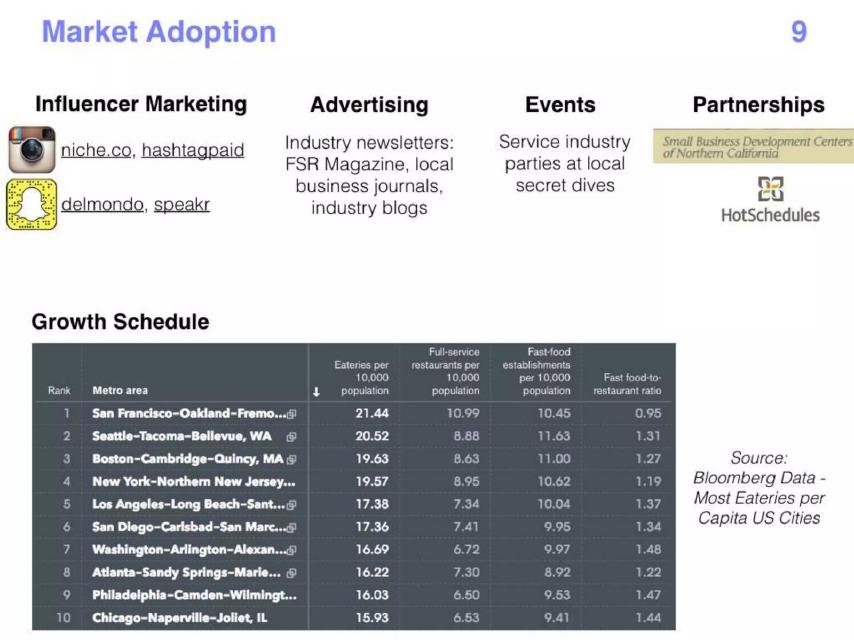
Software for restaurants and their staff. Slide titled "Market Adoption".
Grapevine deck, slide 9. Exact stored slide matched to this analysis.
Our analysis: Specific channels and partners, but the growth schedule has no dates.
Evidence and limitation: Company plan; the table is third-party market data.
What a founder can adapt: Turn the city ranking into a launch order with dates and targets.
Supporting analysis
What the deck claims: "Influencer Marketing": niche.co, hashtagpaid, delmondo, speakr. "Advertising": "Industry newsletters: FSR Magazine, local business journals, industry blogs". "Events": "Service industry parties at local secret dives". "Partnerships": Small Business Development Centers of Northern California, HotSchedules. "Growth Schedule": a table of ten US metros ranked by eateries per 10,000 people, from San Francisco (21.44) to Chicago (15.93), "Source: Bloomberg Data".
Presentation choice: Named outlets and partners are more credible than generic channel names.
When it does not fit: Calling market data a schedule.
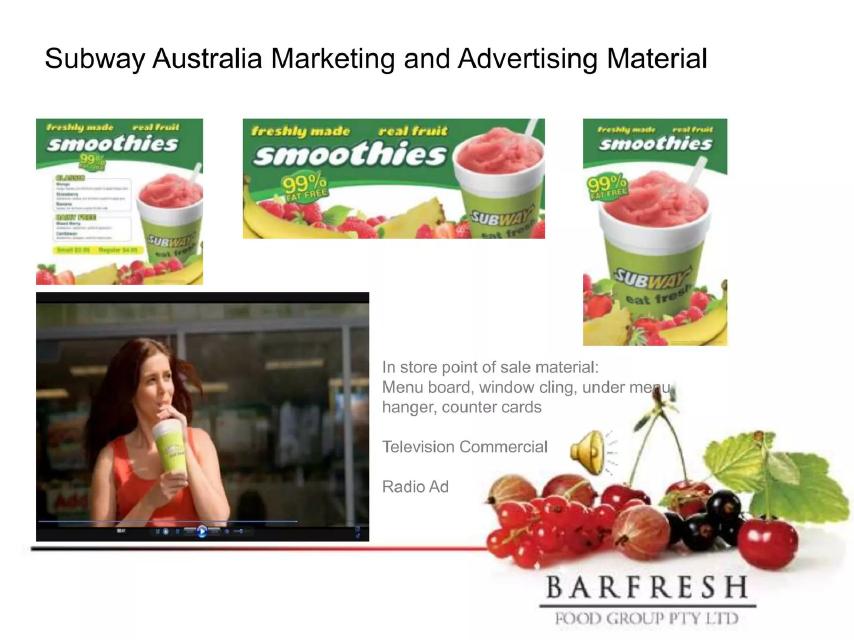
Ready-to-blend smoothie packs for food chains. Slide titled "Subway Australia Marketing and Advertising Material".
Barfresh deck, slide 14. Exact stored slide matched to this analysis.
Our analysis: Proof that a national chain is marketing the product.
Evidence and limitation: Images of a partner's marketing; no figures.
What a founder can adapt: Add how many stores carry it and what it has sold.
Supporting analysis
What the deck claims: Images of Subway's "freshly made real fruit smoothies" promotions. "In store point of sale material: Menu board, window cling, under menu hanger, counter cards"; "Television Commercial"; "Radio Ad".
Presentation choice: A chain's own advertising is strong evidence of commitment.
When it does not fit: Letting a partner's advertising stand in for sales figures.
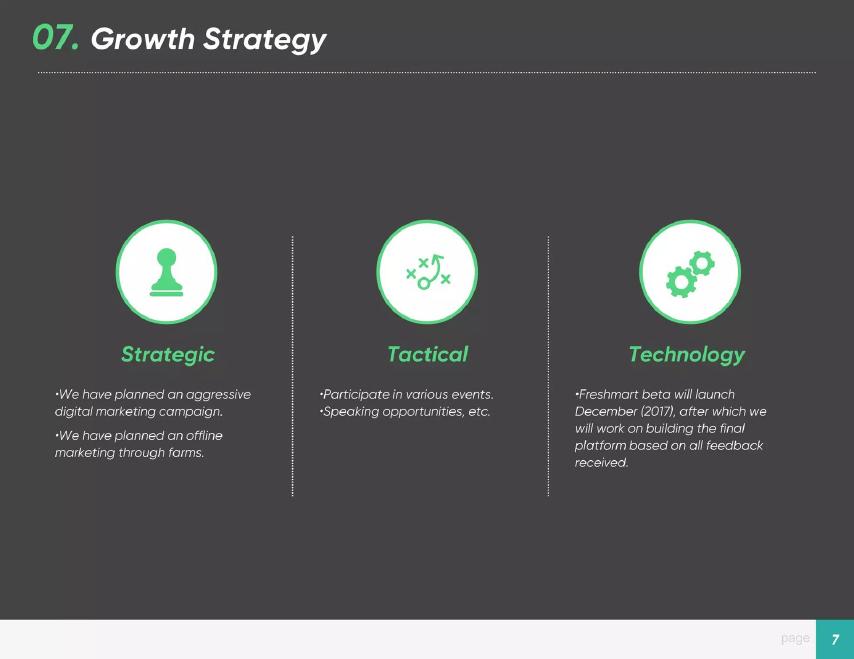
Freshmart deck, slide 8. Exact stored slide matched to this analysis.
Our analysis: Intentions with no channel, customer, cost or result.
Evidence and limitation: Company statements; no figures.
What a founder can adapt: Name the channels and give a cost and target for each.
Supporting analysis
What the deck claims: "Strategic: We have planned an aggressive digital marketing campaign. We have planned an offline marketing through forms." "Tactical: Participate in various events. Speaking opportunities, etc." "Technology: Freshmart beta will launch December (2017), after which we will work on building the final platform based on all feedback received."
Presentation choice: "Aggressive" tells investors nothing they can check.
When it does not fit: Adjectives in place of numbers.
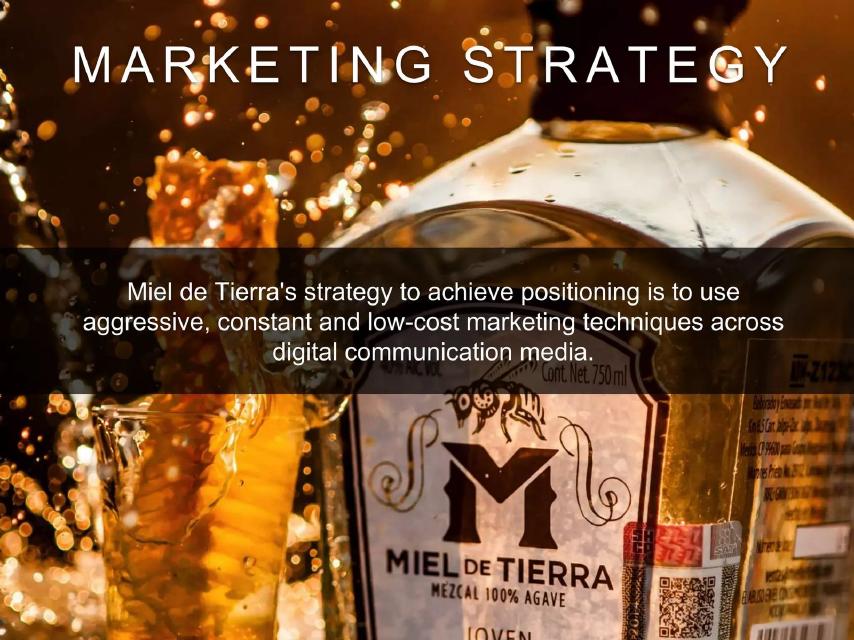
Miel de Tierra deck, slide 14. Exact stored slide matched to this analysis.
Our analysis: One sentence over a photo, with no channel named.
Evidence and limitation: Company statement; no figures.
What a founder can adapt: Show which channels drove the sales growth reported in the deck.
Supporting analysis
What the deck claims: "Miel de Tierra's strategy to achieve positioning is to use aggressive, constant and low-cost marketing techniques across digital communication media." Product photo.
Presentation choice: The deck has traction figures elsewhere that this slide could have drawn on.
When it does not fit: A strategy sentence with nothing to test.
Whether each slide names a partner or channel, gives a cost, and shows results or repeat orders.
Example
Partner or channel
Cost given
Results or repeat orders
Tomato Sherpa
Employers of 400+
$120 per customer
65% after 12 months
Fetch
11 priced channels
Per channel and per customer
Forecast only
Parfait
Sampling and demos
Budget split only
No
Nutripride
Schools and ministry
No
No
Grapevine
Named outlets and partners
No
No
Barfresh
Subway Australia
No
No
Freshmart
None named
No
No
Miel de Tierra
None named
No
No
Key Takeaways
Name the partner who brings customers in groups.
Give cost per channel and how many it brings.
Show repeat orders, not just first orders.
Label projections as projections.
Check that no figure is cut off.
Build your food go-to-market slide
Answer these before you design the slide.
Partner. Who can bring you many customers at once: an employer, school, chain or store?
Channels. For each channel, what does one customer cost and how many has it brought so far?
Repeat. What does a customer spend each week or month, and how many are still ordering after 3 or 12 months?
Forecast. Which figures are results and which are forecasts?
Copyable framework: We reach [customers] through [partner]. [Channel]: [cost] per customer, [number] so far. Customers spend [amount] a [period]; [percent] still order after [months]. Forecast: [target] at [cost].
Illustrative example 1 — written by us
Before: We will use aggressive digital and offline marketing to grow fast.
After: We reach office workers through 6 employer partners. In-office tastings: $18 per customer, 210 customers since May. Instagram ads: $31 per customer, 90 customers. Customers spend $36 a week; 58% still order after 3 months. Forecast: 20 employers by June at $20 per customer.
What improved: Our illustrative rewrite; all figures are invented for the example. It names the partner, costs each channel, shows repeat orders and labels the forecast.
What this guide adds
The general go-to-market guide covers any startup. Food differs in three ways: orders are small and frequent, so retention decides whether the cost of winning a customer is ever repaid; many customers can be reached through one partner, such as an employer, a school or a chain; and in-person tasting still sells food in a way that online ads often cannot. This guide shows how food startups present those three points.
How we read each slide
We read each stored slide image and quote the text on it. Tomato Sherpa, Fetch and Grapevine were read at full size; Parfait, Nutripride, Barfresh, Freshmart and Miel de Tierra were legible at low resolution. We have not checked any company's costs, partners or results, and we make no claim that any slide affected a fundraising outcome.
One partner, many customers
Tomato Sherpa's slide opens with a one-line plan: "Promote service to wellness and employee services teams, then sell subscriptions directly to employees and deliver to the office to take home and cook." It then sizes both sides. Corporate partners are teams of 400+ employees, with 4,500 such companies in the San Francisco Bay Area. It expects 5% of employees to sign up, so one partner of 400 people means about 20 customers.
Nutripride uses the same idea with schools: partnerships with "school associations, caterers association and ministry", where "regional offices buy in bulk for schools". Barfresh shows it in its most powerful form: its smoothies in Subway Australia's in-store menus, window clings, television commercial and radio ad. A chain partner brings a marketing budget the startup could never afford, though the slide does not say what Barfresh paid or sold.
Repeat orders decide the cost you can afford
A food customer is worth little on day one. Tomato Sherpa shows why the $120 it spends to win a customer can still work: $44 a week, 65% still subscribed after 12 months, and an $800 lifetime value. That is the comparison investors need, cost against value with the retention that links them.
One thing to check: $44 a week for a year is about $2,300, so an $800 lifetime value implies a margin or a period that the slide does not state. Saying whether the $800 is revenue or gross profit would remove the question.
Cost every channel
Fetch, a food ordering app piloting in Toronto, prices 11 channels in one table, from guest posts ($20 up front, 100 visits) to Facebook ads ($400 a month, 5,000 visits) to a commissioned mural ($30, 10 visits). The totals are 7,460 visits, $950 up front and $509 a month. A second table projects the result month by month: 269 customers and $1,459 spent at month 0, rising to 4,675 customers and $6,549 by month 10, so the cost per customer falls from $5.40 to $1.40.
The two tables agree: $1,459 is the $950 up front plus one month at $509, and spend then rises by $509 each month. That consistency is a good sign. What the slides do not say is that the customer counts are a forecast, not results. Any table of future months needs a clear "projected" label.
Taste still sells food
Parfait, a healthy snack brand, puts 65% of its marketing into "Experiential Marketing": sampling, in-store demos, trade shows and in-store displays. Traditional marketing gets 20% and online 15%. For a packaged food, that split is credible because trying the product is what converts shoppers. Grapevine, which sells to restaurants, plans "service industry parties at local secret dives" alongside trade press such as FSR Magazine and partners including HotSchedules.
Both slides would be stronger with a cost per tasting or event and a conversion figure: how many samples it takes to win one repeat buyer.
Make every figure readable and every claim specific
Fetch's pilot slide ends with "Estimated Acquiring Cost/Customer: $2." and the rest of the figure runs off the edge of the slide. The most important number on the slide is the one investors cannot read. Grapevine's "Growth Schedule" is a Bloomberg ranking of US metros by eateries per 10,000 people; it shows where restaurants are dense, but it has no dates or order of launch, so it is market data, not a schedule.
Freshmart's "Growth Strategy" says "We have planned an aggressive digital marketing campaign" and "Participate in various events". Miel de Tierra's marketing slide says its strategy "is to use aggressive, constant and low-cost marketing techniques across digital communication media". Neither names a channel, a cost or a result.
What to put on a food go-to-market slide
Start with one sentence on who brings you customers: an employer, a school, a chain or a store. Then list your channels with a cost and a result for each, as Fetch does. Show weekly or monthly spend per customer and how many are still ordering after a set period, as Tomato Sherpa does. If tasting is your channel, give its share of budget and what one sample event produces. Mark every forecast as a forecast, and read every number at the size investors will see it. A food go-to-market slide that does these things answers the question investors ask first: will each customer pay back what it cost to win them?
Common mistakes
No partner named. Say who brings customers in groups.
First orders only. Show how many order again.
Unpriced channels. Give a cost per channel.
Unlabelled forecasts. Mark future months as forecasts.
Cut-off figures. Read every number before sending.
Adjectives as strategy. Replace "aggressive" with a channel and a figure.
Diagnostic checklist
Partner or main channel named.
Cost per channel given.
Spend per customer and retention shown.
Lifetime value explained.
Forecasts labelled.
Every figure fully visible.
Frequently asked questions
What should a food startup's go-to-market slide show?
Who brings you customers, what each channel costs and how often customers come back. Tomato Sherpa gives $120 to win a customer, $44 a week in spend and 65% retention after a year.
Why does retention matter so much for food startups?
Each order is small, so the cost of winning a customer is only repaid if they keep ordering. That is why Tomato Sherpa puts 12-month retention beside its acquisition cost.
Is in-person sampling a credible food channel?
Yes, for packaged food. Parfait puts 65% of its marketing into sampling, demos and displays; adding what one event produces would make it stronger.
How do I show a customer acquisition forecast?
Month by month, tied to channel spend and labelled as a forecast. Fetch's table runs from 269 customers at $5.40 each to 4,675 at $1.40, and its spend matches its channel table.
How we chose these examples
Corpus: published pitch deck teardowns on StartupFundraising.com. Founder-uploaded private decks are excluded.
Selection (2026-10-01): we searched extracted slide text for go-to-market, marketing, customer acquisition, distribution and growth strategy slides in decks from food, grocery and agriculture companies. We dropped slides already used in other guides (Splash, Chick-in), a value-chain diagram that is not a go-to-market slide, and one deck not available in storage, then kept 8 slides from 8 companies. Fetch's pilot slide (slide 8) is quoted in the text but not shown.
Review: stored slide images were read on 2026-10-01 against company, deck and slide number; Tomato Sherpa, Fetch and Grapevine were read at full size, the rest at low resolution (editorial model review). No person has yet completed an editorial review of this page. We did not verify any company's costs, partners or results.