Squadle’s pitch deck is remarkably lean, consisting of only eight slides that prioritize visual impact over dense text. The deck targets the 'multi-unit industry,' valued at $4.5 trillion on slide 1, and identifies a specific $8.9 billion annual cost associated with manual record-keeping on slide 3. Despite its brevity, the deck manages to communicate a clear value proposition: replacing paper logs with digital checklists and IoT sensors. The traction slide is particularly strong, noting 80 paid pilot locations and relationships with 8 of the top 50 brands. While it lacks traditional slides f…
Key takeaways
- The deck identifies a $4.5 trillion total addressable market for the multi-unit industry on slide 1.
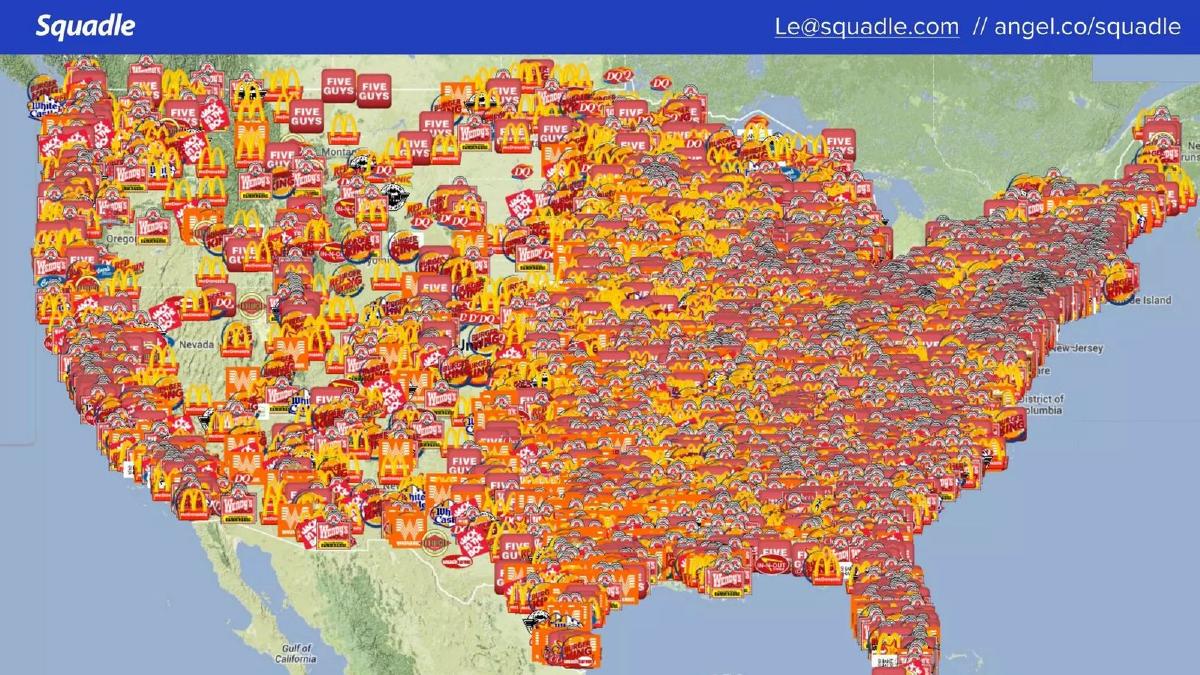
- Slide 2 uses a high-density map of fast-food logos to visually demonstrate the scale of the target market without using a single word.
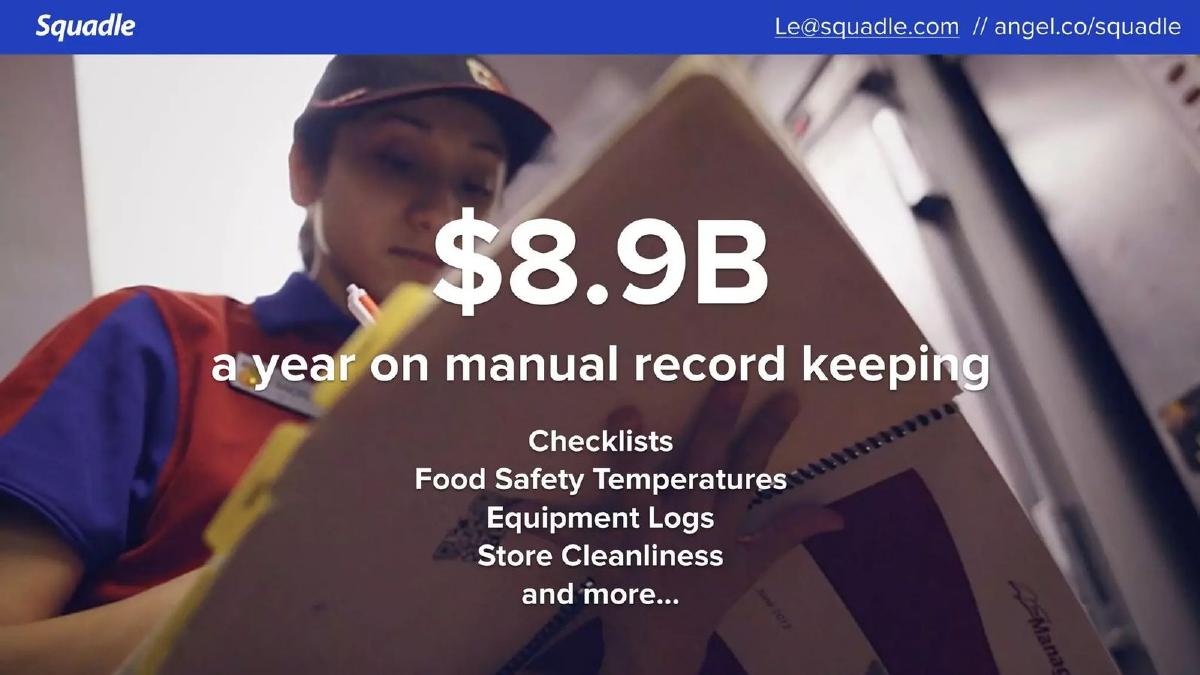
- The core problem is quantified as an $8.9 billion annual expense for manual record-keeping on slide 3.
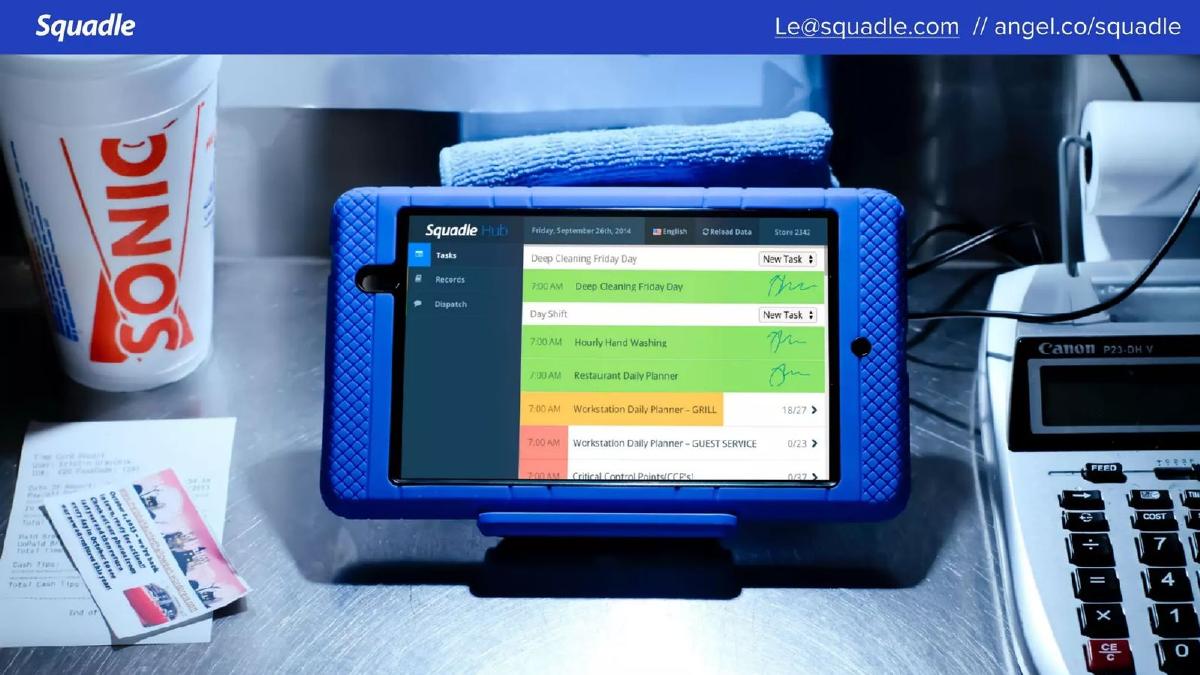
- The product solution is presented through a high-resolution image of the 'Squadle Hub' hardware in a real-world kitchen environment on slide 4.
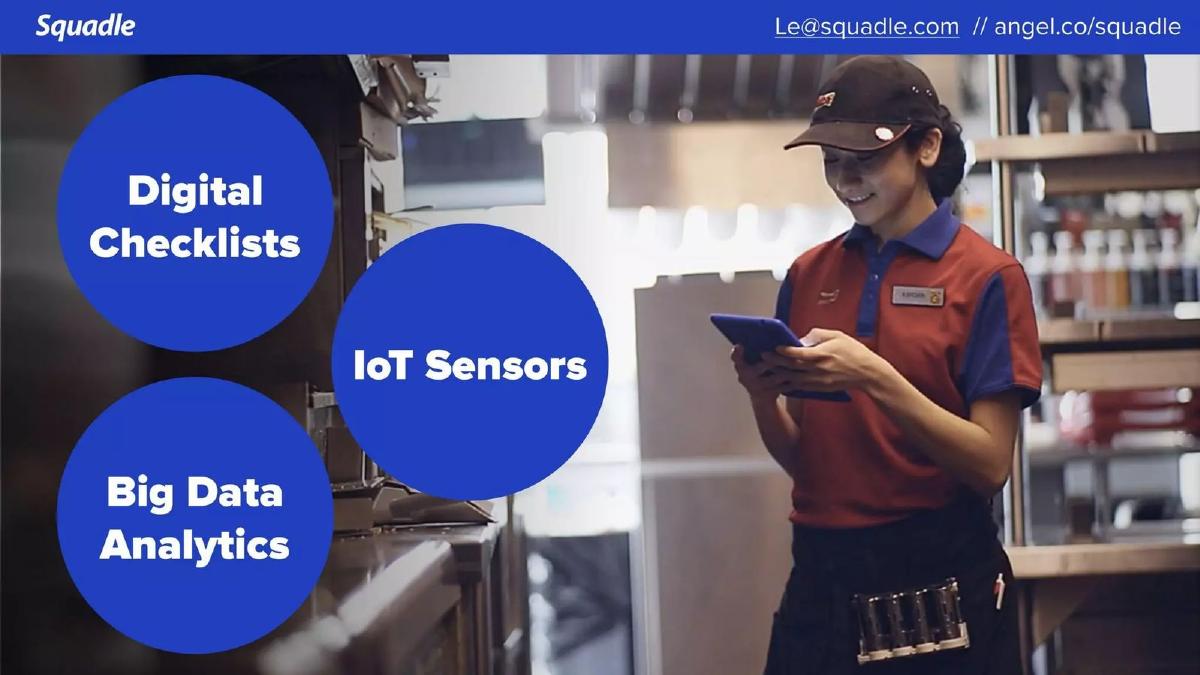
- The business model is hinted at through three pillars: Digital Checklists, IoT Sensors, and Big Data Analytics on slide 5.
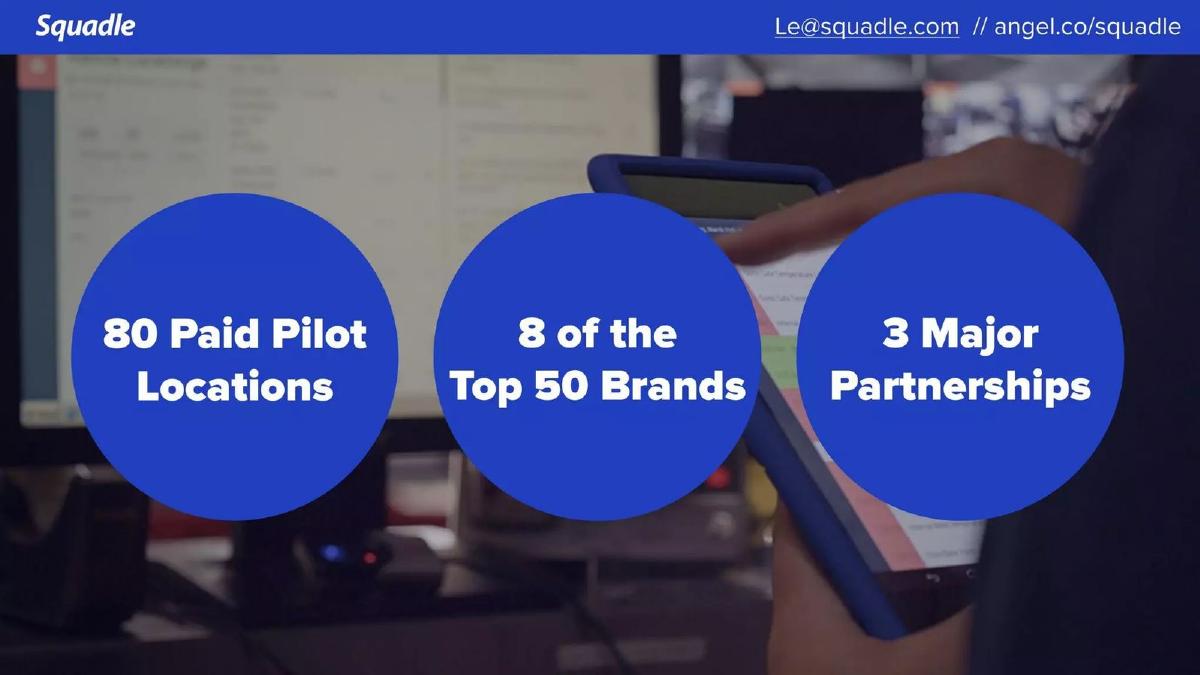
- Traction is validated by 80 paid pilot locations and 3 major partnerships as stated on slide 7.
- The team slide relies on institutional 'halo' logos like MIT, Google, IBM, and Honeywell rather than bios or titles on slide 8.
- The deck completely omits a formal 'Ask' slide, financial projections, and a competitive landscape analysis.
The Minimalist Approach to Series A Fundraising
Squadle’s pitch deck is a departure from the typical 20-slide data-heavy presentations seen in the Series A stage. With only eight slides, the company relies on the 'show, don't tell' principle. The deck was used to raise $3.8 million in 2013, a period when the Internet of Things (IoT) was beginning to find practical applications in industrial and retail settings. By focusing on the massive inefficiency of paper-based systems in the fast-food industry, Squadle built a narrative around modernization and risk mitigation.
The Market and the Visual Hook (Slides 1-2)
Slide 1: Title Slide The deck opens with a clear value proposition: 'Digital checklists and sensors for the $4.5 trillion multi-unit industry.' By naming the industry 'multi-unit,' Squadle immediately signals that their solution is built for scale. The $4.5 trillion figure is an aggressive TAM (Total Addressable Market) claim that sets a high-stakes tone for the rest of the presentation.
Slide 2: The Market Density Map This is perhaps the most effective slide in the deck. It features a map of the United States literally smothered in logos of major fast-food chains—McDonald’s, Wendy’s, Burger King, Five Guys, and Sonic. There is no text on this slide. It serves as a visual proof of the 'multi-unit' scale mentioned on the previous slide. It communicates that the opportunity isn't just large; it is ubiquitous and geographically dense. For an investor, this slide answers the 'Who is this for?' question with overwhelming clarity.
The Problem and Product Solution (Slides 3-5)
Slide 3: The $8.9B Problem Squadle moves from the broad market to a specific pain point. The slide features a worker holding a thick paper binder with the headline '$8.9B a year on manual record keeping.' It lists the specific tasks that contribute to this cost: Checklists, Food Safety Temperatures, Equipment Logs, and Store Cleanliness. This slide is crucial because it transforms a 'nice-to-have' digital tool into a 'must-have' cost-saving measure.
Slide 4: The Squadle Hub The solution is introduced via a high-quality photograph of the 'Squadle Hub' in situ. The device is shown in a rugged blue case, sitting on a stainless steel kitchen counter next to a Sonic cup and a calculator. The screen displays a clear UI with tasks like 'Deep Cleaning Friday Day' and 'Hourly Hand Washing.' This slide grounds the technology in reality, showing that the product is not just software, but a durable piece of kitchen equipment designed for a messy, high-traffic environment.
Slide 5: The Three Pillars This slide breaks down the technology stack into three simple circles: Digital Checklists, IoT Sensors, and Big Data Analytics. It explains how the company moves from simple task management (checklists) to automated data collection (sensors) and finally to actionable insights (analytics). This suggests a 'land and expand' strategy where the company starts as a utility and evolves into a data platform.
Traction and Team Pedigree (Slides 6-8)
Slide 6: Visual Context This slide is a transitional visual, showing a worker using the tablet in a kitchen setting. It reinforces the ease of use and the 'ZeroTouch' philosophy mentioned in the company's self-description, although that specific trademark isn't on the slide itself. It bridges the gap between the product description and the hard traction numbers.
Slide 7: Traction Metrics Squadle presents three key metrics: '80 Paid Pilot Locations,' '8 of the Top 50 Brands,' and '3 Major Partnerships.' For a Series A round, having 80 paid pilots with top-tier brands is a strong indicator of product-market fit. It proves that the 'Big Brands' shown on the map in Slide 2 are actually willing to pay for and test the solution. This slide provides the de-risking element that investors look for after being sold on a large vision.
Slide 8: The Team The final slide (excluding the contact repeat) focuses on the team. Rather than providing long biographies, Squadle uses the 'logo cloud' approach. They display photos of six team members flanked by logos of prestigious institutions and former employers: MIT, Google, IBM, Honeywell, Analog Devices, Leaf, Heartland, and Nanigans. This is a classic 'pedigree' slide, designed to signal that the founders have the technical and operational background to execute on a complex hardware-software play.
What Works in This Deck
Visual Storytelling: The use of the logo-saturated map on Slide 2 is a brilliant way to demonstrate market size without a spreadsheet. · Contextual Product Shots: Showing the hardware in a real kitchen (Slide 4) makes the product feel tangible and ready for deployment. · Quantified Pain: Attaching a specific dollar amount ($8.9B) to the problem of manual record-keeping gives the sales pitch immediate ROI potential. · Simplicity: The deck is devoid of jargon and complex diagrams, making it easy for an investor to digest in under two minutes.
What is Missing from This Deck
The Ask: There is no slide stating how much money is being raised or what the milestones for the next 18 months are. · Competition: The deck ignores the competitive landscape. In 2013, there were several emerging players in the digital checklist and food safety space. · Business Model: While 'Paid Pilots' are mentioned, the deck doesn't explain the pricing structure (SaaS vs. Hardware sales vs. Per-location fees). · Financials: There are no historical revenue figures or future projections, which is unusual for a Series A deck. · Unit Economics: The deck doesn't address the cost of hardware manufacturing or the LTV/CAC (Lifetime Value to Customer Acquisition Cost) ratio.
What a Founder Should Copy
The 'Logo Map' Technique: If your product serves a specific, recognizable set of customers, visually representing them on a map can be more powerful than a bar chart. · The Problem-Solution-Traction Flow: Squadle follows the most essential narrative arc: Here is a huge market (Slide 2), here is the expensive problem (Slide 3), here is our solution (Slide 4), and here is the proof it works (Slide 7). · Hardware in Context: If you are building a physical product, never show just a 3D render. Show it in the environment where it will actually be used. · Minimalist Text: Notice that no slide has more than 15-20 words. This forces the presenter to speak and the investor to listen, rather than reading ahead.
Frequently asked questions
- What is Squadle's primary product?
- Based on slides 4 and 5, Squadle provides a hardware-software hybrid solution called the 'Squadle Hub.' This includes digital checklists for tasks like hand washing and restaurant planning, integrated with IoT sensors for automated temperature monitoring and big data analytics to streamline operations for multi-unit retailers.
- How does Squadle quantify the problem it solves?
- Squadle quantifies the problem on slide 3, stating that $8.9 billion is spent annually on manual record-keeping. This includes labor costs associated with paper checklists, food safety temperature logs, equipment logs, and store cleanliness documentation.
- What kind of traction did Squadle have at the time of this deck?
- According to slide 7, Squadle had secured 80 paid pilot locations and established partnerships with 8 of the top 50 brands in the industry. They also cited 3 major partnerships, though the specific names of those partners are not listed on that slide.
- Who is the target customer for Squadle?
- The target customers are multi-unit operators. Slide 2 visually identifies these as major fast-food and quick-service restaurant (QSR) chains, including McDonald's, Wendy's, Burger King, Five Guys, and Sonic. The cover slide values this broader multi-unit industry at $4.5 trillion.
- What is missing from the Squadle pitch deck?
- This is a very minimalist deck. It lacks several standard components, including a detailed competitive analysis, a slide dedicated to unit economics or revenue models, financial projections, and a specific 'Ask' slide detailing how much capital they are raising and how it will be used.