ThoughtSpot’s deck is a high-signal enterprise presentation that focuses on the transition from legacy visualization tools to search-driven AI. The company identifies a massive gap between consumer ease-of-use (Google, Uber) and the '8 days to build a report' reality of the business world. With a heavy emphasis on technical moats—specifically their Falcon in-memory engine and SpotIQ AI—the deck demonstrates how they achieved Gartner Magic Quadrant Leader status in just six years, compared to 10-18 years for competitors. The narrative is backed by significant social proof, including 100k+ week…
Key takeaways
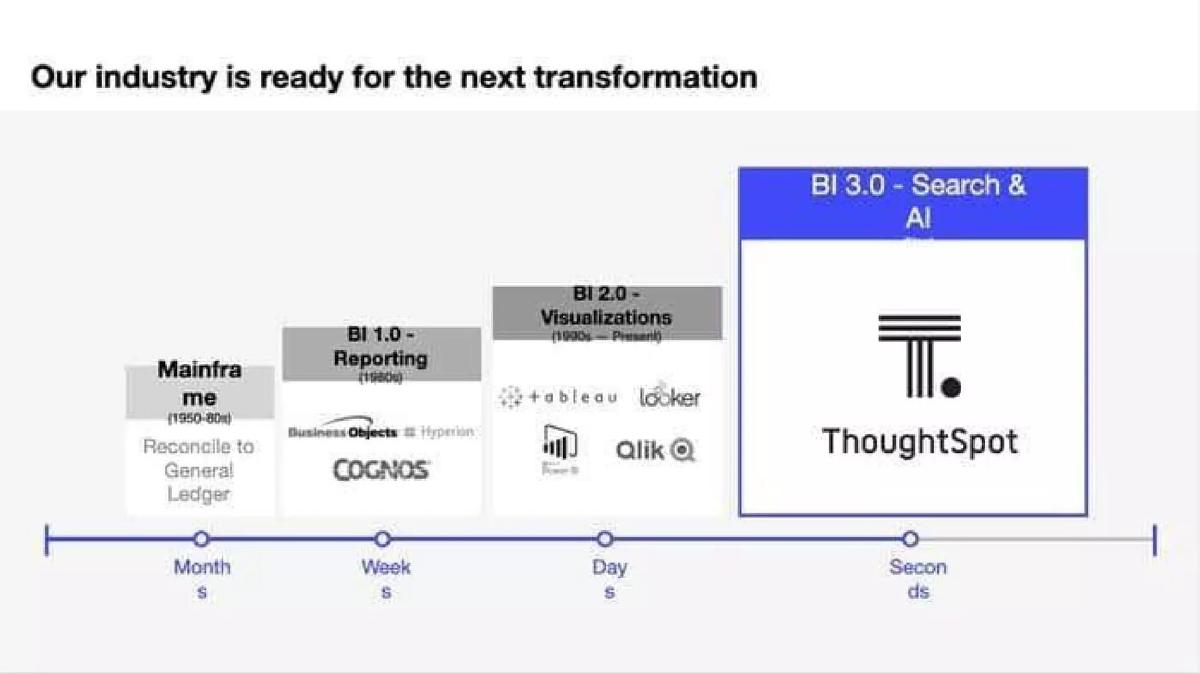
- ThoughtSpot positions itself as 'BI 3.0,' moving the industry from weeks-long reporting to second-long search results (Slide 4).
- The deck uses consumer analogies like Google, Amazon, and Yelp to set a new standard for enterprise UX expectations (Slide 6).
- Technical superiority is highlighted through the 'Falcon' engine, claiming 30X faster performance than SAP HANA at a Fortune 10 tech company (Slide 8).
- The company achieved Gartner Magic Quadrant Leader status in 6 years, significantly faster than Tableau (10 years) or Qlik (18 years) (Slide 15).
- Market opportunity is quantified with a $166B TAM, targeting $2B - $4B in revenue from a 10-20% share of the $22B SOM (Slide 16).
- A clear segmentation strategy is presented where internal sellers focus on accounts above $1B revenue, leaving the mid-market to partners (Slide 21).
- The deck highlights a 'Culture of Selfless Excellence' with a 4.7 Glassdoor rating and 100% CEO approval (Slide 20).
- Global scale is a core pillar, with 50% of R&D planned for Bangalore by the end of 2020 (Slide 21).
The Narrative: From Reporting to Searching
The ThoughtSpot pitch deck is built on a single, powerful premise: the way we make decisions in our personal lives is fundamentally different from how we make them at work. By contrasting the instant gratification of consumer apps with the bureaucratic lag of enterprise data, ThoughtSpot creates an immediate sense of urgency. The deck moves from this emotional hook into deep technical validation, proving that their 'search-driven' approach isn't just a UI skin, but a fundamental re-engineering of the data stack.
Slides 1-4: The Problem and the Evolution
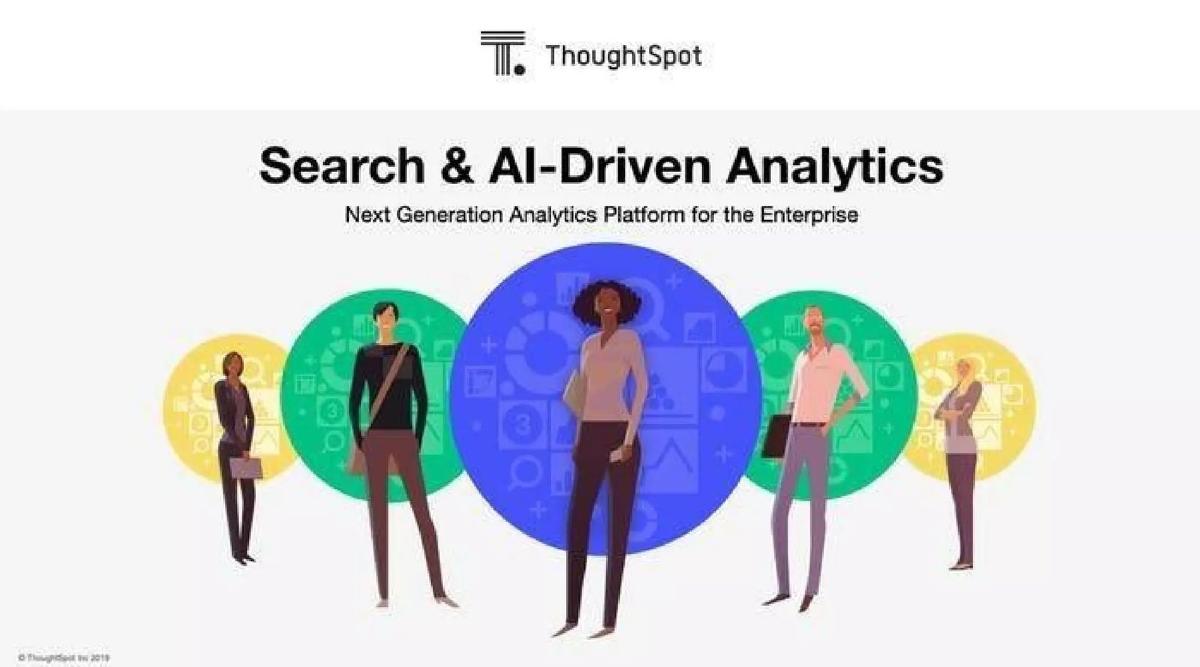
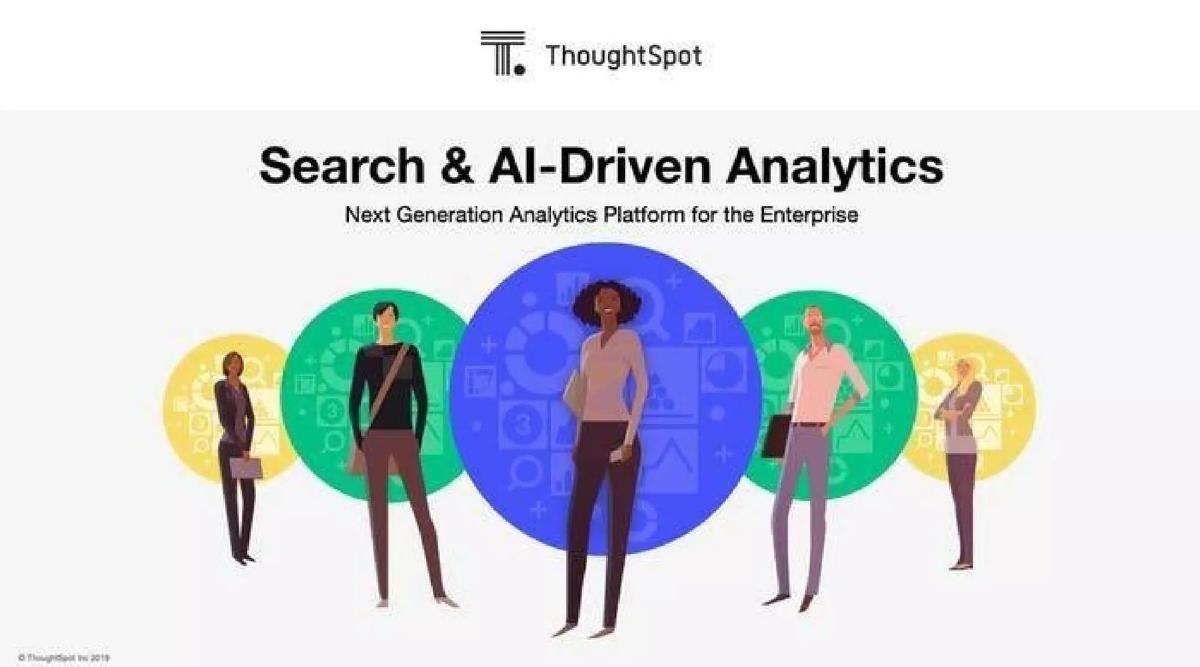
Slide 1 introduces the brand with the tagline "Search & AI-Driven Analytics: Next Generation Analytics Platform for the Enterprise." It establishes a clean, modern aesthetic that mirrors the consumer apps it intends to emulate.
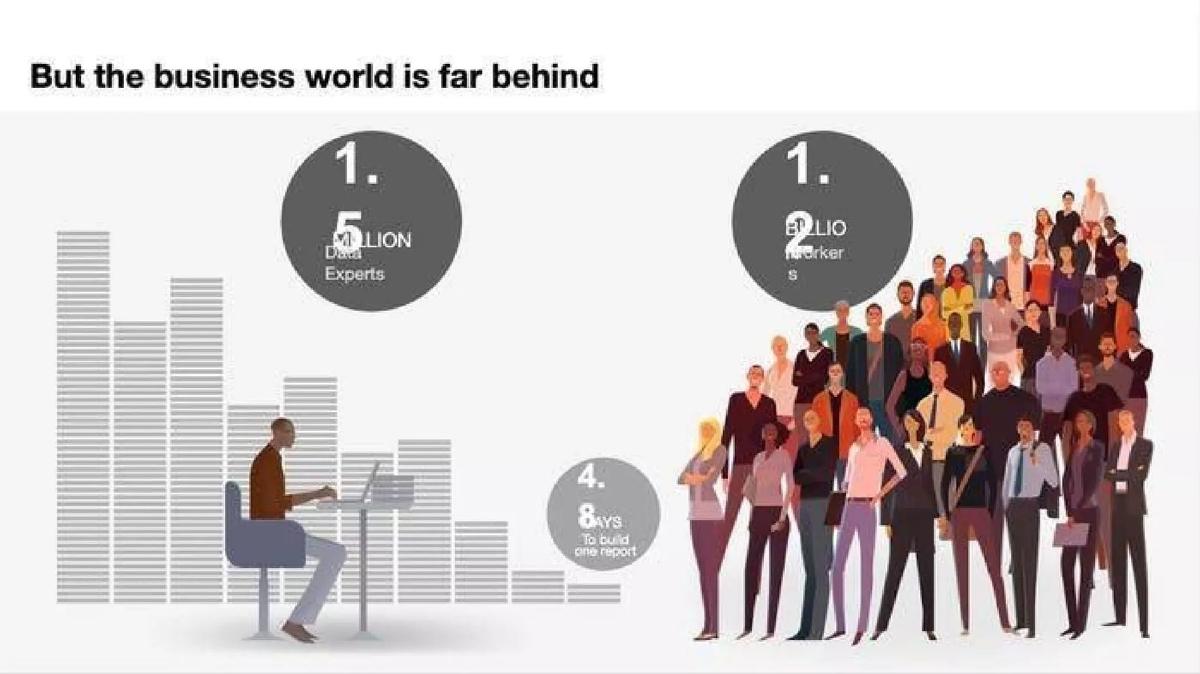
Slide 2 and Slide 3 define the "Decision Gap." Slide 2 shows icons for Google, YouTube, and Uber, labeled as "Simple," "Smart," and "Fast." Slide 3 contrasts this with the "business world," where 1.5 million data experts are overwhelmed by 1.2 billion workers, resulting in an average of 8 days to build a single report. This is a classic 'David vs. Goliath' setup, where the 'Goliath' is the reporting backlog.
Slide 4 provides the historical context. It maps the evolution of Business Intelligence from Mainframes (1950-80s) to BI 1.0 Reporting (Cognos, Business Objects) to BI 2.0 Visualizations (Tableau, Qlik). ThoughtSpot claims the mantle of "BI 3.0," shifting the time-to-insight from weeks or days down to seconds.
Slides 5-9: The Product Pillars
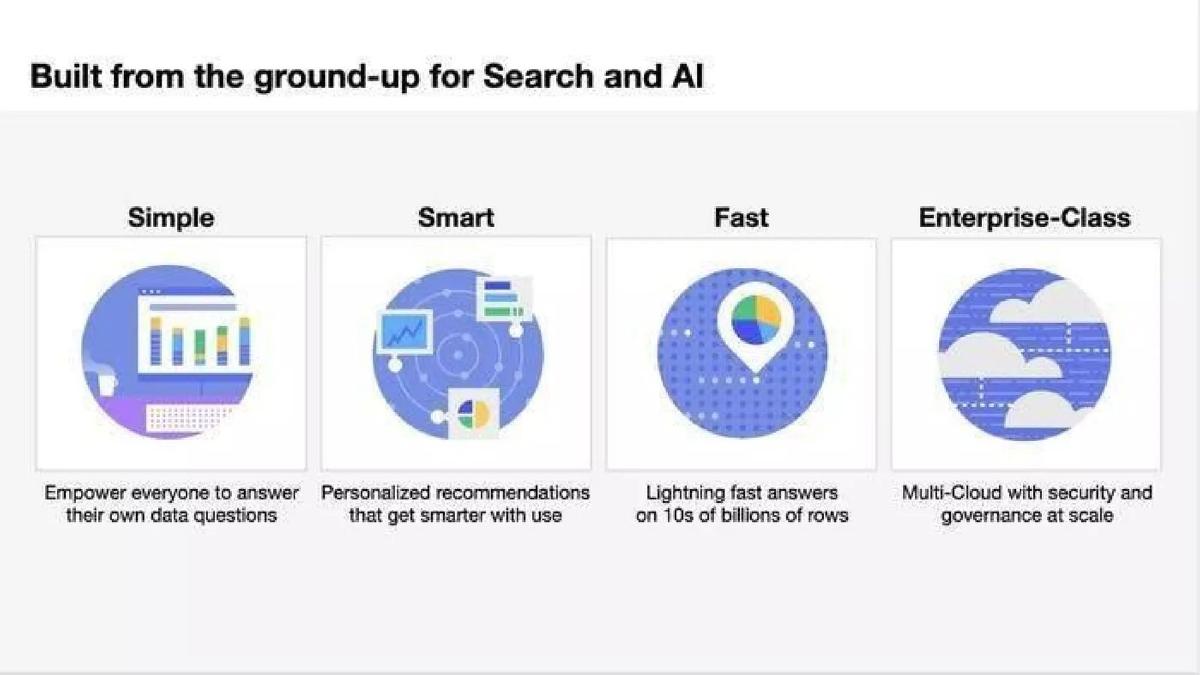
Slide 5 breaks down the platform into four core attributes: Simple, Smart, Fast, and Enterprise-Class. This structure serves as the table of contents for the next several slides.
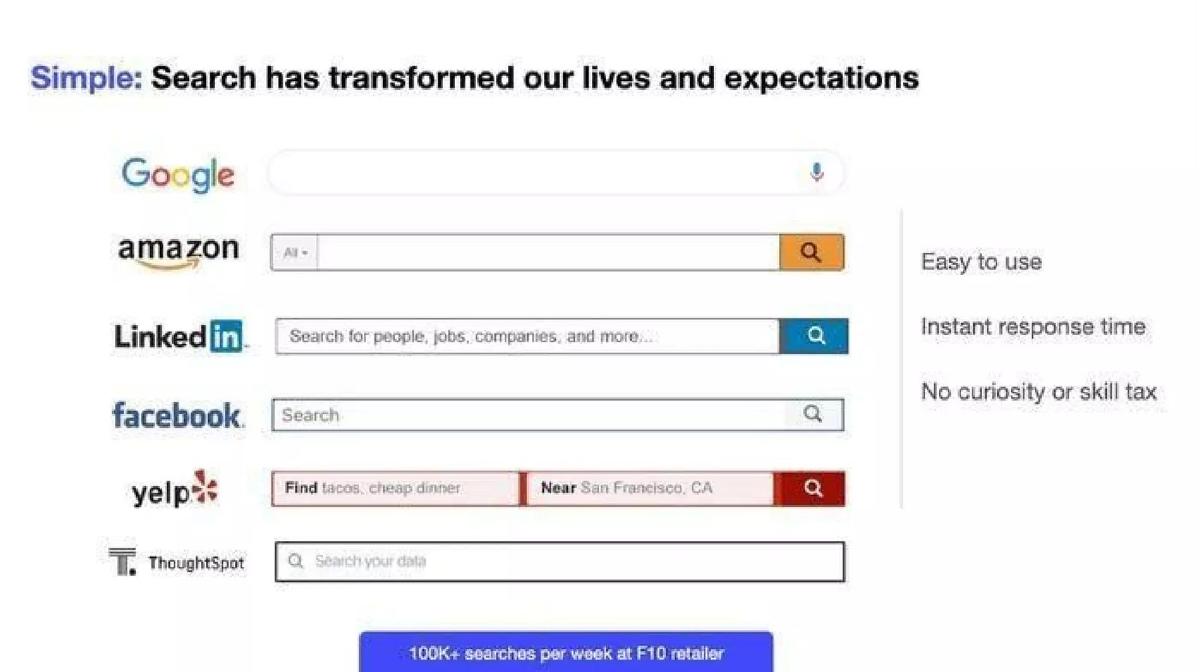
Slide 6 focuses on the "Simple" aspect. It displays the search bars of Google, Amazon, LinkedIn, Facebook, and Yelp, placing the ThoughtSpot search bar at the bottom. This is a bold positioning move, suggesting that data analysis should require "No curiosity or skill tax." A key metric is included here: 100K+ searches per week at a Fortune 10 retailer.
Slide 7 introduces "SpotIQ," the AI engine. It lists capabilities like uncovering anomalies and identifying leading indicators. The slide includes a powerful proof point: "Discovered $30M of unadjusted claims at G700 insurance company."
Slide 8 highlights the "Falcon" in-memory engine. This is the technical 'how.' It claims to be the "World's fastest number crunching machine" and notes it is "30X faster than HANA at F 10 tech company." This slide is critical for overcoming the objection that search-driven BI can't scale to enterprise data volumes.
Slide 9 addresses "Enterprise-Class" security and governance. It uses abstract visualizations to show how the platform handles complexity and scale, specifically mentioning support for 10+ business groups at a Fortune 25 financial firm.
Slides 10-14: Architecture and Brand
Slide 10 and Slide 11 detail the hybrid-cloud and cross-source capabilities. Slide 10 shows integrations with AWS, Azure, Google Cloud, and Salesforce, noting a Fortune 350 firm that integrates 18 data sources. Slide 11 emphasizes choice, showing deployments across private clouds (VMware), public clouds, and on-premises servers.
Slide 12 is a simple login screen visual, reinforcing the consumer-grade UX. Slide 13 , titled "Why this is hard to build," is a classic 'moat' slide. It shows a complex architectural stack including a Distributed Cluster Manager and an In-Memory Calculation Engine, signaling to investors that this isn't a product that can be easily replicated by a startup with a nice UI.
Slide 14 pivots to brand building. It mentions "thought.leaders" and the "BEYOND.2019" conference, suggesting that ThoughtSpot isn't just a tool, but a movement within the data industry.
Slides 15-18: Market Validation and Opportunity
Slide 15 is perhaps the most impressive in the deck. It shows the Gartner 2019 Magic Quadrant, with ThoughtSpot in the "Leader" category. The text highlights that ThoughtSpot reached this status in 6 years, compared to 10 years for Tableau and 18 years for Qlik. This is a definitive signal of product-market fit and execution speed.
Slide 16 quantifies the market. It uses a standard TAM/SAM/SOM bullseye: $166B TAM, $67B SAM, and $22B SOM. It explicitly states that a 10-20% SOM capture would result in $2B - $4B in revenue. This gives investors a clear sense of the 'exit' potential.
Slide 17 outlines the partner leverage model. It shows a pyramid where technology partners form the foundation, and management consulting partners (like McKinsey or BCG, though not named) drive enterprise adoption. It notes that the mid-enterprise business is "100% Partner-led."
Slides 18-22: Team, Culture, and Strategy
Slide 18 presents the "World-Class Team." It features CEO Sudheesh Nair and Co-Founder Ajeet Singh, both with prominent Nutanix logos, along with leaders from Google, Microsoft, and Amazon. The sheer number of executives shown (14) suggests a late-stage, well-capitalized organization.
Slide 19 details "Global Expansion." It shows sales teams in EMEA (12 teams across 5 countries) and a growing presence in APAC and India, including a $1M+ deal closed in the APAC theater.
Slide 20 focuses on culture, specifically "Selfless Excellence." It cites an Officevibe score of 7.8 and a 4.7 Glassdoor rating. This is unusual for a pitch deck but serves to reassure investors about talent retention and organizational health during rapid scaling.
Slide 21 summarizes the growth strategy: "Grow aggressively, spend responsibly." It commits to having 50% of R&D in Bangalore by the end of 2020 and reiterates the segmentation strategy where direct sellers do not touch accounts below $1B in revenue.
Slide 22 concludes with a summary of the four key pillars: massive market, transforming decision making, financial discipline, and rapid expansion. The final line, "We are here to build a lasting company," is a standard long-term vision statement.
What Works
The Consumer Analogy: By comparing themselves to Google and Uber, ThoughtSpot makes a complex technical product immediately understandable. · Speed to Leadership: The Gartner Magic Quadrant comparison (Slide 15) is a devastatingly effective way to show competitive momentum. · Hard Proof Points: Every major claim is backed by a specific "Fortune X" or "Global X" customer win or metric, which builds immense credibility. · Technical Moat: Slide 13 ("Why this is hard to build") effectively addresses the 'build vs. buy' or 'incumbent replication' risk.
What is Missing
Financial Specifics: There are no slides showing historical revenue growth, burn rate, or specific margins. While the SOM slide implies revenue potential, the actuals are omitted. · Unit Economics: For an enterprise SaaS company, metrics like CAC, LTV, and Net Revenue Retention (NRR) are standard. Their absence suggests this may be a general corporate deck rather than a specific fundraising deck. · The Ask: There is no mention of how much capital is being sought or what the specific milestones for the next round of funding are. · Competitive Landscape: While they mention Tableau and Qlik in the context of BI history, there is no direct feature-by-feature comparison or 'kill' strategy for modern competitors like Looker (which was contemporary to this deck).
What a Founder Should Copy
The 'Evolution' Slide: Slide 4 is a perfect example of how to position your company as the inevitable next step in an industry's history. · Proof in the Footer: Using the bottom of slides to drop 'micro-case studies' (e.g., "30X faster than HANA") keeps the main slide clean while providing constant validation. · The 'Decision Gap' Hook: Starting with the discrepancy between personal tech and work tech is a highly relatable way to frame a problem. · Culture as a Metric: Including Glassdoor and engagement scores (Slide 20) is a sophisticated way to show that the company is built on a solid foundation, which is increasingly important to growth-stage investors.
Frequently asked questions
- What is ThoughtSpot's core value proposition?
- ThoughtSpot provides search and AI-driven analytics for the enterprise. Their core value proposition is making data analysis as simple as a Google search, allowing non-technical business users to answer their own questions instantly rather than waiting days for data experts to build reports.
- How does ThoughtSpot compare to legacy BI tools like Tableau?
- The deck categorizes Tableau and Qlik as 'BI 2.0 - Visualizations,' which still require days to produce insights. ThoughtSpot positions itself as 'BI 3.0,' using search and AI to deliver insights in seconds. They highlight that they reached Gartner Leader status in nearly half the time it took Tableau.
- What technical moats does ThoughtSpot claim?
- ThoughtSpot cites two primary technical moats: the Falcon in-memory calculation engine, which handles tens of billions of rows with JIT-compiled queries, and the SpotIQ AI engine, which automatically uncovers anomalies and trends without manual user intervention.
- What is ThoughtSpot's go-to-market strategy?
- The company uses a bifurcated GTM strategy. Their direct sales force focuses on large enterprise 'land deals' (accounts with >$1B revenue), while they utilize a partner ecosystem of consulting firms and solution providers to capture the mid-enterprise market.
- Is there a specific funding ask in this deck?
- No, this specific version of the deck does not include a slide detailing the amount of capital being raised, the valuation, or the specific use of funds. It functions more as a corporate overview or a late-stage growth deck.