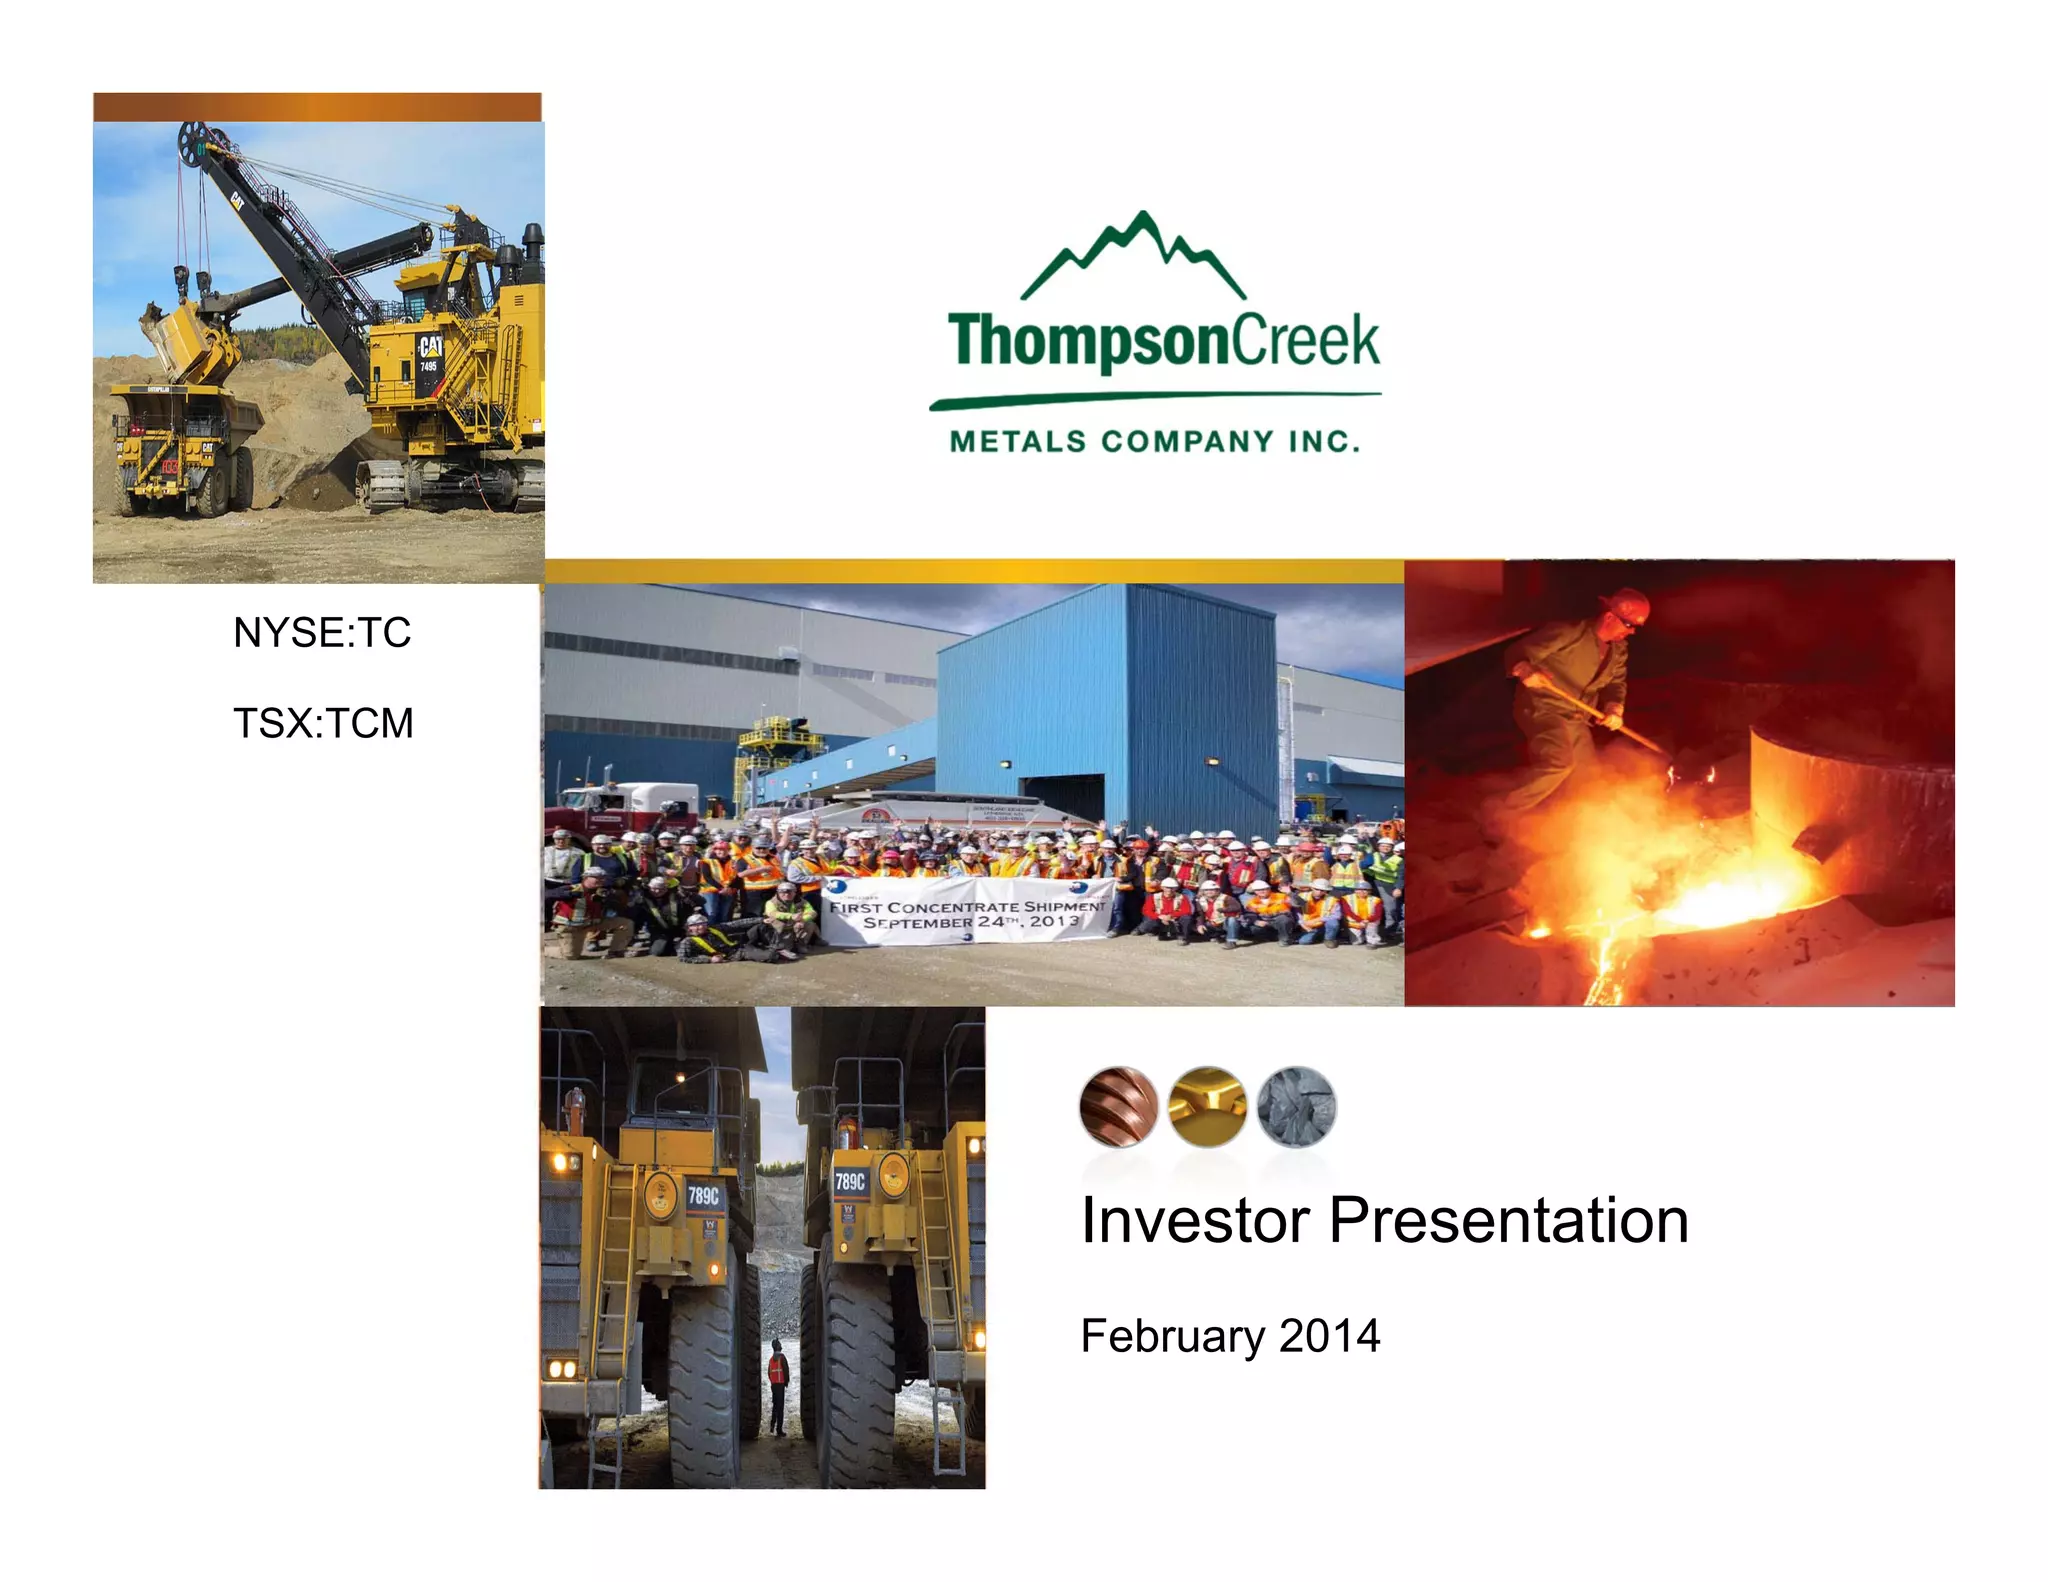
The February 2014 investor presentation for Thompson Creek Metals (NYSE:TC, TSX:TCM) captures a company navigating a high-stakes operational ramp-up. While the financial summary on slide 4 shows a staggering operating loss of $214 million for Q4 2013, the deck focuses heavily on the progress of the Mt. Milligan mine, which saw mill throughput rise from near-zero in August to nearly 40,000 tonnes per day by February (slide 19). The company reported $428.9 million in total cash capital expenditures for 2013 (slide 7), with the vast majority directed toward Mt. Milligan construction. Despite the…
Key takeaways
- The company reported a significant net loss of $211 million in Q4 2013, though this was an improvement over the $484 million loss in Q4 2012 (Slide 4).
- Capital expenditure was heavily concentrated in the Mt. Milligan project, accounting for $389 million of the $428.9 million total 2013 spend (Slide 7).
- Molybdenum production remained relatively stable throughout 2013, totaling 36.5 million pounds for the year (Slide 10).
- The realized price for Molybdenum saw a steady decline throughout 2013, ending the year at $10.11 per pound (Slide 10).
- Mt. Milligan's mill throughput showed consistent growth, reaching approximately 38,000 tonnes per day by early February 2014 against a design capacity of 60,000 (Slide 19).
- Proven and probable reserves are diversified across Copper (2.1 billion lbs), Gold (6.0 million oz), and Molybdenum (197.9 million lbs) (Slide 22).
- Copper production costs are presented under two methodologies: By-Product ($7.34/lb) and Co-Product ($5.11/lb) for Q4 2013 (Slide 13).
- The deck includes extensive non-GAAP reconciliations to explain the impact of fixed asset impairments and foreign exchange losses on net income (Slide 25).
Executive Summary: A Public Market Progress Report
The February 2014 investor presentation for Thompson Creek Metals is a classic example of a mid-tier mining company transition deck. At the time, the company was moving from a primary focus on molybdenum to a diversified producer profile through the commissioning of the Mt. Milligan copper-gold mine. The deck is data-heavy, focusing on operational throughput, reserve estimates, and complex financial reconciliations necessary for a publicly traded entity (NYSE:TC) reporting significant GAAP losses.
Slide 1: Title and Visual Context
The cover slide establishes the industrial scale of the company. It features the Thompson Creek Metals Company Inc. logo alongside high-resolution imagery of heavy machinery (Caterpillar 7495 shovels and 789C haul trucks), a smelting facility, and a group photo of the workforce celebrating the "First Concentrate Shipment" on September 24, 2013. The inclusion of both NYSE and TSX tickers immediately identifies this as a public market communication.
Slide 4: Financial Summary Q413 vs Q412
This slide provides a high-level comparison of key financial metrics. Revenue for Q4 2013 was $117 million, up from $99 million in Q4 2012. However, the slide highlights significant losses: an operating loss of $214 million and a net loss of $211 million for the quarter. While these figures are substantial, the company points out that they represent an improvement over Q4 2012, where the operating loss was $541 million and the net loss was $484 million. The slide also notes an "Adjusted Net Loss" of $29 million, signaling to investors that one-time impairments are driving the larger GAAP figures.
Slide 7: Cash Capital Expenditures
Slide 7 breaks down where the company’s cash was deployed in 2013. The total expenditure was $428.9 million. The concentration of risk and capital is clear: $389.0 million (90.6% of total spend) went directly into Mt. Milligan construction. Other expenditures included $18.1 million for permanent operations residences and $12.0 million for Mt. Milligan operations. All other company operations combined accounted for only $9.8 million in capital spend, emphasizing that the company's future was entirely leveraged against the success of the Mt. Milligan project.
Slide 10: Molybdenum Sales and Production
This slide focuses on the company's legacy asset performance. Total molybdenum sales for 2013 reached $400.8 million on production of 36.5 million pounds. The data shows a concerning trend in realized prices: the average price per pound started at $11.87 in Q1 and fell to $10.11 by Q4. Despite production increasing in the final quarter (9.7 million lbs vs 8.3 million lbs in Q3), the revenue did not scale proportionally due to the declining commodity price environment.
Slide 13: Copper Operating Statistics
With Mt. Milligan coming online, copper metrics became a vital part of the story. The slide reports 9.3 million pounds of copper payable production in Q4 2013, with 2.8 million pounds sold. The company presents two ways of looking at costs: a "By-Product" cash cost of $7.34 per pound and a "Co-Product" cash cost of $5.11 per pound. The realized sales price is noted at $3.29 per pound, which, when compared to the cash costs, highlights the early-stage inefficiency of the mine during its initial ramp-up phase.
Slide 16: Molybdenum Mine Comparison 2013 vs 2012
This slide compares year-over-year performance for the molybdenum segment. Production increased from 22.4 million pounds in 2012 to 29.9 million pounds in 2013. More importantly, the company demonstrated improved operational efficiency here; cash costs dropped from $10.09 per pound in 2012 to $6.49 per pound in 2013. However, this efficiency gain was offset by the market, as the average realized sales price dropped from $13.48 to $10.97 over the same period.
Slide 19: Mt. Milligan Daily Mill Throughput
This is arguably the most important slide for investors tracking the company's turnaround. It shows a linear ramp-up of daily mill tonnes per day (tpd). Starting from the August 2013 startup, the mill progressed from approximately 10,000 tpd in September to nearly 40,000 tpd by early February 2014. The slide explicitly marks the "Design tpd" at 60,000, giving investors a clear benchmark for what "full capacity" looks like and how much further the ramp-up needed to go.
Slide 22: Proven and Probable Reserves
Reserve slides are the bedrock of mining valuations. Thompson Creek reports 2.1 billion pounds of copper and 6.0 million ounces of gold at Mt. Milligan. The molybdenum reserves are split between the Thompson Creek Mine (122.1 million lbs) and the Endako Mine (75.8 million lbs). By providing the average grades (e.g., 0.20% Cu and 0.011 oz/t Au), the company allows analysts to model long-term yield and revenue potential based on current commodity prices.
Slides 25 & 28: Non-GAAP Reconciliations
The final slides in the sequence are technical accounting disclosures. Slide 25 reconciles the massive GAAP net losses to a much smaller adjusted net loss ($5.0 million for the full year 2013). It identifies $194.9 million in fixed asset impairments and $71.3 million in foreign exchange losses as the primary culprits for the GAAP deficit. Slide 28 provides further granular detail on unit costs per pound, accounting for refining, transportation, and by-product credits. These slides are intended to prove that the underlying business is closer to break-even than the headline earnings reports suggest.
What Thompson Creek Metals Does Well
The deck excels at transparency regarding operational ramping. Slide 19, showing the month-by-month throughput of the Mt. Milligan mill, is exactly what institutional investors need to see during a commissioning phase. It replaces vague promises of "progress" with a hard metric against a design capacity goal. Furthermore, the company does not shy away from the declining price of molybdenum, presenting it clearly alongside production gains to show the market-driven headwinds they are facing.
Omissions and Weaknesses
The most glaring omission in this 10-slide selection is a clear discussion of the balance sheet and debt maturity. While the deck mentions massive capital expenditures and net losses, it does not show the company's liquidity position or how it intended to service the debt taken on to build Mt. Milligan. In a high-CAPEX industry, the "Ask" or the "Source and Use of Funds" for the next 12 months is critical, yet it is absent here. Additionally, there is no slide dedicated to the management team's track record in bringing mines to full capacity, which is a significant risk factor during a ramp-up.
Lessons for Founders
Founders in capital-intensive industries (like hardware, manufacturing, or energy) should study how Thompson Creek uses "Adjusted" metrics. While you must report GAAP numbers, providing a clear bridge (as seen on Slide 25) that strips out one-time setup costs or non-cash impairments allows you to tell a story of operational health that might be obscured by heavy initial investment. Additionally, the use of a "Design Capacity" benchmark (Slide 19) is a powerful tool for any startup in the scaling phase; it defines success not just by where you are, but by how much of the "engineered potential" you have unlocked.
Frequently asked questions
- What was the primary driver of Thompson Creek's capital spending in 2013?
- According to slide 7, the primary driver was the construction of the Mt. Milligan mine. Out of a total cash capital expenditure of $428.9 million, $389 million was dedicated specifically to Mt. Milligan construction. Additional funds were allocated to permanent operations residences and general operations at the site, leaving less than $10 million for all other company operations.
- How did the company's molybdenum production perform relative to market prices?
- Slide 10 shows that while production was consistent—peaking at 9.7 million pounds in both Q2 and Q4 of 2013—the average realized price per pound fell significantly. The price dropped from $11.87 in Q1 to $10.11 in Q4. This resulted in total annual sales of $400.8 million, with the highest revenue quarter being Q2 ($112.7 million).
- What is the status of the Mt. Milligan mine's operational capacity?
- Slide 19 illustrates the 'ramp-up' phase of the Mt. Milligan mill. Starting from zero throughput in August, the facility reached roughly 38,000 tonnes per day (tpd) by the first half of February 2014. The slide notes a design capacity of 60,000 tpd, indicating the mine was operating at approximately 63% of its intended scale at the time of the presentation.
- How does the company account for its significant financial losses?
- The company utilizes non-GAAP reconciliations (Slide 25) to show that much of the reported net loss is tied to non-cash items. For example, in 2013, the company recorded a fixed asset impairment of $194.9 million. When adjusting for these impairments, tax benefits, and foreign exchange fluctuations, the 'Adjusted Net Loss' for the full year 2013 was narrowed to $5.0 million.
- What are the company's total mineral reserves?
- As of December 31, 2013, slide 22 lists proven and probable reserves of 2.1 billion pounds of Copper and 6.0 million ounces of Gold, both located at the Mt. Milligan Mine. Molybdenum reserves totaled 197.9 million pounds, split between the Thompson Creek Mine (122.1 million lbs) and the Endako Mine (75.8 million lbs).