How startups present partnerships in a pitch deck: what each partner commits, why the partner benefits, and when a partner logo is really a customer.
Partnerships Slide: Real Pitch Deck Examples
Twelve slides, shown in full, compare how startups present the companies they work with, whether an investor could tell what each partnership is worth, and how much revenue can actually be traced to partners.
TL;DR
A partnerships slide should say, for each partner, what was signed, what the partner commits (money, orders, distribution, assets) and why the partner benefits. The strongest examples below put the commitment on the slide: Arrival lists UPS orders for 10,000 vehicles and €100 million from Hyundai and Kia; Bid Away counts the hotels each partner brings; Canada Jetlines lists the manuals, aircraft and support its partner contributes. The weakest show categories of partner without naming any (Elwafeyat). If the partner pays you, it is a customer; put it on the customer slide, as Included Health's employer page effectively does.
Once partners are live, the question becomes what they bring in. Keep four stages apart: partners signed, customers referred, deals closed through the partner, and revenue you can attribute to the partner, with the period and what counts. None of the slides below discloses revenue attributable to a named partner: Beam Dental gives a product-line share of ARR (bundled cover supplied by partners), with actual and projected years marked; Amify's "Amazon Partner" is its own sales model; BusRight folds referrals into website traffic; Bliinx gives channel figures for every route except partners; Meta Innovations' partner revenue is a six-month forecast.
Partnership slides from real pitch decks
Each example shows the exact stored slide above its analysis and links to the full teardown. Figures are the companies' own claims. Stage and year are given only where the slide states them.
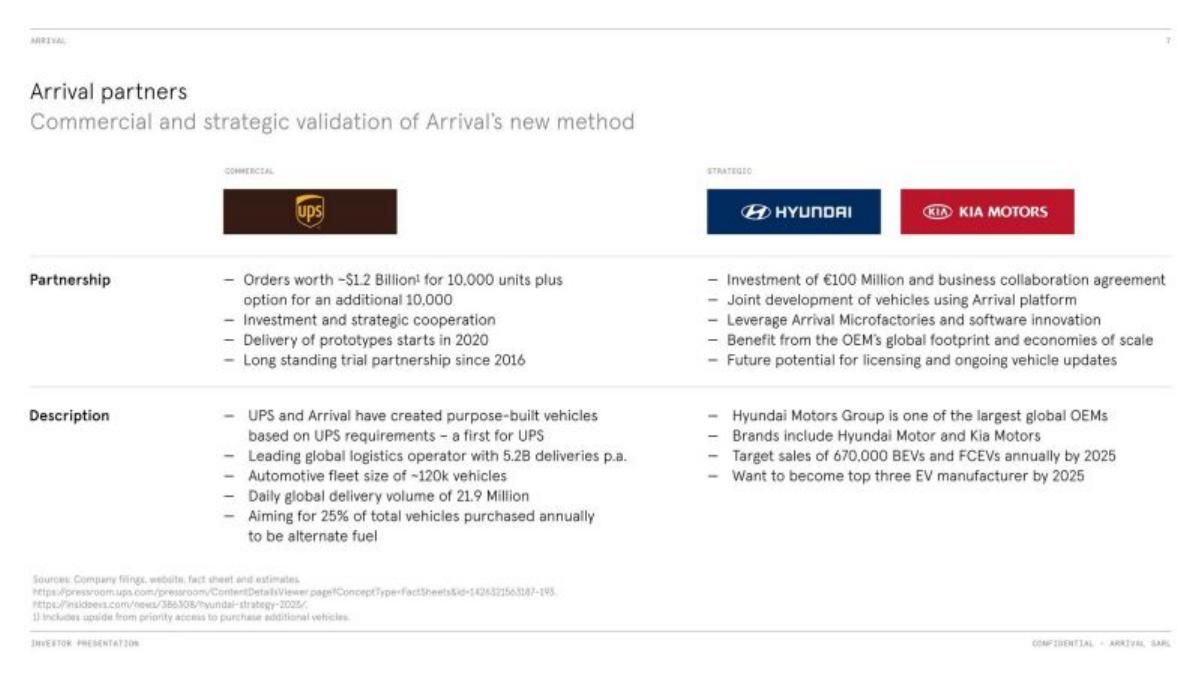
Arrival partnerships slide — slide 6
Electric vehicle maker. The slide cites delivery of prototypes starting in 2020.
Arrival deck, slide 6. Exact stored slide matched to this analysis.
Our analysis: Each partner gets a row for what was agreed and a row for who the partner is, and the slide says which partnership is commercial and which strategic. The footer cites sources.
Evidence and limitation: The order value includes an option (the footnote says it includes upside from priority access). Separate firm orders from options on the slide itself.
What a founder can adapt: Use two rows per partner: what they committed, and why their scale matters to you.
Supporting analysis
What the deck claims: "Arrival partners: commercial and strategic validation of Arrival's new method". Two columns. Commercial, UPS: orders worth about $1.2 billion for 10,000 units plus an option for another 10,000, investment and strategic cooperation, prototypes from 2020, trial partnership since 2016; UPS's fleet size and delivery volume. Strategic, Hyundai and Kia: €100 million investment and collaboration agreement, joint development on Arrival's platform, future licensing potential; Hyundai's sales targets. Sources are listed in the footer.
Presentation choice: Each partner gets a row for what was agreed and a row for who the partner is, and the slide says which partnership is commercial and which strategic. The footer cites sources.
When it does not fit: The order value includes an option (the footnote says it includes upside from priority access). Separate firm orders from options on the slide itself.
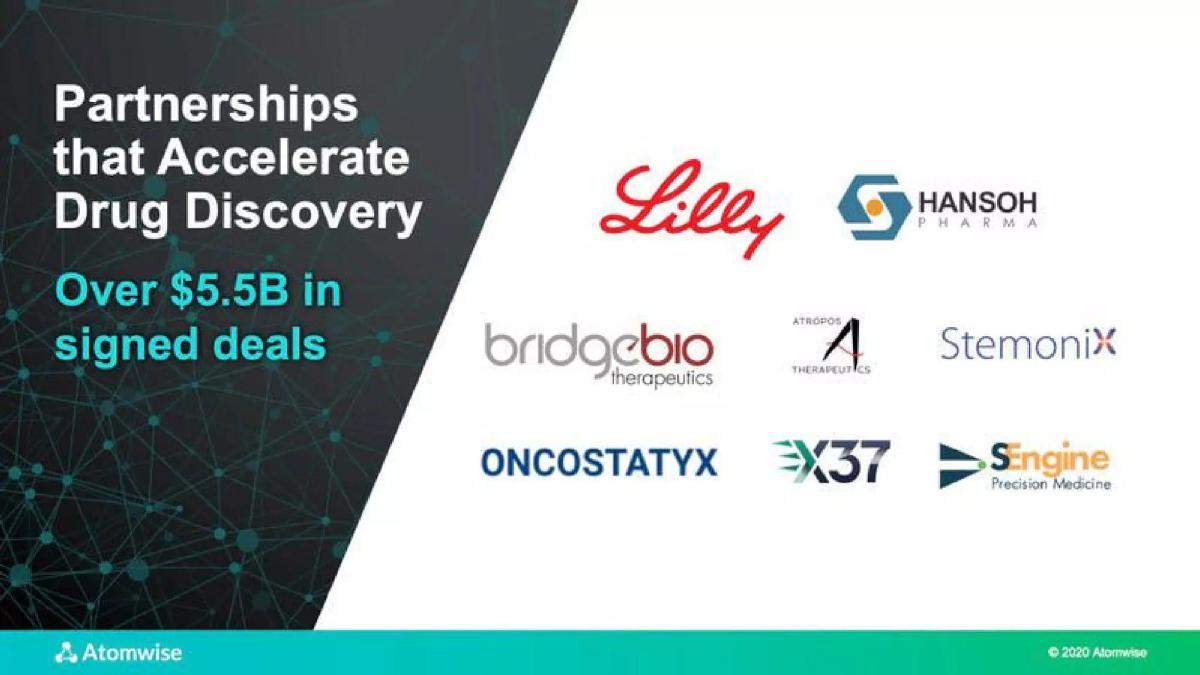
Atomwise deck, slide 3. Exact stored slide matched to this analysis.
Our analysis: One headline number and recognisable pharma names establish that large companies pay for the platform.
Evidence and limitation: The total isn't broken down. Biotech deal values usually include milestone and royalty payments that may never be paid; state upfront and received amounts separately, and say which logos are joint ventures rather than partners.
What a founder can adapt: If you have a pharma or enterprise logo, lead with it, and give one total.
Supporting analysis
What the deck claims: "Partnerships that accelerate drug discovery" and "over $5.5B in signed deals", beside logos for Lilly, Hanson Pharma, BridgeBio, Atropos Therapeutics, StemoniX, Oncostatyx, X37 and Sengine Precision Medicine.
Presentation choice: One headline number and recognisable pharma names establish that large companies pay for the platform.
When it does not fit: The total isn't broken down. Biotech deal values usually include milestone and royalty payments that may never be paid; state upfront and received amounts separately, and say which logos are joint ventures rather than partners.
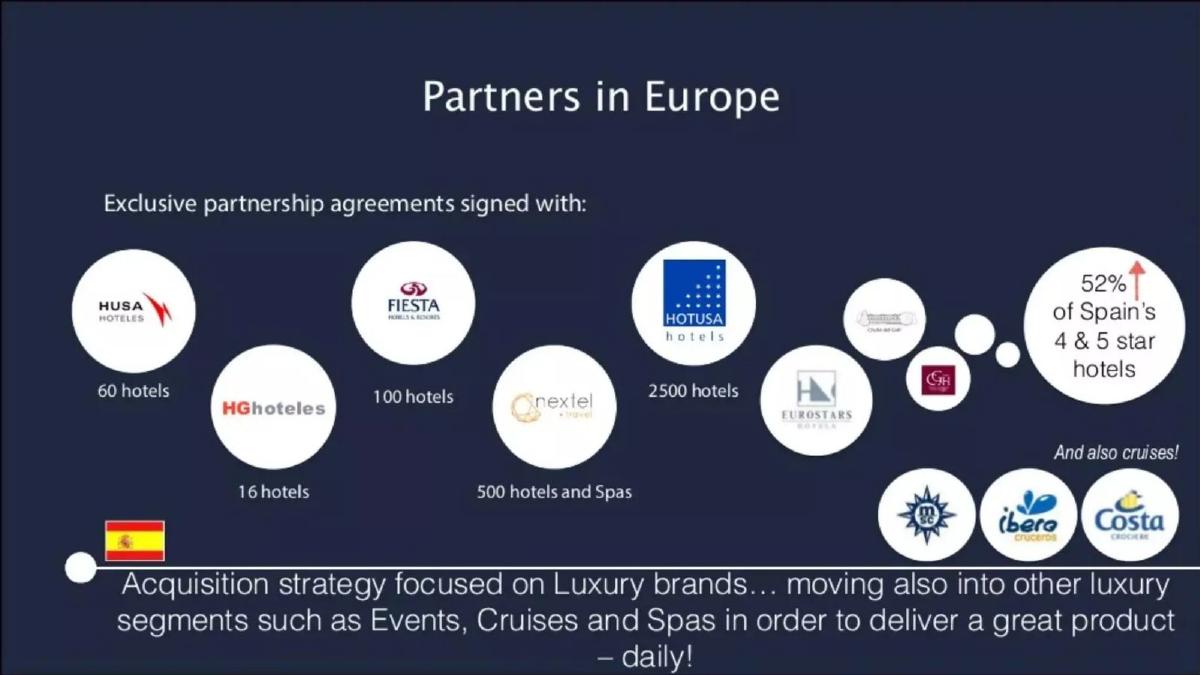
Hotel booking platform in Spain. Stage and year are not stated on the slide.
Bid Away deck, slide 3. Exact stored slide matched to this analysis.
Our analysis: It gives each partner a number, so an investor can see how much supply the agreements unlock, and says the agreements are exclusive and signed.
Evidence and limitation: The 52% share has no source and the agreements have no dates or terms. Say how long exclusivity lasts and how many hotels are live, not only signed.
What a founder can adapt: For supply partners, show how much supply each one brings.
Supporting analysis
What the deck claims: "Partners in Europe": exclusive partnership agreements signed with hotel groups, each with a count (HUSA 60 hotels, Fiesta 100, HG 16, Nextel 500 hotels and spas, Hotusa 2,500), plus cruise lines, and a callout: "52% of Spain's 4 & 5 star hotels". Footer: an acquisition strategy focused on luxury brands, moving into events, cruises and spas.
Presentation choice: It gives each partner a number, so an investor can see how much supply the agreements unlock, and says the agreements are exclusive and signed.
When it does not fit: The 52% share has no source and the agreements have no dates or terms. Say how long exclusivity lasts and how many hotels are live, not only signed.
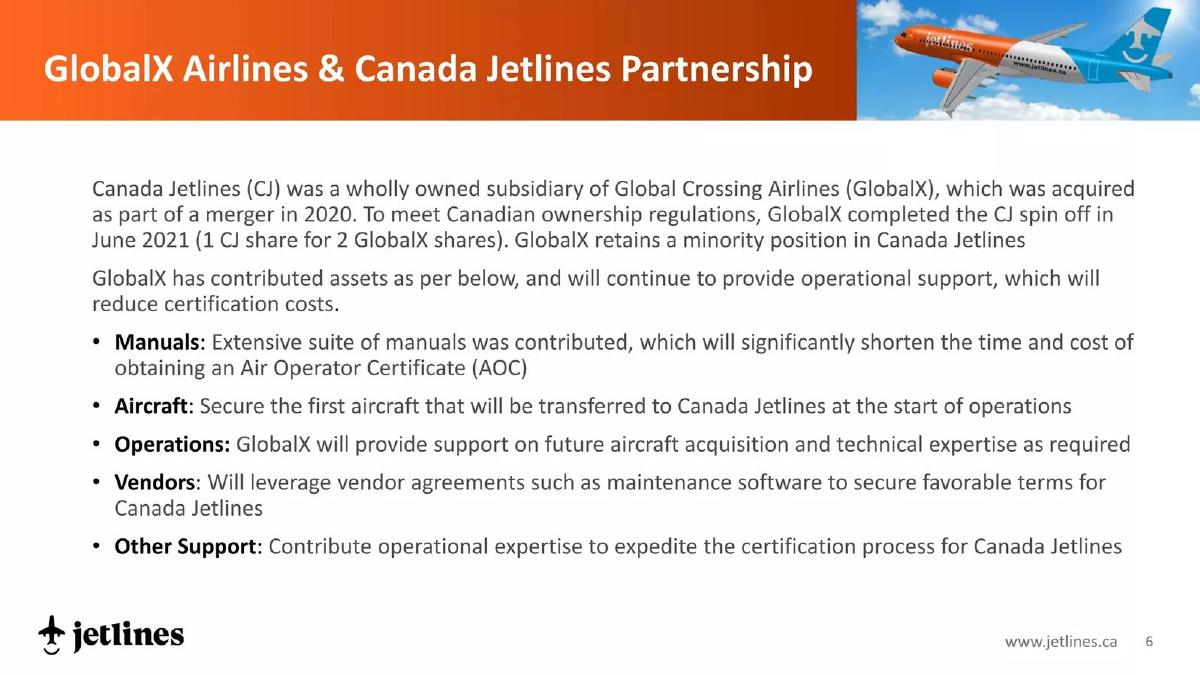
Canadian airline, spun off from GlobalX Airlines in June 2021 (per the slide).
Canada Jetlines deck, slide 6. Exact stored slide matched to this analysis.
Our analysis: It lists what the partner actually hands over and ties each item to a business result (lower certification cost, faster start).
Evidence and limitation: The partner is also a shareholder, which should be stated as a possible conflict. Add what Canada Jetlines gives in return.
What a founder can adapt: List the partner's contributions and what each saves you in time or money.
Supporting analysis
What the deck claims: "GlobalX Airlines & Canada Jetlines Partnership": the history (a GlobalX subsidiary, spun off in June 2021 at 1 share for 2 GlobalX shares; GlobalX keeps a minority stake) and what GlobalX contributes: manuals to shorten certification, the first aircraft, operational support, vendor agreements and certification expertise.
Presentation choice: It lists what the partner actually hands over and ties each item to a business result (lower certification cost, faster start).
When it does not fit: The partner is also a shareholder, which should be stated as a possible conflict. Add what Canada Jetlines gives in return.
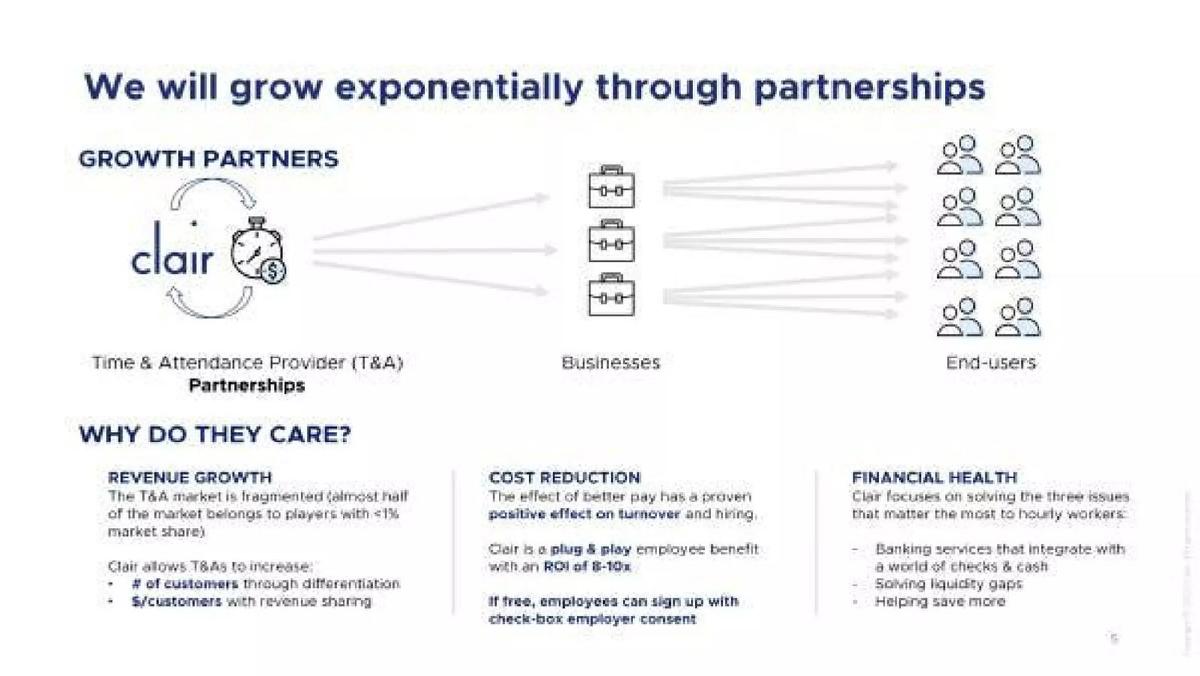
Earned-wage access for hourly workers. Stage and year are not stated on the slide.
Clair deck, slide 6. Exact stored slide matched to this analysis.
Our analysis: It explains the partner channel and why each party in it gains, which is what makes a distribution partnership believable.
Evidence and limitation: No partner is named and there is no count. "Exponentially" is a claim; show how many providers have signed and how many employers came through them.
What a founder can adapt: For a channel partner, show the path to the end customer and one reason each party joins.
Supporting analysis
What the deck claims: "We will grow exponentially through partnerships": a diagram from Clair through time-and-attendance providers to businesses to end users. "Why do they care?": revenue growth for the provider (a fragmented market; more customers through differentiation, revenue sharing), cost reduction for employers (an ROI of 8–10x is claimed) and financial health for workers.
Presentation choice: It explains the partner channel and why each party in it gains, which is what makes a distribution partnership believable.
When it does not fit: No partner is named and there is no count. "Exponentially" is a claim; show how many providers have signed and how many employers came through them.
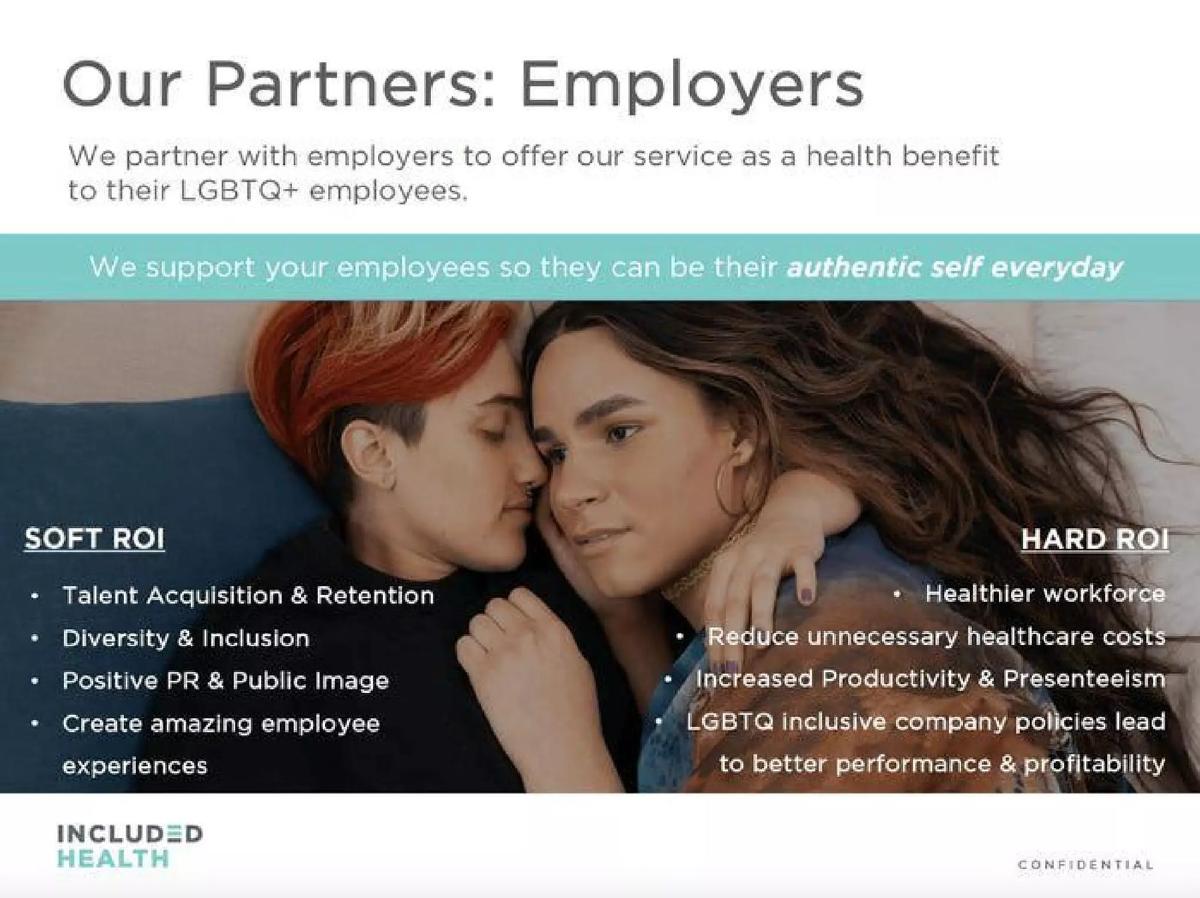
Healthcare for LGBTQ+ communities, offered through employers. Stage and year are not stated on the slide.
Included Health deck, slide 4. Exact stored slide matched to this analysis.
Our analysis: It states the buyer's reasons clearly and in two groups an HR buyer would recognise.
Evidence and limitation: Employers here are customers, not partners, and no employer is named or counted. The hard-ROI items need a figure.
What a founder can adapt: If partners are really your buyers, frame the slide as buyer value, as this does.
Supporting analysis
What the deck claims: "Our Partners: Employers": employers offer the service as a health benefit to LGBTQ+ employees. Soft ROI (talent, diversity and inclusion, public image, employee experience) and hard ROI (healthier workforce, lower healthcare costs, productivity, inclusive policies linked to performance).
Presentation choice: It states the buyer's reasons clearly and in two groups an HR buyer would recognise.
When it does not fit: Employers here are customers, not partners, and no employer is named or counted. The hard-ROI items need a figure.
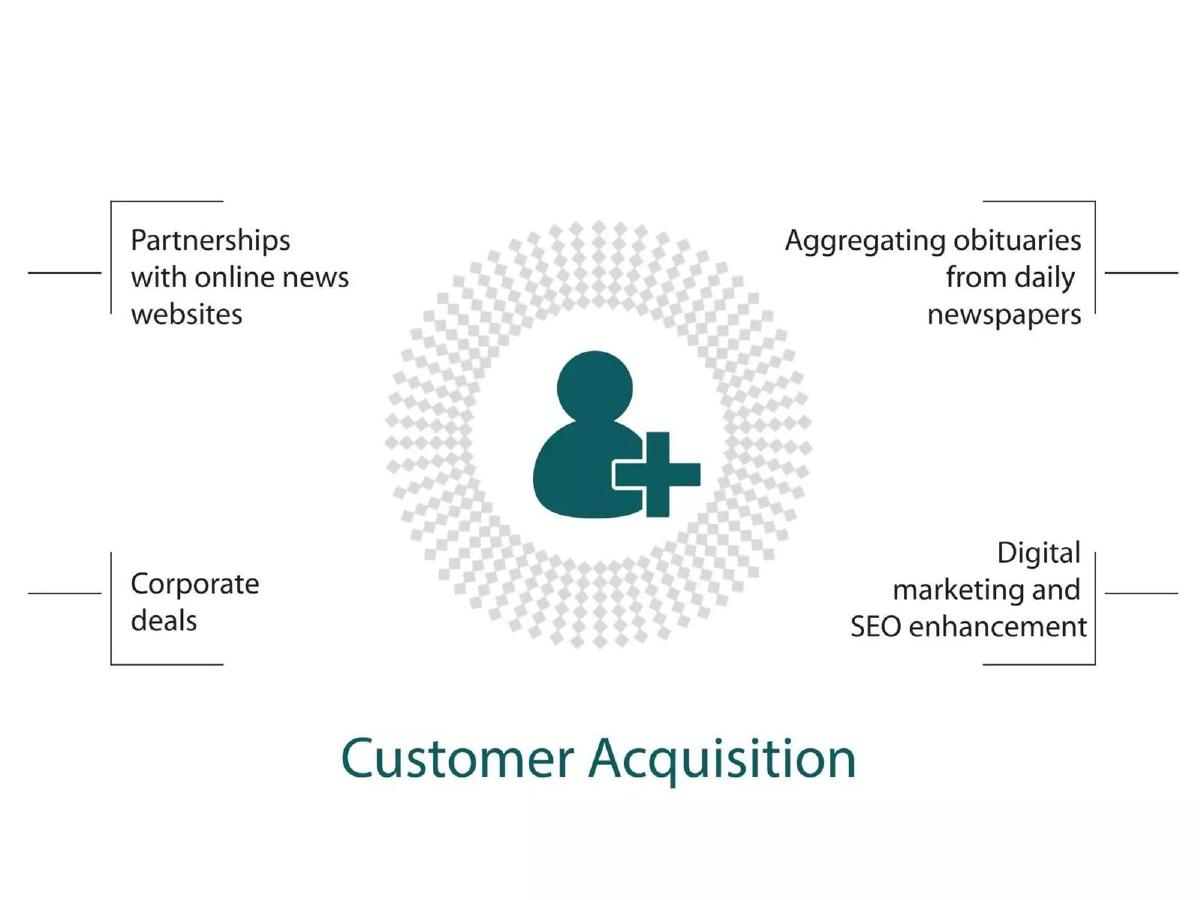
Online obituary service. Stage and year are not stated on the slide.
Elwafeyat deck, slide 5. Exact stored slide matched to this analysis.
Our analysis: It shows which channels the company plans to use.
Evidence and limitation: No partner is named, nothing is signed, and there are no numbers. As it stands, this is a marketing plan, not a partnership slide.
What a founder can adapt: Treat this as a slide to improve on. Replace each category with a named partner or a target and a status (signed, in talks, planned).
Supporting analysis
What the deck claims: A customer-acquisition diagram with four kinds of partnership: online news websites, aggregating obituaries from daily newspapers, corporate deals, and digital marketing and SEO.
Presentation choice: It shows which channels the company plans to use.
When it does not fit: No partner is named, nothing is signed, and there are no numbers. As it stands, this is a marketing plan, not a partnership slide.
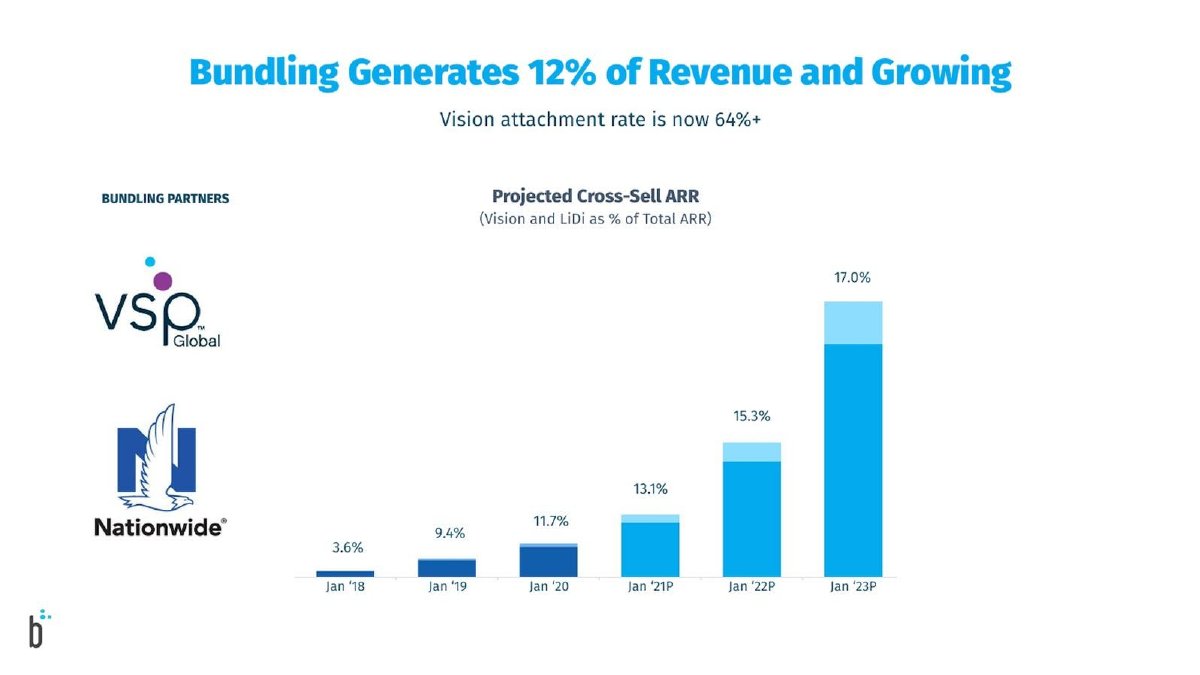
Dental benefits company that bundles vision and life/disability cover from partners. The chart runs from January 2018 to a projected January 2023.
Beam Dental deck, slide 12. Exact stored slide matched to this analysis.
Our analysis: It gives partner-linked revenue as a share of a named total, year by year, and marks projections with a P, so measured and forecast shares can be read apart. The 12% headline matches the last actual bar (11.7%).
Evidence and limitation: The headline says revenue while the chart measures ARR, and the share is by product line (vision, LiDi), not by partner, so VSP and Nationwide can't be compared. The slide doesn't say what either partner is paid.
What a founder can adapt: Show partner-linked revenue as a share of a stated total over time, and mark which points are projections.
Supporting analysis
What the deck claims: "Bundling Generates 12% of Revenue and Growing" and "Vision attachment rate is now 64%+". Bundling partners: VSP Global and Nationwide. A bar chart, "Projected Cross-Sell ARR (Vision and LiDi as % of Total ARR)": 3.6% (Jan '18), 9.4% (Jan '19), 11.7% (Jan '20), then 13.1%, 15.3% and 17.0% for Jan '21P, '22P and '23P.
Presentation choice: It gives partner-linked revenue as a share of a named total, year by year, and marks projections with a P, so measured and forecast shares can be read apart. The 12% headline matches the last actual bar (11.7%).
When it does not fit: The headline says revenue while the chart measures ARR, and the share is by product line (vision, LiDi), not by partner, so VSP and Nationwide can't be compared. The slide doesn't say what either partner is paid.
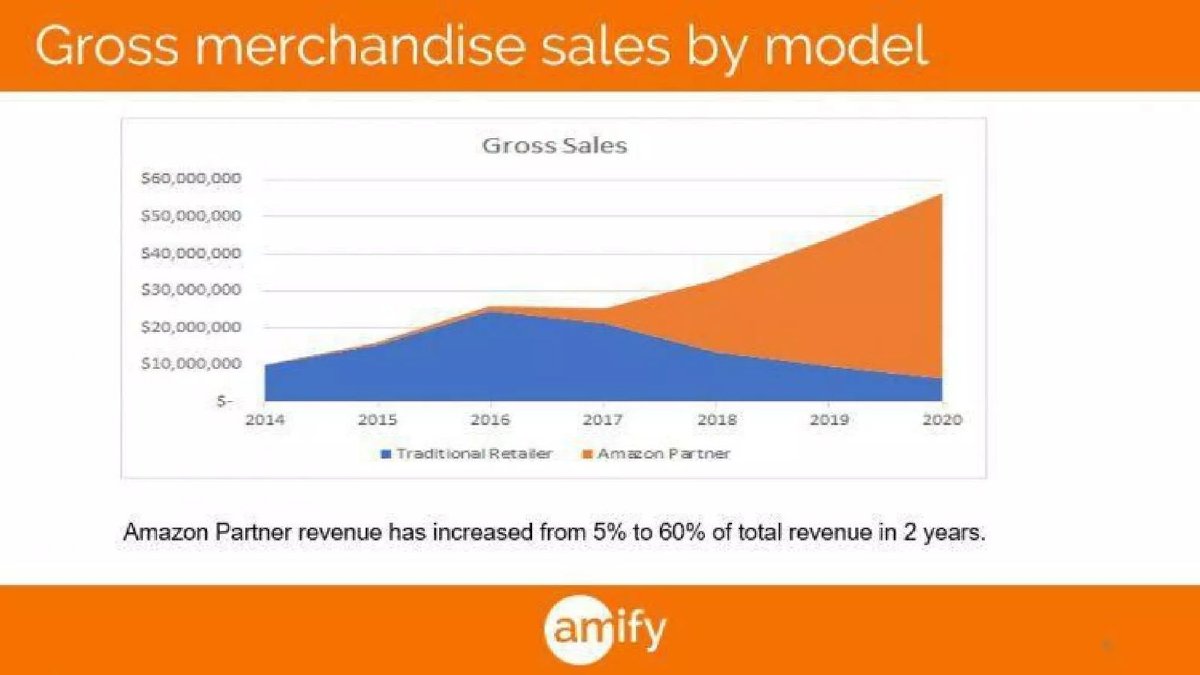
Company selling brands' products on Amazon. The chart covers 2014 to 2020; the slide does not mark which years are actual.
Amify deck, slide 8. Exact stored slide matched to this analysis.
Our analysis: Here "partner" names a sales model, not a partner that brings customers. Reading the chart approximately (our estimate, not slide figures), the Amazon Partner share is near 5% around 2016 and near 60% around 2018, which fits the caption; by 2020 it is about 90%, so the later years are probably forecasts, but the slide doesn't say.
Evidence and limitation: The caption measures revenue while the chart shows gross merchandise sales, which are different totals. Our share readings are approximate estimates from the chart, not figures on the slide.
What a founder can adapt: If "partner" is one of your own revenue models, say so, and label actual and forecast years on the chart.
Supporting analysis
What the deck claims: "Gross merchandise sales by model": a stacked area chart of gross sales split into "Traditional Retailer" and "Amazon Partner", 2014–2020, reaching roughly $55 million. Caption: "Amazon Partner revenue has increased from 5% to 60% of total revenue in 2 years."
Presentation choice: Here "partner" names a sales model, not a partner that brings customers. Reading the chart approximately (our estimate, not slide figures), the Amazon Partner share is near 5% around 2016 and near 60% around 2018, which fits the caption; by 2020 it is about 90%, so the later years are probably forecasts, but the slide doesn't say.
When it does not fit: The caption measures revenue while the chart shows gross merchandise sales, which are different totals. Our share readings are approximate estimates from the chart, not figures on the slide.
School bus routing software sold to school districts. Stage and year are not stated on the slide.
BusRight deck, slide 8. Exact stored slide matched to this analysis.
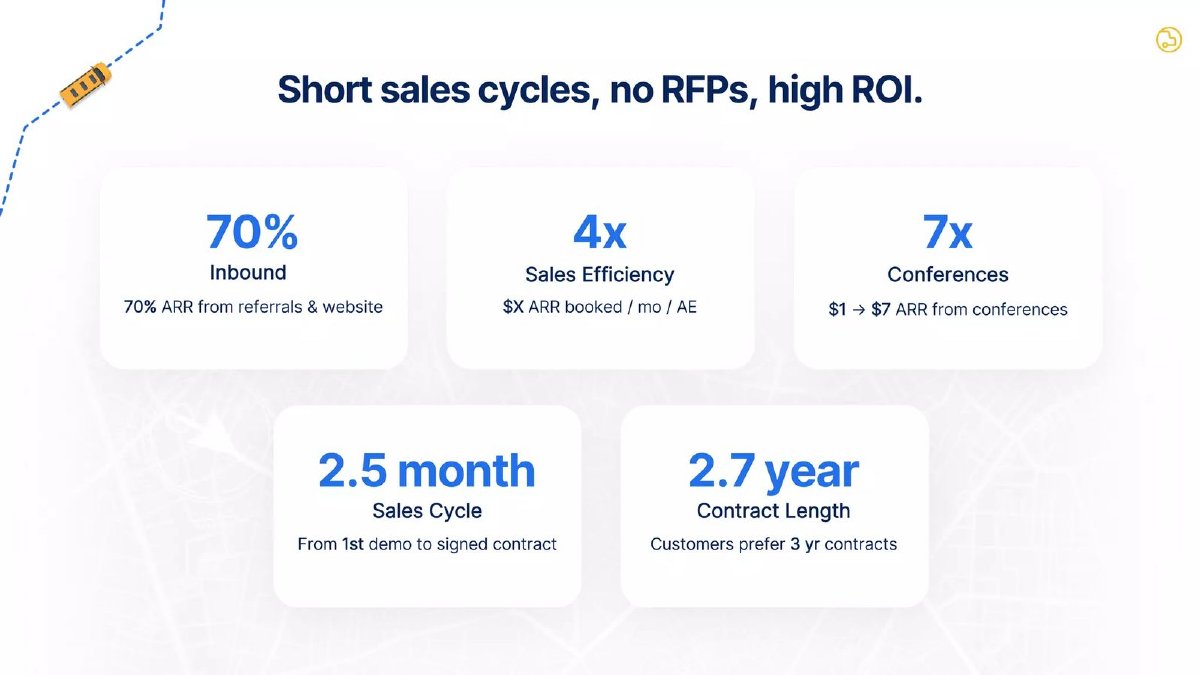
Our analysis: It ties acquisition sources to ARR rather than to leads, which is the right unit for partner attribution.
Evidence and limitation: Referrals and the website are combined in one 70%, so the referral share is unknown, and the slide doesn't say who refers (customers, partners or others). The sales efficiency figure is left as a placeholder ($X).
What a founder can adapt: If referrals matter, give them their own share of ARR, separate from your website and from paid events.
Supporting analysis
What the deck claims: "Short sales cycles, no RFPs, high ROI." Five tiles: 70% Inbound ("70% ARR from referrals & website"), 4x sales efficiency ("$X ARR booked / mo / AE"), 7x conferences ("$1 → $7 ARR from conferences"), a 2.5-month sales cycle and a 2.7-year contract length.
Presentation choice: It ties acquisition sources to ARR rather than to leads, which is the right unit for partner attribution.
When it does not fit: Referrals and the website are combined in one 70%, so the referral share is unknown, and the slide doesn't say who refers (customers, partners or others). The sales efficiency figure is left as a placeholder ($X).
Software for sales and customer-success teams. Stage and year are not stated on the slide.
Bliinx deck, slide 9. Exact stored slide matched to this analysis.
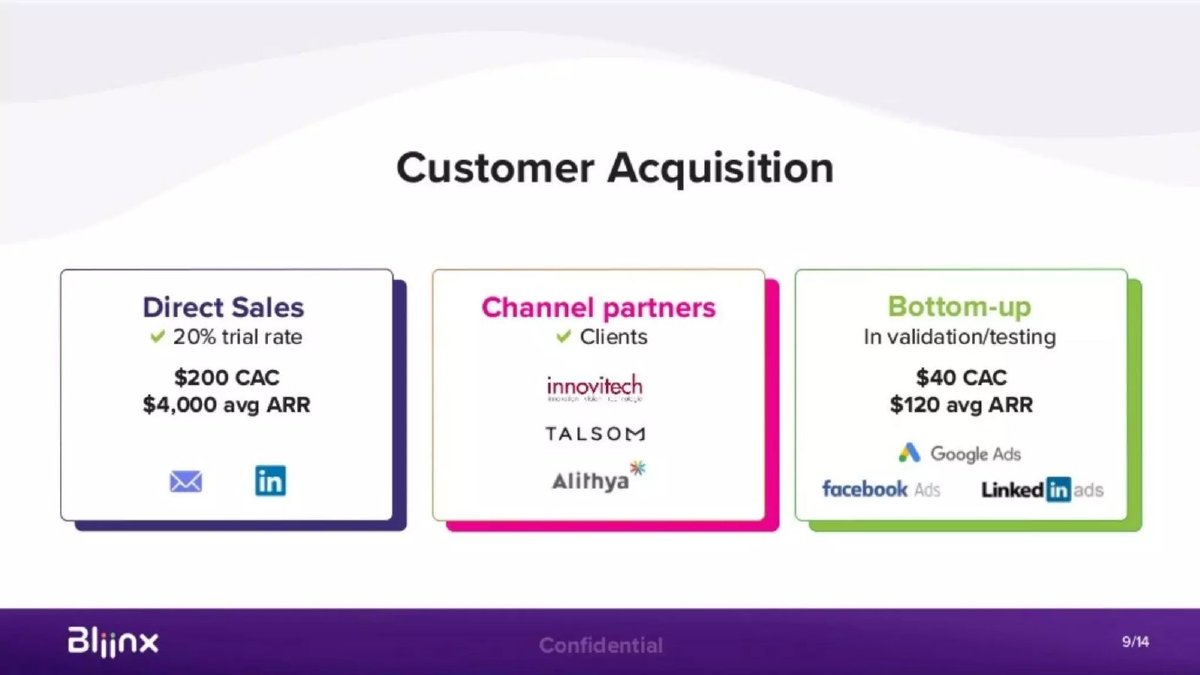
Our analysis: Putting partners next to direct and self-serve channels invites the right comparison, but only the other two columns have numbers: roughly 20 times CAC in first-year ARR for direct sales and 3 times for bottom-up, and nothing for partners.
Evidence and limitation: The partner column is only logos; it doesn't say whether they resell, refer or are simply customers. Our ARR-to-CAC ratios are calculated from the slide's figures and ignore churn and gross margin.
What a founder can adapt: Give the partner channel the same figures as your other channels: customers brought, CAC or partner fee, and average revenue.
Supporting analysis
What the deck claims: "Customer Acquisition" in three columns. Direct sales: 20% trial rate, $200 CAC, $4,000 average ARR. Channel partners: "Clients" with Innovitech, Talsom and Alithya logos. Bottom-up (in validation/testing): $40 CAC, $120 average ARR.
Presentation choice: Putting partners next to direct and self-serve channels invites the right comparison, but only the other two columns have numbers: roughly 20 times CAC in first-year ARR for direct sales and 3 times for bottom-up, and nothing for partners.
When it does not fit: The partner column is only logos; it doesn't say whether they resell, refer or are simply customers. Our ARR-to-CAC ratios are calculated from the slide's figures and ignore churn and gross margin.
Smart-home devices (bulbs, plugs, sensors) with a companion app. Year is not stated on the slide.
Meta Innovations deck, slide 5. Exact stored slide matched to this analysis.
Our analysis: The "Volume expected" column makes it a forecast, and the arithmetic checks out. Channel partners carry half of the forecast ($75,000 of $150,000) at five times Austin Energy's unit price, which is the line an investor would test first.
Evidence and limitation: No channel partner is named or counted, and the slide doesn't say whether Austin Energy and PEC have signed or why prices differ between buyers.
What a founder can adapt: When partner revenue is forecast, label it as such and show the units, price and partner count behind it.
Supporting analysis
What the deck claims: "Revenue generation (six months)": a table of customer, product, price per unit, volume expected, hardware revenue and app revenue. Austin Energy: $10 × 5,000 = $50,000. PEC: $20 × 1,250 = $25,000. Channel partners: $50 × 1,500 = $75,000. Net revenues $150,000 in hardware; apps free.
Presentation choice: The "Volume expected" column makes it a forecast, and the arithmetic checks out. Channel partners carry half of the forecast ($75,000 of $150,000) at five times Austin Energy's unit price, which is the line an investor would test first.
When it does not fit: No channel partner is named or counted, and the slide doesn't say whether Austin Energy and PEC have signed or why prices differ between buyers.
Check each partnership for names, commitment, and why the partner benefits. For the last five rows, the commitment column shows the revenue-related figure the slide states; none of them is revenue attributed to a named partner.
Example
Partner type
Partners named
Commitment stated
Partner's benefit stated
Arrival
Buyer and investor
Yes
Orders, €100M investment
Partly
Atomwise
Pharma deals
Yes
$5.5B total, not broken down
No
Bid Away
Supply
Yes
Hotels per partner
No
Canada Jetlines
Operating support
Yes
Manuals, aircraft, support
No
Clair
Distribution channel
No
None
Yes
Included Health
Buyer (employer)
No
None
Yes
Elwafeyat
Planned channels
No
None
No
Beam Dental
Bundling partners
Yes
Product-line share of ARR by year, not per partner; projections marked
No
Amify
Own sales model, not a partner channel
Amazon
Sales-model share (approximate chart reading); actual years not marked
No
BusRight
Referrals (with website)
No
70% of ARR from referrals and website combined; referral share unstated
No
Bliinx
Channel partners
Yes
None for partners (direct and bottom-up have CAC and ARR)
No
Meta Innovations
Channel partners (forecast)
No
$75,000 six-month forecast
No
Key Takeaways
Put the commitment next to the logo. Arrival's UPS column states the order (about $1.2 billion for 10,000 units plus an option) and the trial history since 2016.
Count what the partner brings. Bid Away's exclusive agreements come with hotel numbers per partner (60, 100, 500, 2,500) and a claim of 52% of Spain's 4- and 5-star hotels.
Say why the partner cares. Clair explains what a time-and-attendance provider gains (more customers, revenue sharing), which makes the channel believable.
A total needs a breakdown. Atomwise's "over $5.5B in signed deals" is striking, but most biotech partnership totals are mostly contingent milestone payments; say how much is upfront.
Define partner revenue before quoting it. "12% of revenue", "70% of ARR from referrals & website" and "Amazon Partner revenue" each measure something different; say whether partners sourced, sold or delivered the revenue, over which period, and against which total.
Name the partners. Elwafeyat's four categories (news sites, newspapers, corporate deals, digital marketing) describe plans, not partnerships.
Build your partnerships slide
For each partner, fill in all four. Drop partners where you can't.
Partner. Who is it, and is it a customer, a channel, a supplier or an investor?
Status. Signed, live, pilot or in talks? Since when?
Commitment. What does the partner commit: money, orders, distribution, supply, assets?
Their benefit. Why does the partner want this?
Attributed result. What has the partner produced so far: referrals, closed deals or revenue? Over which period, against which total, and does it count sourced, sold or delivered revenue?
Copyable framework: [Partner] ([type], [status] since [date]) commits [commitment]; they gain [benefit]; so far this has produced [result].
Illustrative example 1 — written by us
Before: Strategic partnerships with leading players across the industry.
After: [Partner] (distribution, signed [month year]) offers us to its [n] clients; [x] have signed up so far; they earn [y]% of revenue.
What improved: Our illustrative rewrite, not any company's text. It names the partner, status, commitment, benefit and result; bracketed values are placeholders.
Partners, customers and investors
A customer pays you. A partner helps you reach customers, build the product or lower your costs, and usually gets something in return. An investor owns shares. Many decks mix the three on one slide; investors will sort them anyway, so do it for them. Arrival's slide separates commercial partners (UPS, a buyer) from strategic ones (Hyundai and Kia, which invested); that label alone prevents confusion.
The customer slide guide covers customer logos and outcomes. This guide covers distribution, supply, development and co-investment partners.
Showing what partners actually bring in
A signed partner is a promise; revenue from that partner is evidence. Investors will try to work out which partnerships actually produce customers, so separate four stages: partners signed or live, customers or leads referred, deals closed through the partner, and revenue attributable to the partner. Each needs a count or amount, a period and a definition.
"Attributable" needs a stated rule. A partner can source a customer (made the introduction), sell to them (resells or bundles your product), or deliver the service (the customer buys from the partner). Say which one your figure counts, what the total is (revenue, ARR, bookings), and whether you pay the partner a fee or share. None of the slides below states all of that, so each example says what is missing.
Wasabi's go-to-market slide, covered in the go-to-market guide, is a useful reference point: "45% of revenue and rising. 100% channel in Europe and Japan." The slide does not say whether the 45% means partner-sourced or partner-sold revenue, which period it covers, or what partners are paid, so an investor would ask all three.
Revenue share figures here are the companies' own claims. The slides do not establish that any partner caused the revenue, and they do not show what partners were paid.
Common mistakes
Logos without terms. Say what each partner committed.
Customers called partners. If they pay you, put them on the customer slide.
Unbroken deal totals. Separate upfront, received and contingent amounts.
Plans shown as partnerships. Label talks and plans as such.
No reason for the partner. Investors want to know why the partner will keep going.
Undefined partner revenue. State whether it is sourced, sold or delivered by partners, the period and the total.
Forecasts shown as results. Mark projected partner revenue and projected years.
Diagnostic checklist
Every partner is named.
Each has a type (channel, supply, buyer, investor).
Each has a status and date.
The commitment is stated.
The partner's benefit is clear.
Contingent amounts are marked.
Partner revenue has a definition, period and total.
Forecast partner revenue is labelled.
Frequently asked questions
How do I show revenue that comes from partners?
Separate partners signed, customers referred, deals closed through partners and revenue attributable to partners. For the revenue figure, say whether partners sourced, sold or delivered it, the period, the total it is a share of, and what partners are paid.
How we chose these examples
Corpus: published pitch deck teardowns on StartupFundraising.com. Founder-uploaded private decks are excluded.
Selection (2026-09-24): we searched extracted text of slides 2–6 for partnership slides (titles starting with partners or partnerships, and slides mentioning partnership agreements, strategic partners or letters of intent) where a stored slide image exists, and inspected eight candidates. Seven were selected. Credibly slide 6 was excluded because it describes planned outreach with no partner.
Overlap check: the customer slide guide covers customer logos and outcomes; the go-to-market guide covers channels in general. Neither covers partnership slides.
Update (2026-09-30), partner-attributable revenue: we searched the full research text index (57,588 OCR pages from every page of eligible decks, 48,484 readable) plus the public slide text (pages 1–15) for partner, channel, reseller, referral and distributor terms near percentages, revenue, ARR or CAC. About 300 pages matched; the strongest were checked against the original deck pages. Added: Beam Dental 12, Amify 8, BusRight 8, Bliinx 9, Meta Innovations 5. Not added: Wasabi 10 (already in the go-to-market guide; discussed in the text), Brain Rap pages 6–7 (no partner revenue shown), and slides where "partner" meant an investor, a joint venture or use of funds.
Review: all seven stored slide images were inspected on 2026-09-24 and matched to company, deck and slide number (editorial model review). The five slides added on 2026-09-30 were checked against their original deck pages by AI editorial review; four images were newly saved from the public decks. No person has yet completed an editorial review of this page.
Figures are the companies' own claims and have not been verified. The note on biotech deal totals is general editorial context, not a statement about Atomwise's deal terms. We make no claim that any slide caused a fundraising outcome.