Energy Startup Business Model Slide Examples: 8 Real Pitch
How energy and charging startups explain how they make money in a pitch deck: price per kWh, revenue splits, ownership options and per-site returns.
Energy Business Model Slide: Show Who Owns the Equipment, Who Pays, and What You Keep
Energy businesses often need expensive equipment before they earn anything: chargers, solar panels, conversion units or tankers. So the business model slide has to answer two questions at once: how the company earns money, and who pays for the equipment. Investors want to know whether the startup carries the cost and keeps the revenue, shares both with a partner, or sells equipment and earns fees afterwards. This guide compares eight real energy business model slides, from a charger company that sets out four ownership options in one table to a slide titled business model that shows only market figures.
TL;DR
Show who owns the equipment, who pays for installation and power, what the customer pays and what share you keep. Blink sets out four ownership options with an $18 monthly network fee, an 8% transaction fee and a $99 subscription. Cyclectric charges $0.35 per kWh and splits revenue 80/20 or 60/40 depending on who pays to install. Galatica gives its buy and resale price per barrel. AGV gives revenue and net cash for each site. Verdis, GWF and SPI Energy list revenue sources with few or no figures, and Clear Blue's slide shows the market instead of its model.
Energy business model slides from real pitch decks
Each example shows the exact stored slide above its analysis and links to the full teardown. Slides with figures you can check come first; slides with few or no figures follow. Text is as shown on the slides; comments and arithmetic checks are ours.
Blink Charging business model slide — slide 19
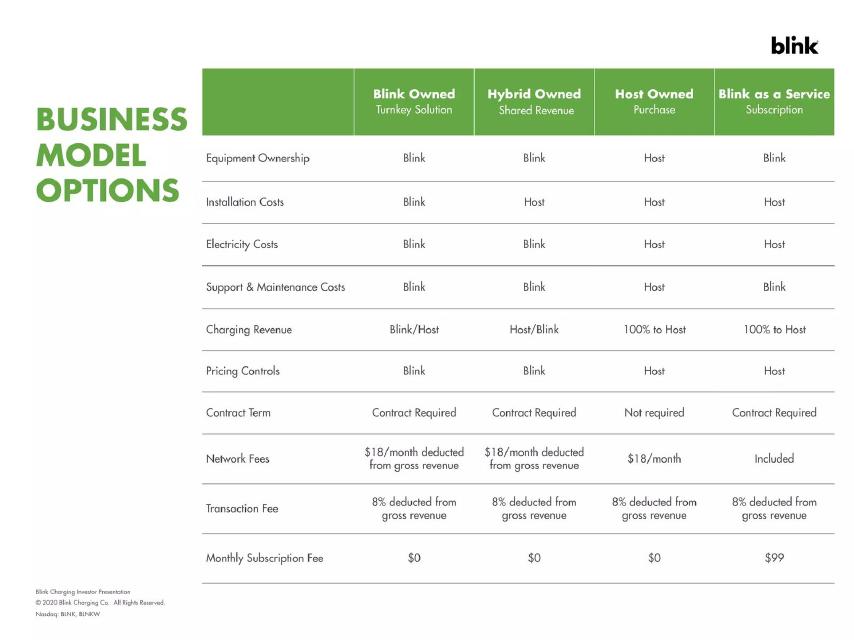
Public electric vehicle charging company; 2020 investor presentation. Slide titled "Business Model Options".
Blink Charging deck, slide 19. Exact stored slide matched to this analysis.
Our analysis: One table shows who pays for what and what Blink earns under each option.
Evidence and limitation: Company pricing.
What a founder can adapt: Lay out ownership options as columns and costs and fees as rows.
Supporting analysis
What the deck claims: Four columns: "Blink Owned (Turnkey Solution)", "Hybrid Owned (Shared Revenue)", "Host Owned (Purchase)", "Blink as a Service (Subscription)". Rows for equipment ownership, installation, electricity, support and maintenance costs, charging revenue ("Blink/Host" to "100% to Host"), pricing controls and contract term. "Network Fees": "$18/month deducted from gross revenue" (owned and hybrid), "$18/month" (host owned), "Included" (service). "Transaction Fee": "8% deducted from gross revenue" in all four. "Monthly Subscription Fee": "$0", "$0", "$0", "$99".
Presentation choice: Investors can see how much capital each option needs from Blink and what it earns in return.
When it does not fit: Leaving out how many chargers sit under each option today.
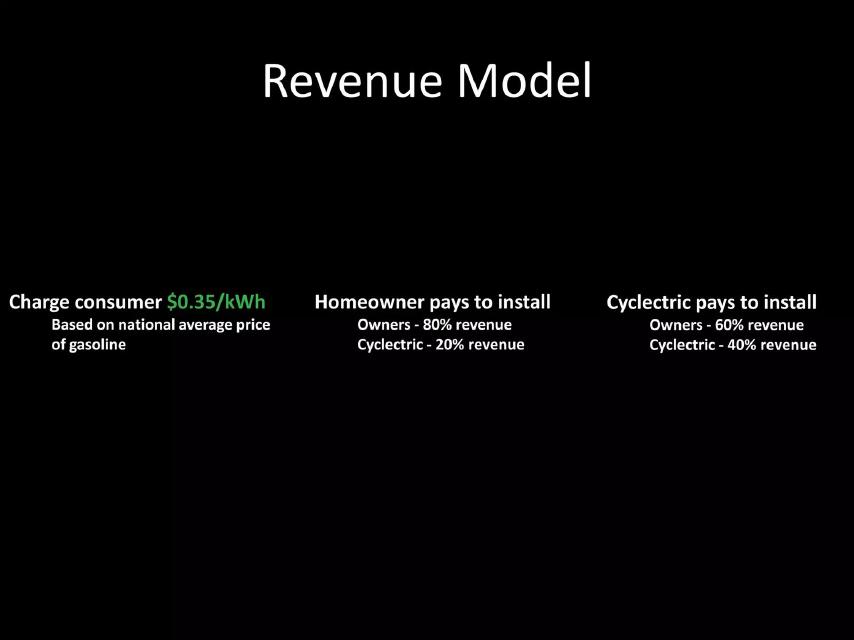
Home electric vehicle charging network. Slide titled "Revenue Model".
Cyclectric deck, slide 9. Exact stored slide matched to this analysis.
Our analysis: Price and revenue shares are clear, and the share rises when Cyclectric pays for installation.
Evidence and limitation: Company plan.
What a founder can adapt: Show how your share changes with who pays for equipment.
Supporting analysis
What the deck claims: "Charge consumer $0.35/kWh" "Based on national average price of gasoline". "Homeowner pays to install": "Owners - 80% revenue", "Cyclectric - 20% revenue". "Cyclectric pays to install": "Owners - 60% revenue", "Cyclectric - 40% revenue".
Presentation choice: The trade-off between capital and revenue share is visible in three short lines.
When it does not fit: Leaving out electricity and installation costs, so investors cannot see what the 20% or 40% leaves.
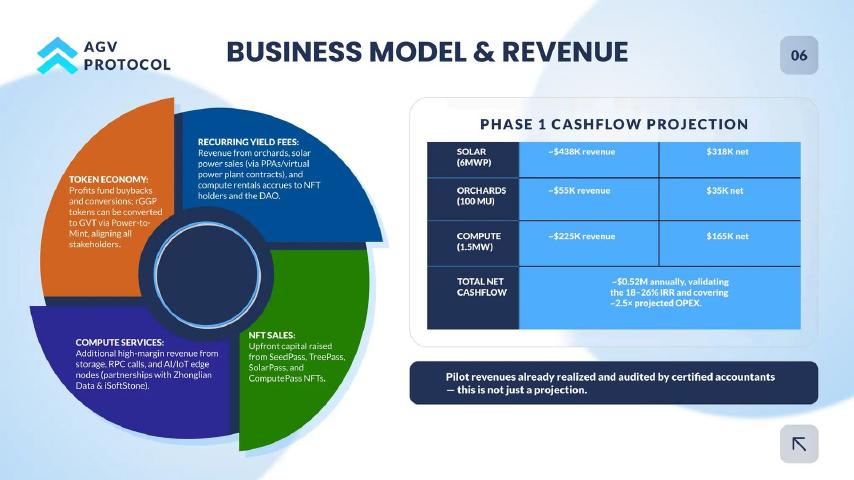
Solar, orchard and computing assets financed through tokens. Slide titled "Business Model & Revenue".
AGV Protocol deck, slide 7. Exact stored slide matched to this analysis.
Our analysis: Net figures add up: $318K + $35K + $165K is $518K, about $0.52M.
Evidence and limitation: Company projection; audit claim stated on the slide, not seen by us.
What a founder can adapt: Show revenue and net per site, then the total.
Supporting analysis
What the deck claims: "Phase 1 Cashflow Projection": "Solar (6MWP) ~$438K revenue, $318K net"; "Orchards (100 MU) ~$55K revenue, $35K net"; "Compute (1.5MW) ~$225K revenue, $165K net"; "Total net cashflow ~$0.52M annually, validating the 18-26% IRR and covering ~2.5x projected OPEX." "Pilot revenues already realized and audited by certified accountants — this is not just a projection."
Presentation choice: Revenue and net cash per site let investors see each asset's margin.
When it does not fit: Calling a table a projection and saying it is not just a projection in the same place; say which figures are audited.
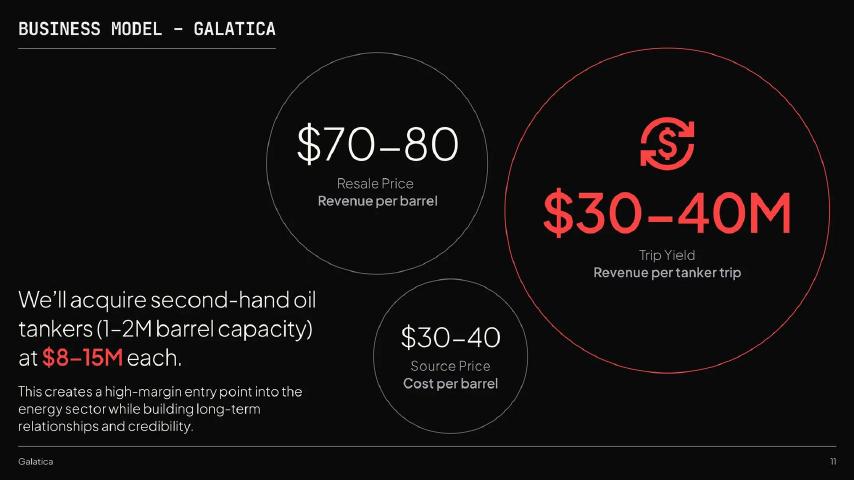
Energy infrastructure startup. Slide titled "Business Model - Galatica".
Galatica deck, slide 11. Exact stored slide matched to this analysis.
Our analysis: Buy and sell prices are clear, but 1-2 million barrels at $70-80 would be $70-160M in sales per trip. The $30-40M looks closer to margin than revenue.
Evidence and limitation: Company plan.
What a founder can adapt: Show price, cost, volume and the result, and say whether the result is revenue or margin.
Supporting analysis
What the deck claims: "We'll acquire second-hand oil tankers (1-2M barrel capacity) at $8-15M each." "$70-80 Resale Price Revenue per barrel"; "$30-40 Source Price Cost per barrel"; "$30-40M Trip Yield Revenue per tanker trip". "This creates a high-margin entry point into the energy sector while building long-term relationships and credibility."
Presentation choice: A useful layout weakened by a label that does not match the maths.
When it does not fit: Leaving out shipping, crew and fuel costs per trip.
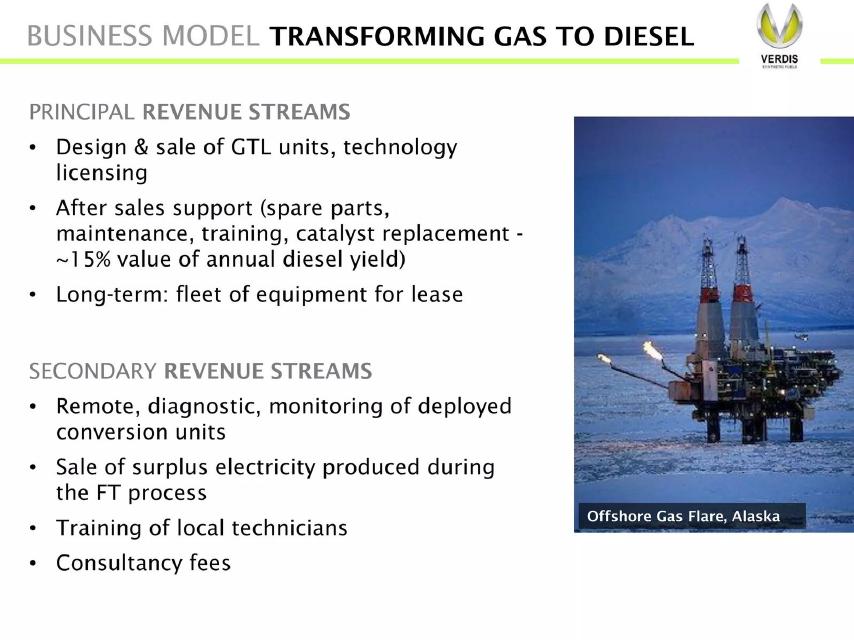
Gas-to-diesel conversion technology. Slide titled "Business Model: Transforming Gas to Diesel".
Verdis deck, slide 31. Exact stored slide matched to this analysis.
Our analysis: One useful figure (after-sales at about 15% of annual diesel yield), but no unit price.
Evidence and limitation: Company plan.
What a founder can adapt: Give the price of one unit and the yearly after-sales revenue it brings.
Supporting analysis
What the deck claims: "Principal revenue streams": "Design & sale of GTL units, technology licensing"; "After sales support (spare parts, maintenance, training, catalyst replacement - ~15% value of annual diesel yield)"; "Long-term: fleet of equipment for lease". "Secondary revenue streams": remote monitoring, "Sale of surplus electricity produced during the FT process", training, consultancy fees.
Presentation choice: Shown for contrast. Investors know the shape of the model but not its size.
When it does not fit: Seven revenue streams with one number between them.
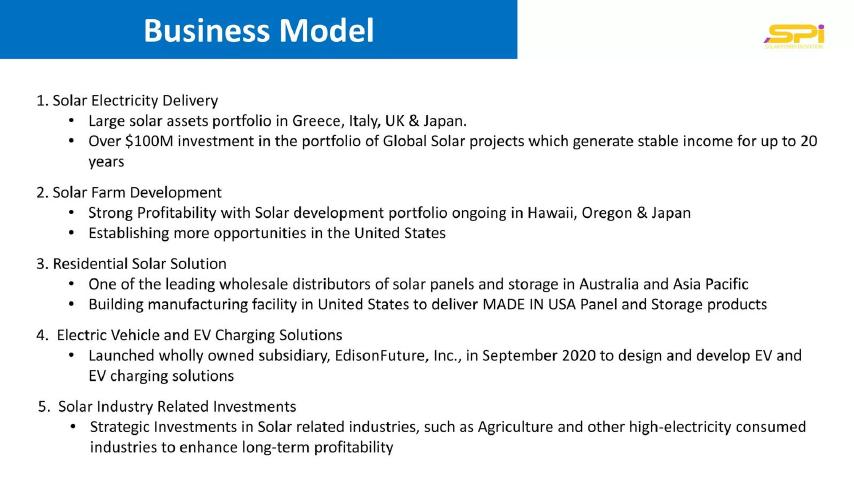
Listed solar and electric vehicle group. Slide titled "Business Model".
SPI Energy deck, slide 9. Exact stored slide matched to this analysis.
Our analysis: Five business lines and one investment figure; no prices, margins or revenue per line.
Evidence and limitation: Company description.
What a founder can adapt: Give each line's revenue or margin, or focus on the main one.
Supporting analysis
What the deck claims: "1. Solar Electricity Delivery" ("Over $100M investment in the portfolio of Global Solar projects which generate stable income for up to 20 years"); "2. Solar Farm Development"; "3. Residential Solar Solution"; "4. Electric Vehicle and EV Charging Solutions"; "5. Solar Industry Related Investments".
Presentation choice: Shown for contrast. A list of divisions is not a model investors can test.
When it does not fit: Using the business model slide as a company overview.
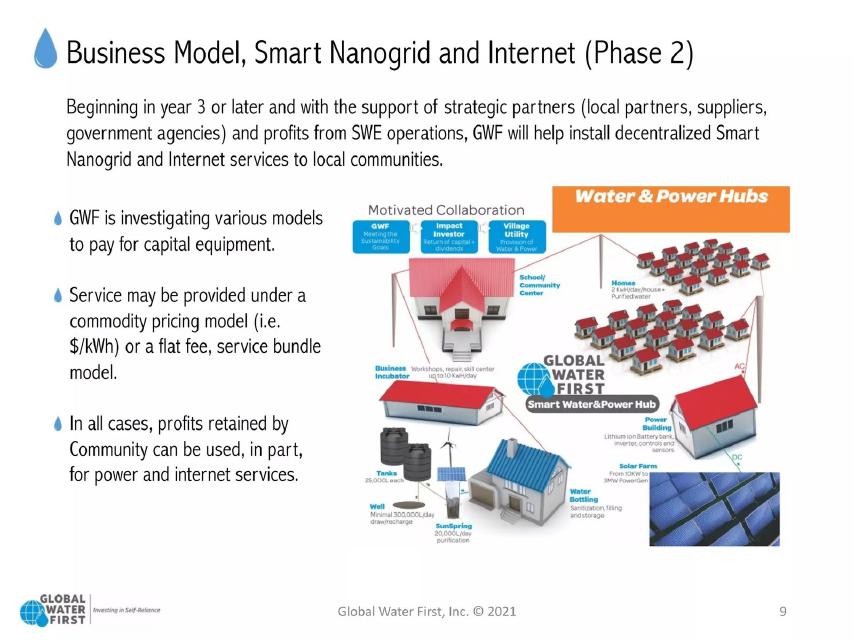
Community water and power hubs. Slide titled "Business Model, Smart Nanogrid and Internet (Phase 2)".
Global Water First deck, slide 9. Exact stored slide matched to this analysis.
Our analysis: Honest that the model is undecided, but gives investors nothing to price.
Evidence and limitation: Company plan; model not decided.
What a founder can adapt: If the model is undecided, show the option you expect and its likely price.
Supporting analysis
What the deck claims: "Beginning in year 3 or later..." "GWF is investigating various models to pay for capital equipment." "Service may be provided under a commodity pricing model (i.e. $/kWh) or a flat fee, service bundle model." "In all cases, profits retained by Community can be used, in part, for power and internet services."
Presentation choice: Shown as a warning. A model still being investigated belongs in the roadmap, not the business model slide.
When it does not fit: "Investigating various models" as the main message.
Clear Blue Technologies business model slide — slide 4
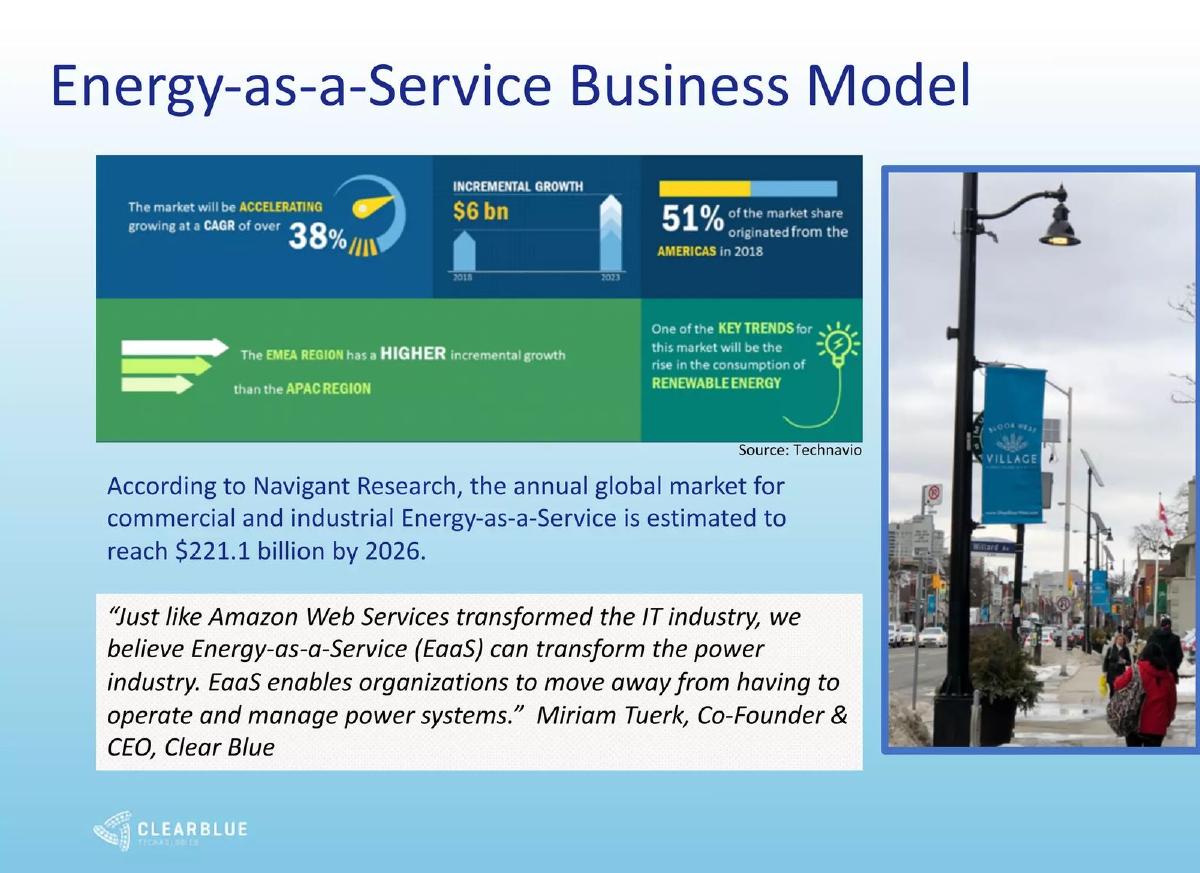
Off-grid solar lighting and power. Slide titled "Energy-as-a-Service Business Model".
Clear Blue Technologies deck, slide 4. Exact stored slide matched to this analysis.
Our analysis: Titled business model, but every figure is about the market.
Evidence and limitation: Third-party market estimates.
What a founder can adapt: Replace market figures with your monthly fee, contract length and equipment cost.
Supporting analysis
What the deck claims: Market figures: "growing at a CAGR of over 38%", "Incremental growth $6 bn", "51% of the market share originated from the Americas in 2018" ("Source: Technavio"). "According to Navigant Research, the annual global market for commercial and industrial Energy-as-a-Service is estimated to reach $221.1 billion by 2026." A quote from the co-founder comparing Energy-as-a-Service to Amazon Web Services.
Presentation choice: Shown as a warning. Investors learn the market is growing, not how Clear Blue earns money.
When it does not fit: Putting market data on the business model slide.
Whether each slide gives a price, who pays for the equipment, and what the company keeps.
Example
Price or fee
Who pays for equipment
What it keeps
Blink
$18/month, 8%, $99/month
Shown for all four options
Fees shown; margin not shown
Cyclectric
$0.35 per kWh
Homeowner or Cyclectric
20% or 40% of revenue
AGV Protocol
Revenue per site
Not shown
Net per site shown
Galatica
$70–80 per barrel
Galatica (tankers $8–15M)
Unclear label
Verdis
Not given
Not shown
After-sales ~15% of diesel yield
SPI Energy
Not given
Not shown
Not shown
Global Water First
Undecided
Undecided
Not shown
Clear Blue
Not given
Not shown
Not shown
Key Takeaways
Say who pays for the equipment and who keeps the revenue.
Give the price per unit: per kWh, per barrel, per month.
Show your share when revenue is split with a partner.
Label revenue and profit correctly.
Keep market size for the market slide.
Build your energy business model slide
Work out the numbers for one unit before you design the slide.
Unit. What is one unit: a charger, a site, a home, a trip?
Who pays. Who pays for equipment, installation and power?
Price. What does the customer pay per kWh, per month or per unit?
Your share. What do you keep after partners and running costs?
Copyable framework: Each [unit] costs [install cost], paid by [who]. Customers pay [price]. After [costs and partner share], we keep [amount] per [unit] per [year].
Illustrative example 1 — written by us
Before: We provide clean energy as a service to businesses.
After: We install and own each 50 kW solar system ($60,000). Customers pay $900 a month on 10-year contracts. After maintenance, we keep $750 a month per site.
What improved: Our illustrative rewrite; all figures are invented for the example. It shows the unit, who pays, the price and what is kept.
What this guide adds
Live energy guides cover competition, problem and solution slides; the general business model guide covers revenue for any startup. This guide covers how energy startups specifically show how they make money, where equipment costs, ownership and revenue splits shape the numbers more than in most industries.
How we read each slide
We read each stored slide image at full size and quote the text on it. Where a slide shows figures that should add up, we redid the sum ourselves. We have not checked any company's actual revenue, prices or returns, and we make no claim that any slide affected a fundraising outcome.
The common energy revenue models
Selling energy: the startup charges per unit of energy, as Cyclectric does ($0.35 per kWh) or as solar sites do through power purchase agreements. The key numbers are price per unit, units sold and the cost of producing them.
Equipment plus fees: the startup sells or installs equipment and charges ongoing fees, as Blink does with network and transaction fees, or Verdis with after-sales support. The key numbers are the equipment price, the fees and how long they last.
Energy as a service: the customer pays a monthly fee and the startup owns and runs the equipment, as Blink's subscription option and Clear Blue's model suggest. The key numbers are the monthly fee, contract length and equipment cost.
Trading: the startup buys energy or fuel and resells it, as Galatica plans with oil. The key numbers are buy price, sell price and volume per trip or contract.
What investors check on an energy business model slide
Who carries the equipment cost? If the startup pays for chargers or panels, it needs more capital but keeps more revenue. If the host or homeowner pays, the startup grows faster with less money but keeps less. Cyclectric shows this trade-off directly: its share rises from 20% to 40% when it pays to install.
What does the startup keep? A price per kWh or per barrel is not what the company earns after electricity, fuel, maintenance and partner shares. AGV shows net figures beside revenue; most slides do not.
Is it revenue or profit? Galatica labels $30 to $40 million as revenue per tanker trip, but 1 to 2 million barrels at $70 to $80 each would be $70 to $160 million in sales. The figure looks closer to the margin per trip, so the label invites questions.
Is it proven? AGV says its pilot revenues were "already realized and audited by certified accountants", which is a strong claim investors will ask to see. Where figures are plans, say so.
Common mistakes on energy business model slides
Showing the market instead of the model: Clear Blue's slide is titled "Energy-as-a-Service Business Model" but its figures are market growth rates and a $221.1 billion market estimate.
Listing business lines without unit numbers: SPI Energy describes five businesses and one investment figure, but no price or margin for any of them.
Leaving the model undecided: GWF says it "is investigating various models to pay for capital equipment" and that service "may be provided" under per-kWh or flat-fee pricing.
Mislabelling figures: calling a margin revenue, as Galatica's trip figure appears to do, makes investors doubt the other numbers too.
Choosing which numbers to show
Start with one unit: one charger, one solar site, one home or one trip. Show what it costs to install, what it earns each month or year, what goes to partners and what is left. Investors can then multiply by the number of units in your plan.
If you offer several ownership options, a table like Blink's is clearer than a paragraph. Put the options as columns and who pays for what as rows, with fees at the bottom.
Keep market size for the market slide and long-term plans for the roadmap. The business model slide should show how today's unit earns money.
Finally, redo every sum on the slide. Energy investors are used to project finance models and will check whether site revenues add up to the total and whether a margin has been labelled as revenue.
Adapting the slide to your type of energy business
Charging networks should show the ownership options, the fees they charge hosts and drivers, and utilisation if they have it, since a charger that is rarely used earns little whatever the fee.
Solar and storage developers should show revenue and net cash per site, the contract that backs the revenue (such as a power purchase agreement) and how long it lasts.
Equipment makers should show the unit price, the after-sales revenue per unit per year and how long customers keep paying.
Fuel and commodity traders should show buy price, sell price, volume and the cost of each trip, and label the result as revenue or margin.
Common mistakes
Market instead of model. Keep market size on the market slide.
Equipment cost hidden. Say who pays for installation.
Revenue and margin mixed up. Label each figure correctly.
Business lines without numbers. Give a price or margin for each.
Undecided model. Show the option you expect and its price.
Unchecked sums. Make site figures add up to the total.
Diagnostic checklist
Unit of sale defined.
Who pays for equipment stated.
Price per unit given.
Your share or margin shown.
Revenue and margin labelled correctly.
Sums checked.
Frequently asked questions
How do energy startups make money?
By selling energy per unit (Cyclectric, $0.35 per kWh), charging fees on equipment they or partners own (Blink), earning from sites they develop (AGV), selling equipment with after-sales support (Verdis), or trading fuel (Galatica).
What should an energy business model slide include?
Who pays for equipment, what the customer pays, how revenue is shared, and what the company keeps per unit.
Should I show the market on the business model slide?
No. Clear Blue's business model slide shows only market figures, so investors learn nothing about how the company earns money.
How do I show several ownership options?
Use a table like Blink's, with options as columns and who pays for what as rows, and fees at the bottom.
How we chose these examples
Corpus: published pitch deck teardowns on StartupFundraising.com. Founder-uploaded private decks are excluded.
Selection (2026-10-01): we searched extracted slide text across the full corpus for business model or revenue model slides that mention solar, energy, electricity, charging or batteries. We shortlisted 10 slides not used in other guides, viewed 9 and kept 8.
Not used: Terra One p8 (text too blurry to read) and Advanced Emissions Solutions p12 (deck file unavailable).
Review: stored slide images were read at full size on 2026-10-01 against company, deck and slide number, and sums on slides were redone (editorial model review). No person has yet completed an editorial review of this page. We did not verify any company's revenue, prices, returns or audit claims.