Insurtech Business Model Pitch Deck Slides: MGA, Broker
How to present an insurtech business model on a pitch deck: who carries the risk, what share of each premium you keep.
How to Present an Insurtech Business Model on a Pitch Deck
Ten slides from nine real insurtech decks show how founders explain how they make money: as a broker earning commission, as an MGA sharing in underwriting profit, as a full insurer carrying the risk, or by selling cover inside someone else's checkout.
TL;DR
An insurtech business model slide should say who carries the risk, what share of each premium the company keeps, and what it costs to win and keep a customer. Wrisk does this best in this set: for each customer it shows the annual premium, its commission, the cost to win the customer and the profit left over (£582 premium, £55 commission, £15 acquisition cost, £40 profit). Pineapple shows how it splits money with the insurer behind it: 15% of premiums plus up to 15% of underwriting profit. Wefox walks through where each euro of premium goes and shows the share it pays back in claims falling from 115% to 70% in three years. Alan puts two models side by side, one where it carries the risk and earns its margin from claims below premiums, one where it only distributes another insurer's product and carries no claims risk. Inshur, Superscript and Luko describe the MGA model in words; Cover Genius shows the embedded model; Seyna is a full insurer whose key figures are blacked out.
Insurtech business model slides from real pitch decks
Each example shows the exact stored slide above its analysis and links to the full teardown. Stage and year are given only where the deck states them. Figures are the company's own claims.
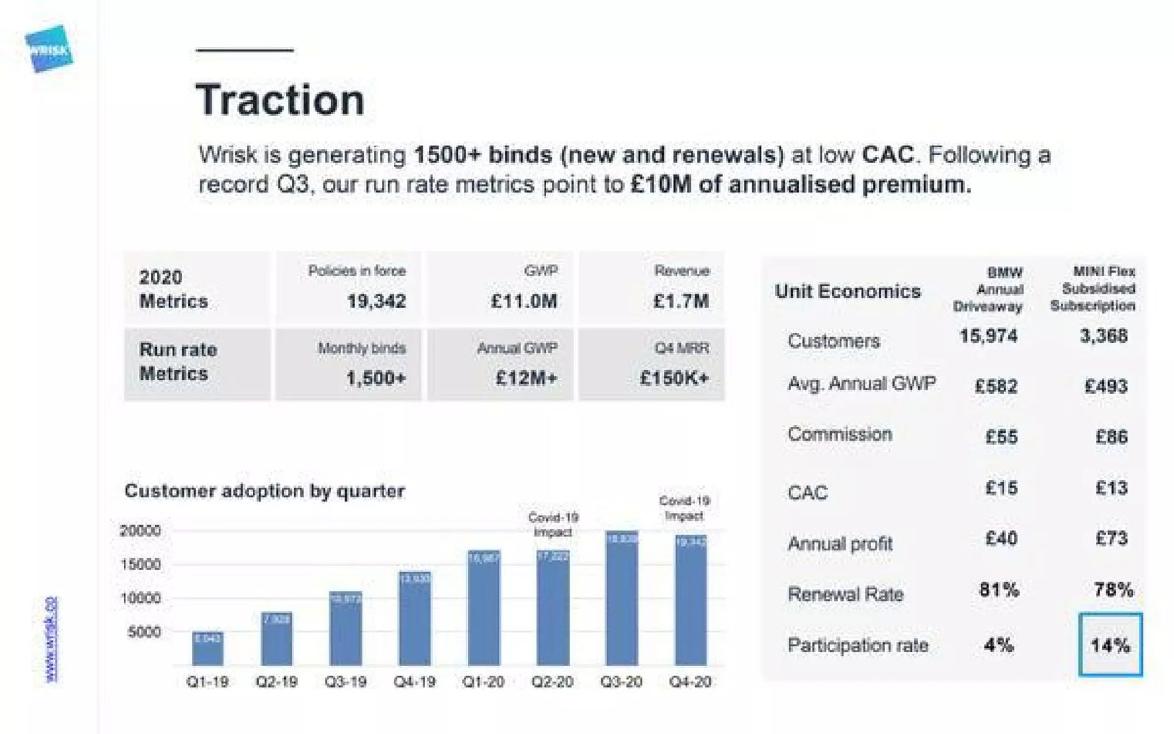
Wrisk business model slide — slide 8
Embedded car insurance for car makers such as BMW and MINI. 2020 figures.
Wrisk deck, slide 8. Exact stored slide matched to this analysis.
Our analysis: The only slide here with full per-customer economics. The BMW column adds up; in the MINI column £86 minus £15 gives £71, not the £73 shown.
Evidence and limitation: Totals that don't follow from the figures beside them.
What a founder can adapt: Show premium, commission, acquisition cost, profit and renewal for one typical customer, and check every subtraction.
Supporting analysis
What the deck claims: BMW product: 15,974 customers, £582 average premium, £55 commission, £15 CAC, £40 annual profit, 81% renewal, 4% participation. Subsidised MINI product: 3,368 customers, £493 premium, £86 commission, £15 CAC, £73 annual profit, 78% renewal, 14% participation. 2020: 19,342 policies in force, £11.0M GWP, £1.7M revenue.
Presentation choice: The only slide here with full per-customer economics. The BMW column adds up; in the MINI column £86 minus £15 gives £71, not the £73 shown.
When it does not fit: Totals that don't follow from the figures beside them.
South African digital car insurer working with a partner insurer.
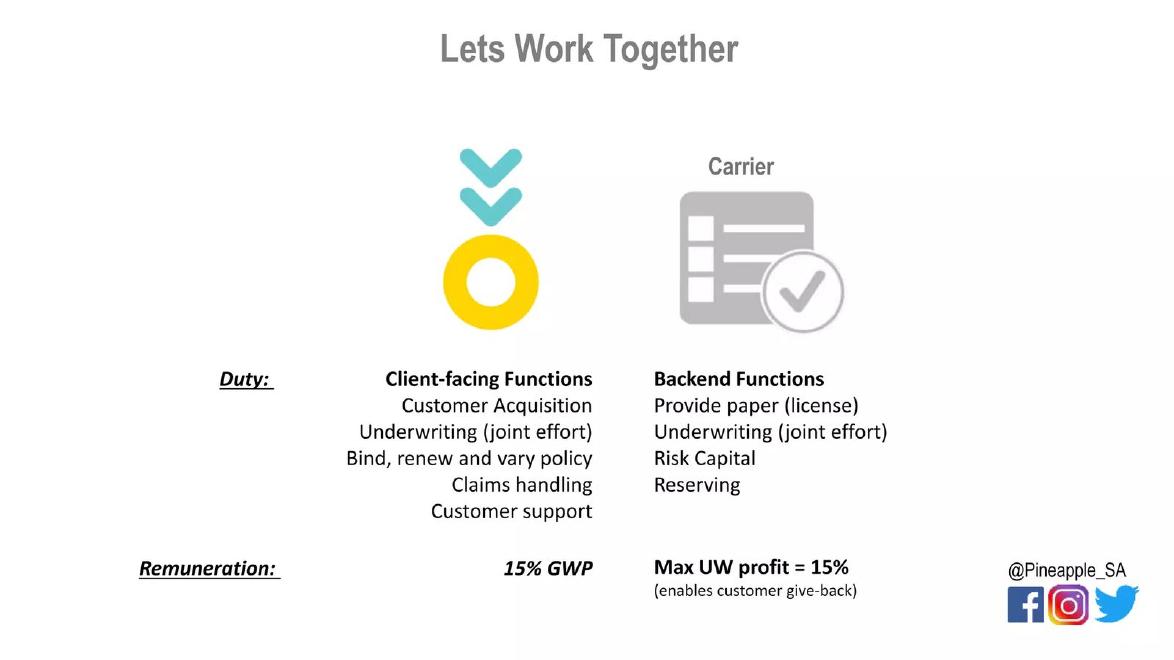
Pineapple deck, slide 16. Exact stored slide matched to this analysis.
Our analysis: States plainly who does what, who carries the risk and how the premium is split.
Evidence and limitation: Calling yourself an insurer when a partner holds the risk.
What a founder can adapt: Put your duties, your partner's duties and each side's share of the premium in one table.
Supporting analysis
What the deck claims: Pineapple handles acquisition, binding and renewing, claims and support, with joint underwriting. The insurer provides the licence, risk capital and reserves. Remuneration: 15% of GWP to Pineapple; maximum underwriting profit 15% to the insurer, enabling customer give-back.
Presentation choice: States plainly who does what, who carries the risk and how the premium is split.
When it does not fit: Calling yourself an insurer when a partner holds the risk.
German digital insurer and insurance platform selling mainly through advisers.
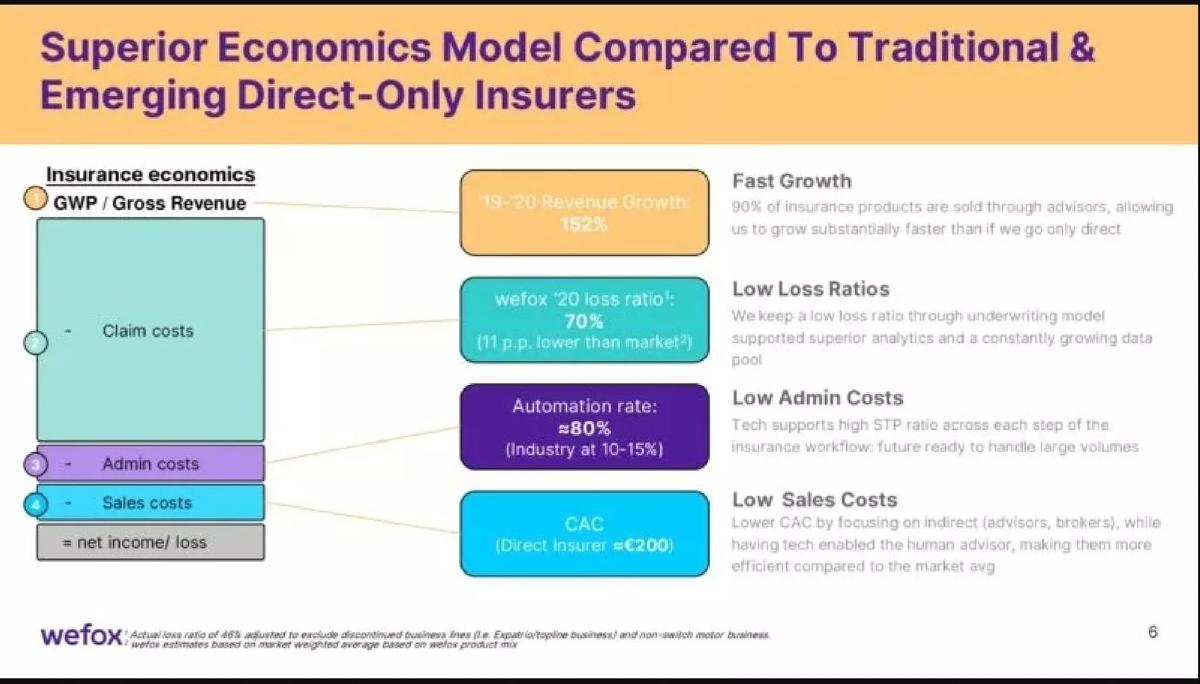
Wefox deck, slide 6. Exact stored slide matched to this analysis.
Our analysis: Ties each block of the premium to a figure and a reason.
Evidence and limitation: A cost breakdown with no comparison to the market.
What a founder can adapt: Show where each unit of premium goes, then back each block with one number.
Supporting analysis
What the deck claims: Breaks gross written premium into claim costs, admin costs, sales costs and net income. 2020 loss ratio 70%, 11 points below the market; automation rate about 80% against 10–15% for the industry; acquisition cost below the roughly €200 of direct insurers.
Presentation choice: Ties each block of the premium to a figure and a reason.
When it does not fit: A cost breakdown with no comparison to the market.
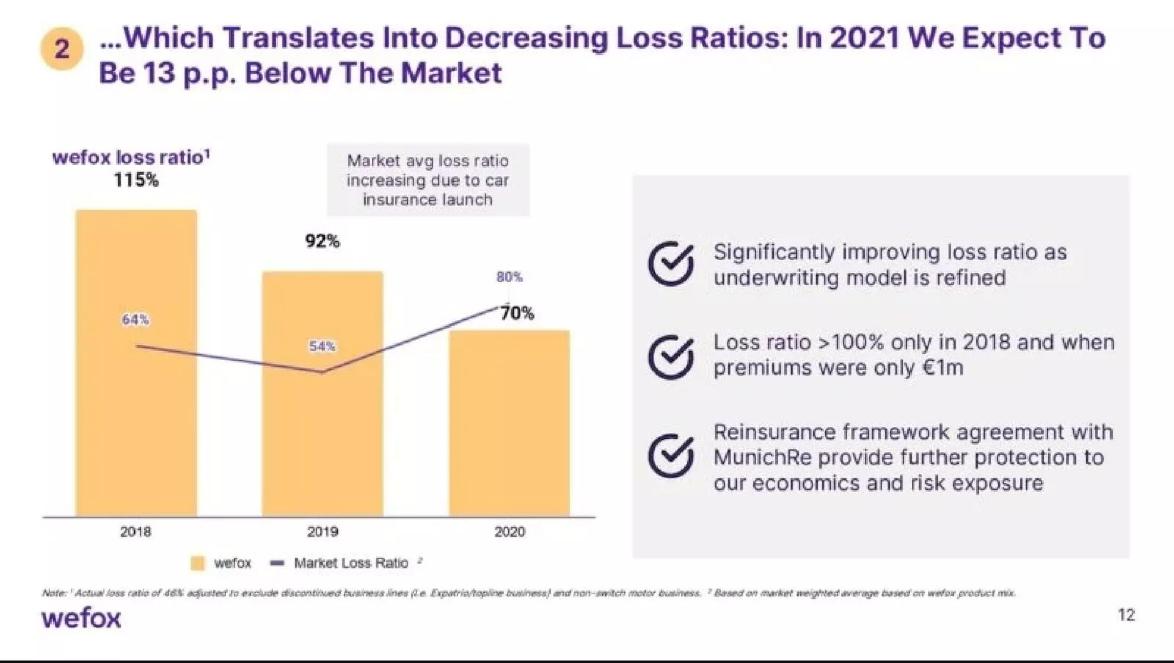
Wefox deck, slide 12. Exact stored slide matched to this analysis.
Our analysis: A three-year trend with reasons, including an honest bad start.
Evidence and limitation: Showing only your best year.
What a founder can adapt: Show your loss ratio by year next to the market's, and explain the change.
Supporting analysis
What the deck claims: Loss ratio 115% in 2018, 92% in 2019, 70% in 2020; expects to be 13 points below the market in 2021. Reasons: refined underwriting and a Munich Re reinsurance agreement. The 2018 figure came when premiums were only €1M.
Presentation choice: A three-year trend with reasons, including an honest bad start.
When it does not fit: Showing only your best year.
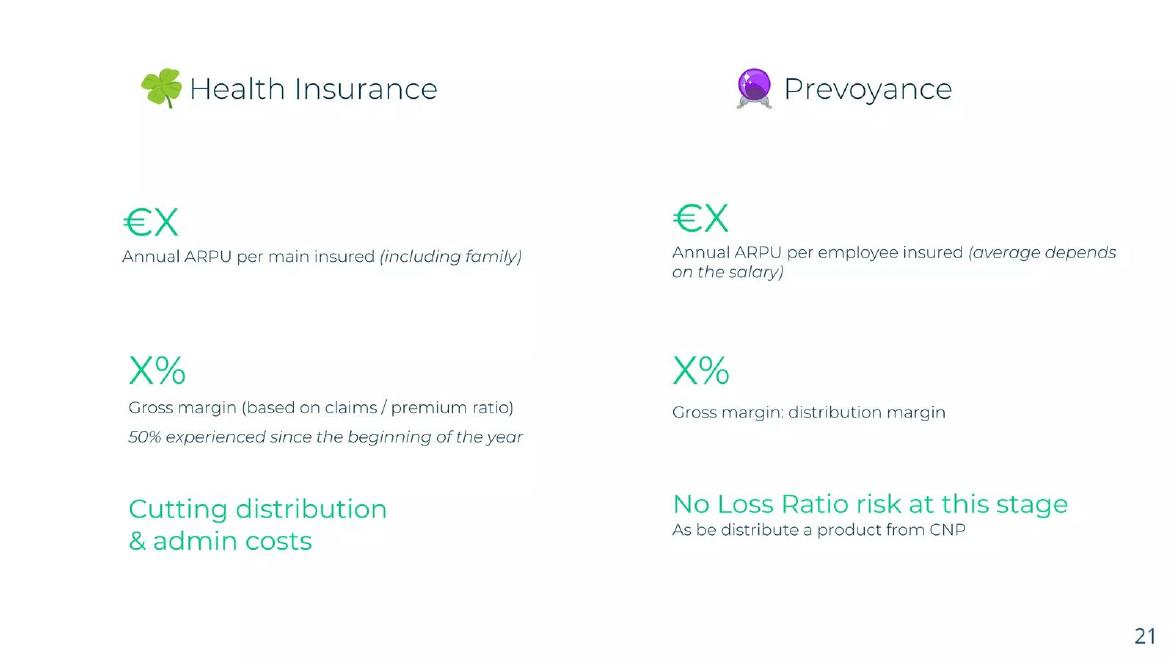
French digital health insurer for companies and their employees.
Alan deck, slide 21. Exact stored slide matched to this analysis.
Our analysis: Separates the line that carries claims risk from the line that does not.
Evidence and limitation: Placeholders (€X, X%) where an investor expects figures.
What a founder can adapt: If you run more than one model, give each its own column with its own margin.
Supporting analysis
What the deck claims: Health insurance: annual revenue per insured (€X), gross margin from claims/premium ratio (X%), "50% experienced since the beginning of the year". Prevoyance: revenue per employee (€X), distribution margin (X%), "No Loss Ratio risk at this stage", distributing a CNP product.
Presentation choice: Separates the line that carries claims risk from the line that does not.
When it does not fit: Placeholders (€X, X%) where an investor expects figures.
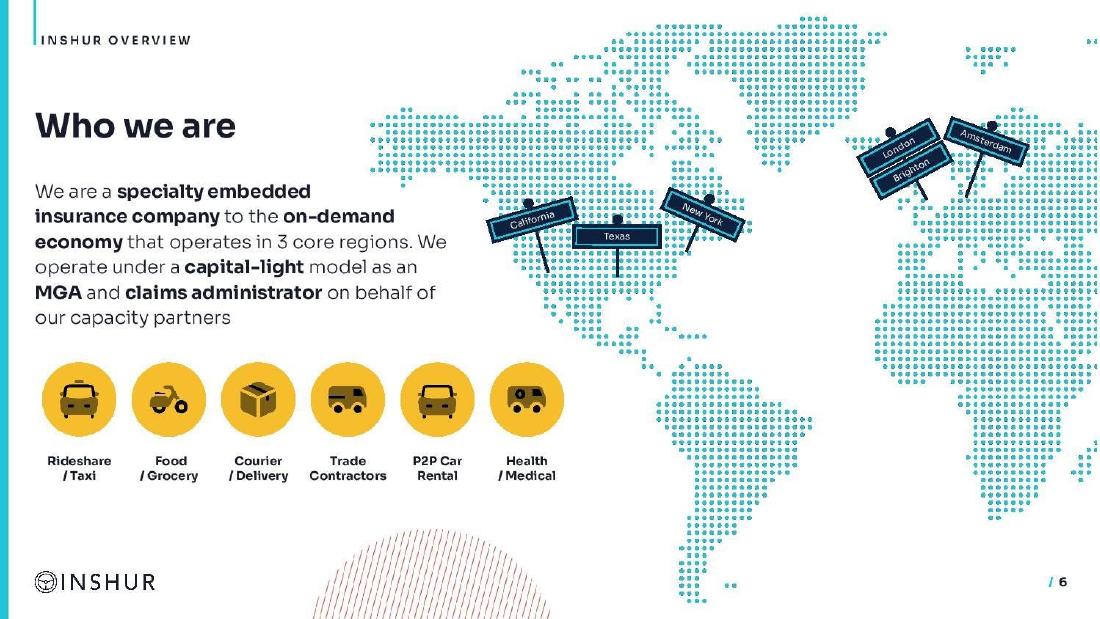
Insurance for rideshare, delivery and courier drivers in three regions.
Inshur deck, slide 6. Exact stored slide matched to this analysis.
Our analysis: One sentence makes the risk position clear.
Evidence and limitation: Stopping at the label with no numbers.
What a founder can adapt: Follow the sentence with your commission rate and loss ratio.
Supporting analysis
What the deck claims: "A specialty embedded insurance company to the on-demand economy that operates in 3 core regions. We operate under a capital-light model as an MGA and claims administrator on behalf of our capacity partners."
Presentation choice: One sentence makes the risk position clear.
When it does not fit: Stopping at the label with no numbers.
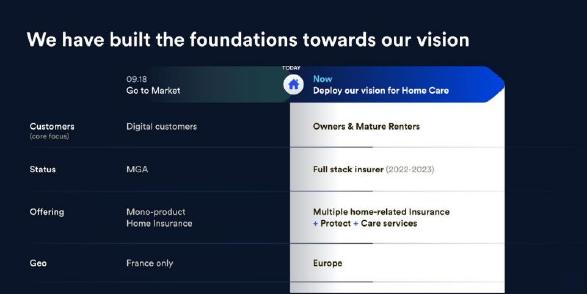
Luko deck, slide 14. Exact stored slide matched to this analysis.
Our analysis: Shows the path from MGA to full insurer in one table.
Evidence and limitation: A move to full insurer with no reason or timing.
What a founder can adapt: Add the margin at each stage and the capital needed to move.
Supporting analysis
What the deck claims: Launch (September 2018): digital customers, MGA, single home product, France only. Next: home owners and mature renters, full-stack insurer, several home products plus protection and care services, Europe.
Presentation choice: Shows the path from MGA to full insurer in one table.
When it does not fit: A move to full insurer with no reason or timing.
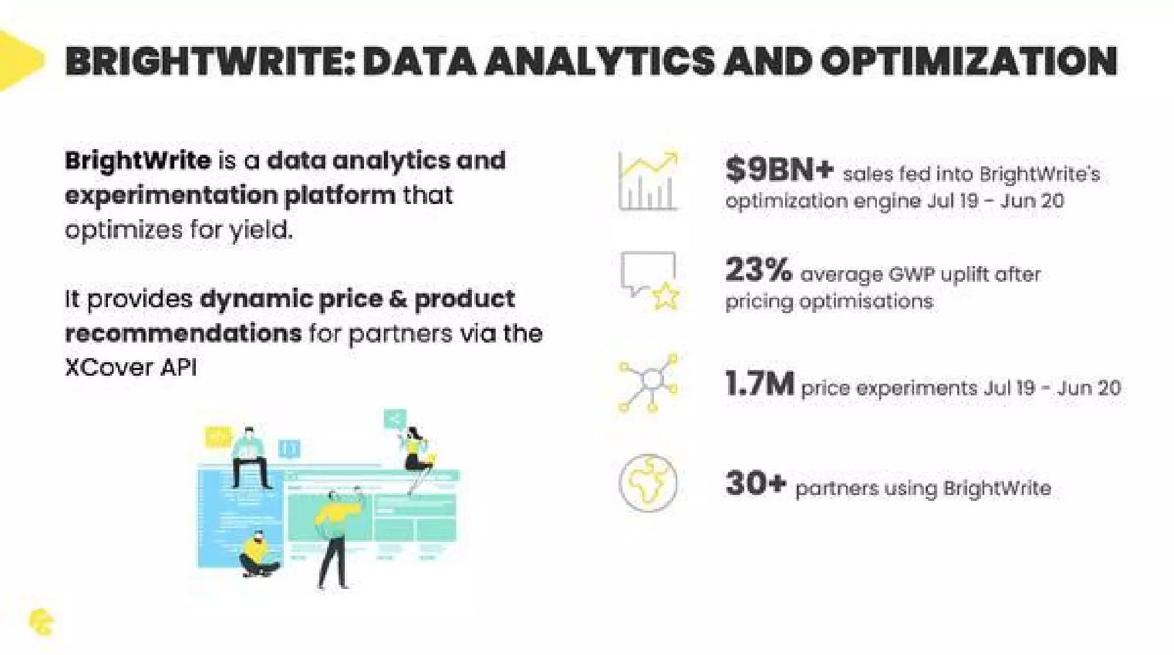
Embedded insurance sold through partners' checkouts via the XCover API.
Cover Genius deck, slide 12. Exact stored slide matched to this analysis.
Our analysis: Shows how it grows revenue inside each partner, but not what share of premium it keeps.
Evidence and limitation: Platform statistics in place of your own revenue per policy.
What a founder can adapt: Add your share of each premium and the share of buyers who add cover.
Supporting analysis
What the deck claims: BrightWrite pricing engine: $9B+ of sales fed in (July 2019 – June 2020), 23% average increase in premiums sold after price changes, 1.7M price experiments, 30+ partners.
Presentation choice: Shows how it grows revenue inside each partner, but not what share of premium it keeps.
When it does not fit: Platform statistics in place of your own revenue per policy.
French licensed insurer carrying risk for brokers and MGAs.
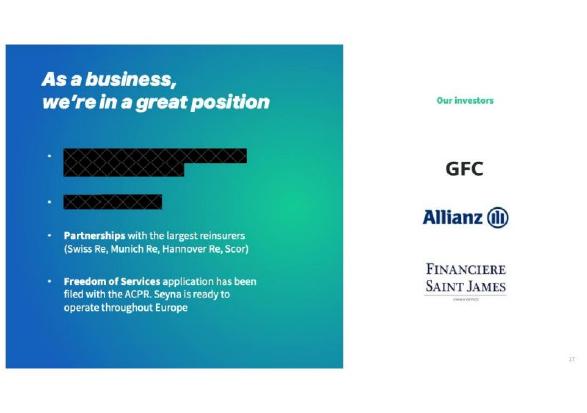
Seyna deck, slide 7. Exact stored slide matched to this analysis.
Our analysis: A weak example to learn from: the right proof points for a risk carrier, but the key figures are hidden.
Evidence and limitation: Redacting the numbers that make a risk carrier credible.
What a founder can adapt: Show capital, reinsurance cover and loss ratio together.
Supporting analysis
What the deck claims: Partnerships with the largest reinsurers (Swiss Re, Munich Re, Hannover Re, Scor); licence from the ACPR to operate throughout Europe. The first points are blacked out in the deck.
Presentation choice: A weak example to learn from: the right proof points for a risk carrier, but the key figures are hidden.
When it does not fit: Redacting the numbers that make a risk carrier credible.
What each insurtech business model slide tells an investor
Most slides name a model; few show the premium split, loss ratio and per-customer profit together.
Example
Model
Who carries risk
Share of premium kept
Loss ratio
Per-customer economics
Wrisk
Embedded broker/MGA
Partner insurer
Yes (£55 / £86)
No
Yes
Pineapple
MGA
Partner insurer
Yes (15% GWP)
No
No
Wefox p6
Full-stack
Wefox
Yes (cost blocks)
Yes (70%)
Partly (CAC claim)
Wefox p12
Full-stack
Wefox
No
Yes (3 years)
No
Alan
Carrier + distributor
Split by product
Placeholders
Partly (50%)
No
Inshur
MGA
Capacity partners
No
No
No
Superscript
MGA
Partner insurer
No
No
No
Luko
MGA to full-stack
Changes over time
No
No
No
Cover Genius
Embedded
Not stated
No
No
No
Seyna
Licensed insurer
Seyna + reinsurers
Redacted
No
No
Key Takeaways
Say who carries the risk: you, a partner insurer, or a reinsurer.
Show what share of each premium you keep, as commission, fee or margin.
If you carry risk, show your loss ratio over time and compare it with the market.
Show what it costs to win a customer and how much profit one customer leaves.
If you plan to move from broker or MGA to full insurer, show the steps and why.
Test your insurtech business model slide before you send it
Answer these with numbers, even if they are targets.
Risk. Who carries the claims risk: you, a partner insurer or a reinsurer?
Share. What share of each premium do you keep, and how is it paid?
Loss ratio. What is your loss ratio by year, and the market's?
Customer. What does it cost to win a customer, and what do they leave each year?
Renewal. What share of customers renew?
Copyable framework: We are a [model]; [partner] carries the risk; we keep [share]% of premium; loss ratio [x]% vs market [y]%; CAC [cost], annual profit per customer [profit], renewal [rate]%
Illustrative example 1 — written by us
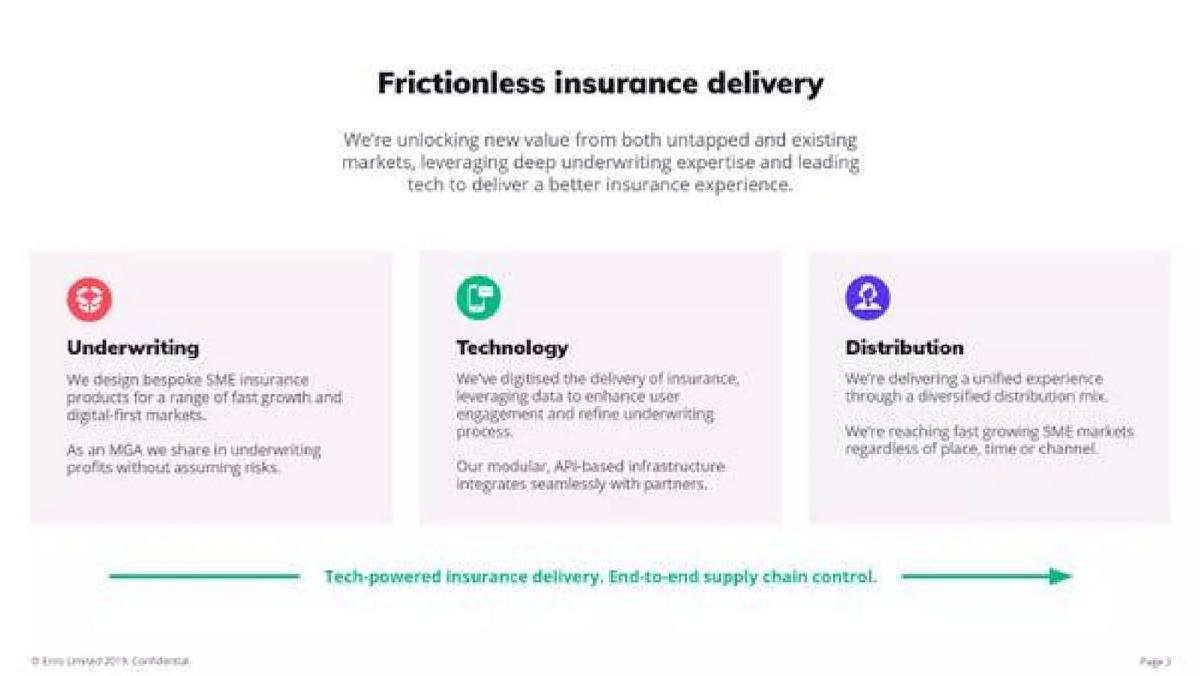
Before: As an MGA we share in underwriting profits without assuming risks.
After: MGA for [insurer]: [commission]% of GWP plus [share]% of underwriting profit; loss ratio [x]% vs market [y]%; CAC [cost]; [rate]% renewal
What improved: Our illustrative rewrite, not Superscript's text. Bracketed parts are placeholders, not company facts. It turns the label into numbers an investor can test.
What this guide covers
An insurance startup can make money in very different ways, and investors value them very differently. A broker earns a commission on each policy it sells and carries no claims risk. An MGA (managing general agent) writes policies on behalf of an insurer, sets prices and often handles claims, and is paid a commission plus, sometimes, a share of the underwriting profit; the insurer still carries the risk. A full-stack insurer holds its own licence and capital, keeps the whole premium and pays the claims, so its profit depends on how much it pays out compared with what it collects. An embedded insurer sells cover inside another company's purchase flow, usually earning a share of each sale.
Investors first want to know which of these you are, because it decides how much capital you need, how risky your revenue is and what your gross margin can be. A broker can be profitable on small amounts of money but keeps a small slice of each premium. A full insurer keeps the whole premium but needs regulatory capital and can lose money on a bad year of claims. An MGA sits in between. A slide that leaves this unclear forces an investor to guess, and they usually guess the riskier answer.
We already have guides on insurance markets, insurance problems and insurance sales approaches. None of them explains how an insurtech should present the way it earns money. We searched our corpus for slides about premiums, commissions, loss ratios, MGAs and underwriting profit and found 31 candidate slides across 22 decks. Ten slides from nine companies were readable, came from companies that were private when they made the deck, and together cover all four models.
Say who carries the risk
The first job of the slide is to say where the risk sits. This one sentence tells an investor whether your revenue is a commission or a premium, whether you need capital, and whether a hurricane or a pandemic can wipe out a year's profit.
Inshur says it in one line: it operates "under a capital-light model as an MGA and claims administrator on behalf of our capacity partners". The phrase "capacity partners" means the insurers who put up the capital and carry the risk; Inshur designs the product, sells it to rideshare, delivery and courier drivers, and handles claims for a fee. Superscript says the same thing about itself: "As an MGA we share in underwriting profits without assuming risks." Both sentences are short and leave no doubt.
Alan's slide is more useful because it shows two models in the same company. For health insurance, Alan carries the risk, and its gross margin is "based on claims / premium ratio", with a note that claims have run at 50% of premiums since the start of the year. For prevoyance (a French employee disability and death cover), Alan distributes a product from the insurer CNP, earns a distribution margin and has "no loss ratio risk at this stage". An investor reading it knows exactly which revenue line can swing with claims and which cannot. Alan's deck shows its prices and margins only as "€X" and "X%", which means the slide explains the structure but gives no figures to test.
Seyna is the opposite case: a licensed insurer that carries risk for brokers and MGAs. Its slide names partnerships with the largest reinsurers (Swiss Re, Munich Re, Hannover Re, Scor) and its licence from the French regulator, the ACPR, to operate across Europe. Those are the right things for a risk carrier to show, because reinsurance and a licence are what make carrying risk possible. But the first points on the slide are blacked out in the deck, so we treat it as a weak example.
Show what share of each premium you keep
Once the risk is clear, the slide should show how much of each premium the company keeps. For a broker or MGA this is a commission rate; for a full insurer it is the margin left after claims and costs.
Pineapple, a South African digital car insurer, gives the clearest split in this set. Its slide divides duties between Pineapple and the insurer behind it. Pineapple handles customer acquisition, binding, renewing and changing policies, claims handling and customer support, and shares underwriting with the insurer. The insurer provides the licence, the risk capital and the reserves. The remuneration line says it all: Pineapple earns 15% of gross written premium (GWP, the total premiums sold), and the insurer keeps up to 15% underwriting profit, with a note that this "enables customer give-back". An investor can see both what Pineapple earns on every policy and how its model returns money to customers.
Wrisk, which sells branded car insurance for BMW, MINI and other car makers, shows the same thing per customer rather than as a rate. In its unit economics table the BMW product has an average annual premium of £582 and a commission of £55, about 9.5% of the premium by our calculation. The subsidised MINI product has a premium of £493 and a commission of £86, about 17%. Showing the premium and the commission side by side lets an investor work out the rate without being told.
Wefox shows where the whole premium goes. Its "insurance economics" chart breaks gross written premium into claim costs, admin costs and sales costs, leaving net income. Next to it, Wefox gives the figure behind each block: a 70% loss ratio in 2020, which it says is 11 points below the market; an automation rate of about 80%, against 10% to 15% for the industry; and customer acquisition cost below the roughly €200 it attributes to direct insurers. It is a useful way to explain a full-stack model, because each block of the premium is tied to a claim about why Wefox does better.
If you carry risk, show your loss ratio over time
The loss ratio, claims paid divided by premiums earned, is the single most important number for an insurer or an MGA that shares in profit. A loss ratio above 100% means the company paid out more in claims than it collected. Investors want to see the trend and how it compares with the market.
Wefox gives a three-year chart. Its loss ratio was 115% in 2018, 92% in 2019 and 70% in 2020, and the slide notes that the 2018 figure came when premiums were only €1 million. The headline says it expects to be 13 points below the market in 2021. The slide also gives reasons for the improvement: a refined underwriting model and a reinsurance agreement with Munich Re. A falling loss ratio with an explanation is far more convincing than a single good year.
Alan gives one figure, claims at 50% of premiums since the start of the year, and does not show a trend. Pineapple's slide names an underwriting profit share but gives no loss ratio. If your profit depends on claims, put the history on the slide, even if the early years look bad. Wefox shows that a loss ratio above 100% at the start is not fatal if the trend and the reasons are clear.
Show the cost to win a customer and the profit per customer
Insurance is bought once a year and renewed, so the value of a customer depends on how much it costs to win them, how much you keep each year and how often they renew. Wrisk is the only slide in this set that shows all of it.
For the BMW product Wrisk shows 15,974 customers, a £582 average premium, a £55 commission, a £15 cost to win each customer, £40 annual profit per customer and an 81% renewal rate. The figures check: £55 minus £15 is £40. For the subsidised MINI product it shows 3,368 customers, a £493 premium, an £86 commission, a £15 acquisition cost, a renewal rate of 78% and annual profit of £73. Here the figures do not quite add up: £86 minus £15 is £71, not £73. The difference may come from a cost or fee the table does not show, but the slide does not say. Elsewhere on the slide Wrisk gives 19,342 policies in force, £11.0 million GWP and £1.7 million revenue for 2020, and a run rate of more than 1,500 policies sold or renewed a month and more than £12 million annual GWP.
Wefox gives a claim about acquisition cost rather than a figure: it says it keeps acquisition costs low by selling through advisers and brokers, against the roughly €200 per customer it attributes to direct insurers. Most other slides here leave acquisition cost out. If you sell insurance, a per-customer table like Wrisk's, checked line by line, is the strongest thing you can put on a business model slide.
Embedded insurance: earning from someone else's checkout
Embedded insurers sell cover at the moment a customer buys something else: a flight, a phone, a car. They earn a share of each policy sold, and their growth depends on their partners' sales volume and how many buyers add the cover.
Cover Genius, which sells cover through partners' checkouts via its XCover API, shows a different kind of slide. Instead of a commission, it shows what its pricing engine, BrightWrite, does for partners: more than $9 billion of sales fed into the engine between July 2019 and June 2020, 1.7 million price experiments, more than 30 partners using it, and an average 23% increase in premiums sold after price changes. It tells an investor how Cover Genius grows revenue inside each partner, but not what share of each premium it keeps. Wrisk is embedded too, inside car makers' buying journeys, and its participation rate (4% of BMW buyers, 14% for the subsidised MINI product) is the number that matters most for this model.
Moving from MGA to full insurer
Many insurtechs start as MGAs, because it needs little capital, and plan to become full insurers later, to keep more of each premium. If that is your plan, the slide should show the stages.
Luko, a French home insurer, does this in a simple table. In September 2018, at launch, it served digital customers as an MGA with a single home insurance product in France. Its next stage targets home owners and mature renters, as a full-stack insurer, with several home-related insurance products plus protection and care services, across Europe. The table makes the plan easy to follow, but it gives no reason or timing for the move to full insurer, and no figures on how much more of each premium Luko would keep. A stronger version would show the margin at each stage and the capital needed to get there.
A worked example: what one policy earns at each model
This example uses illustrative figures, not company data, to show why the model matters. Take a car policy with a £600 annual premium.
As a broker earning 10% commission, you keep £60 a year and carry no claims risk. As an MGA earning 15% commission plus a share of underwriting profit, you keep £90, and if claims come in at 60% of premium you might earn a further share of the profit left after claims and the insurer's costs. As a full insurer you keep the whole £600 but pay the claims: at a 60% loss ratio that is £360, leaving £240 before admin and sales costs; at a 100% loss ratio it leaves nothing at all.
The full insurer's potential profit is several times the broker's, but so is its risk and capital need. That is why the slide must say which model you run: the same premium can mean very different revenue.
Common mistakes
Unclear risk. Say who pays the claims.
Premium shown as revenue. If a partner carries the risk, your revenue is your commission, not the premium.
No loss ratio. If profit depends on claims, show the loss ratio by year.
One good year. Show the trend, including bad early years.
Unchecked tables. Make sure every profit figure follows from the numbers beside it.
Diagnostic checklist
Model named and who carries the risk stated.
Share of premium kept stated.
Loss ratio history shown, if you carry risk or share profit.
Acquisition cost and annual profit per customer shown.
Renewal rate stated.
Frequently asked questions
How we chose these examples
Corpus: published pitch deck teardowns on StartupFundraising.com. Founder-uploaded private decks are excluded.
Selection (2026-10-01): we searched extracted slide text for premiums, commissions, loss ratios, MGA and underwriting profit (31 candidate slides, 22 decks), then read each candidate from images made from the original deck files.
Eligibility: each company was private when its deck was made. Wrisk (Series B, 2025), Inshur (Series A 2019, Series B 2021), Superscript (Series B, January 2023), Seyna (funding round, 2025) and Pineapple (Series B, November 2023) were checked against public funding announcements. Wefox, Luko, Cover Genius and Alan rest on their decks and the absence of any known stock market listing.
Not used: Branch (shows sales growth only, no revenue mechanics); Beam Dental, Angle Health, Arbol, Caura, Kin and others whose slides mention insurance terms without explaining how the company earns.
Arithmetic: Wrisk's BMW column was checked (£55 minus £15 equals £40); its MINI column does not add up (£86 minus £15 is £71, slide shows £73). Wrisk's commission rates (about 9.5% and 17%) are our calculations from its figures.
Overlap check: the insurance market, problem and sales guides do not cover how an insurtech earns money.
Review: all ten slide images were inspected on 2026-10-01 and matched to company, deck and slide number (AI editorial model review). No person has yet completed an editorial review of this page. The worked policy example uses illustrative figures, not company data.
Figures are the companies' own claims; we did not verify underlying data. We make no claim that any slide caused a fundraising outcome.