Usage-Based and Pay-As-You-Go Pricing Pitch Deck Slides
How to present usage-based pricing on a pitch deck: the unit you charge for, the price per unit, how revenue grows with use, and how you keep it predictable.
How to Present Usage-Based Pricing on a Pitch Deck
Ten slides from real pitch decks show how founders present pay-per-use and pay-as-you-go pricing: what unit they charge for, what each unit costs, how it combines with subscriptions, and why some companies moved away from it.
TL;DR
A usage-based pricing slide should name the unit the customer pays for, the price of one unit, and how much a typical customer uses. Carma does all three: a pay-as-you-go price list with nine lines, from $0.25 per underwriting check on 30,000 customers to $1,000 per dispatcher seat, adding up to $90,500. MindsDB shows two prices for the same hour of use, $0.9 pay-as-you-go and $0.7 on a prepaid contract, which tells an investor how it turns usage into committed revenue. Fetch puts a 2% pay-per-use fee next to a $49-a-month subscription. Camdog combines a $49 monthly plan with $0.1 for each extra hour. Evervault explains what it measures (how often a customer uses a cloud enclave and how much data it sends) and why that makes cost predictable for buyers, but gives no price. Arist and KarmaCheck are the contrast: Arist started usage-based and moved to monthly contracts in November 2020; KarmaCheck sells subscriptions and treats pay-as-you-go customers as upgrade candidates.
Usage-based pricing slides from real pitch decks
Each example shows the exact stored slide above its analysis and links to the full teardown. Stage and year are given only where the deck states them. Figures are the company's own claims.
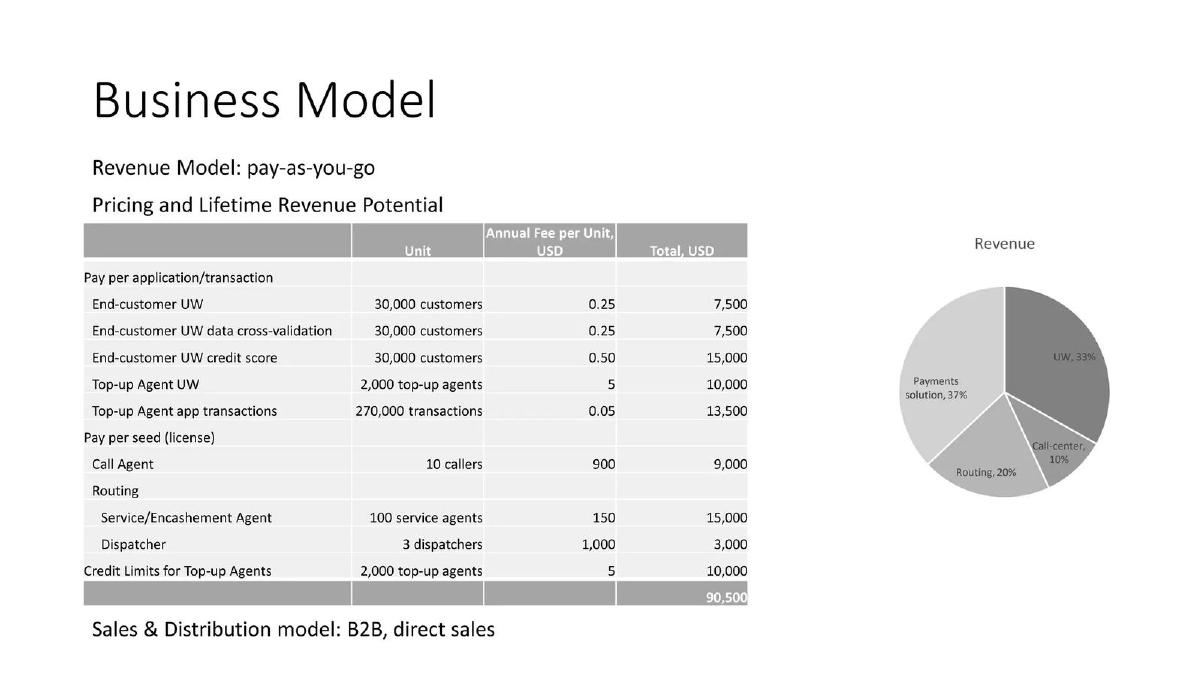
Carma business model slide — slide 10
Underwriting and collection software for pay-as-you-go solar companies. Seed deck, 2018.
Carma deck, slide 10. Exact stored slide matched to this analysis.
Our analysis: The most complete usage slide here: every unit, volume and price shown, and the total adds up.
Evidence and limitation: A lifetime figure with no time period.
What a founder can adapt: Show one typical client's bill line by line, then say how many such clients you expect.
Supporting analysis
What the deck claims: "Revenue Model: pay-as-you-go." Nine priced lines, e.g. underwriting 30,000 customers at $0.25 ($7,500), credit score at $0.50 ($15,000), 270,000 top-up transactions at $0.05 ($13,500), 100 service agents at $150 ($15,000); total $90,500.
Presentation choice: The most complete usage slide here: every unit, volume and price shown, and the total adds up.
When it does not fit: A lifetime figure with no time period.
Payments company in Malaysia. Angel-round deck, 2020.
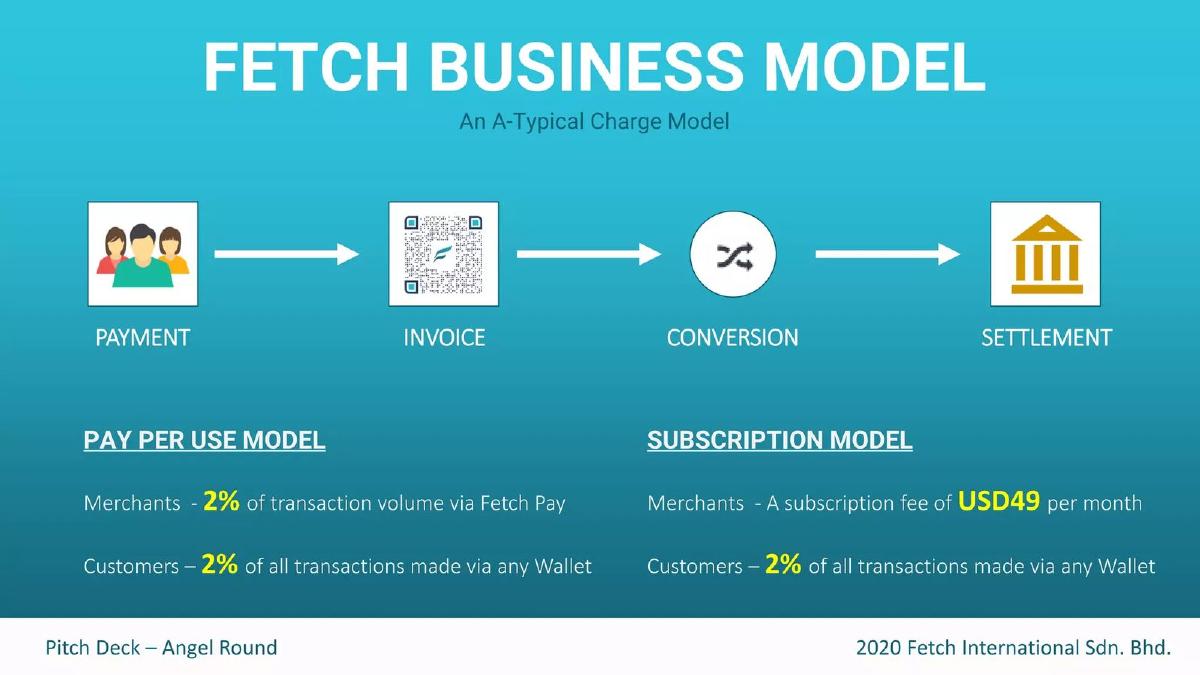
Fetch deck, slide 12. Exact stored slide matched to this analysis.
Our analysis: Lets merchants choose by volume; the two options break even at $2,450 a month.
Evidence and limitation: Two options with no sign of which one drives revenue.
What a founder can adapt: Say which option most customers choose and the revenue share of each.
Supporting analysis
What the deck claims: Pay per use: merchants 2% of transaction volume via Fetch Pay. Subscription: merchants USD49 per month. Customers 2% of all wallet transactions in both.
Presentation choice: Lets merchants choose by volume; the two options break even at $2,450 a month.
When it does not fit: Two options with no sign of which one drives revenue.
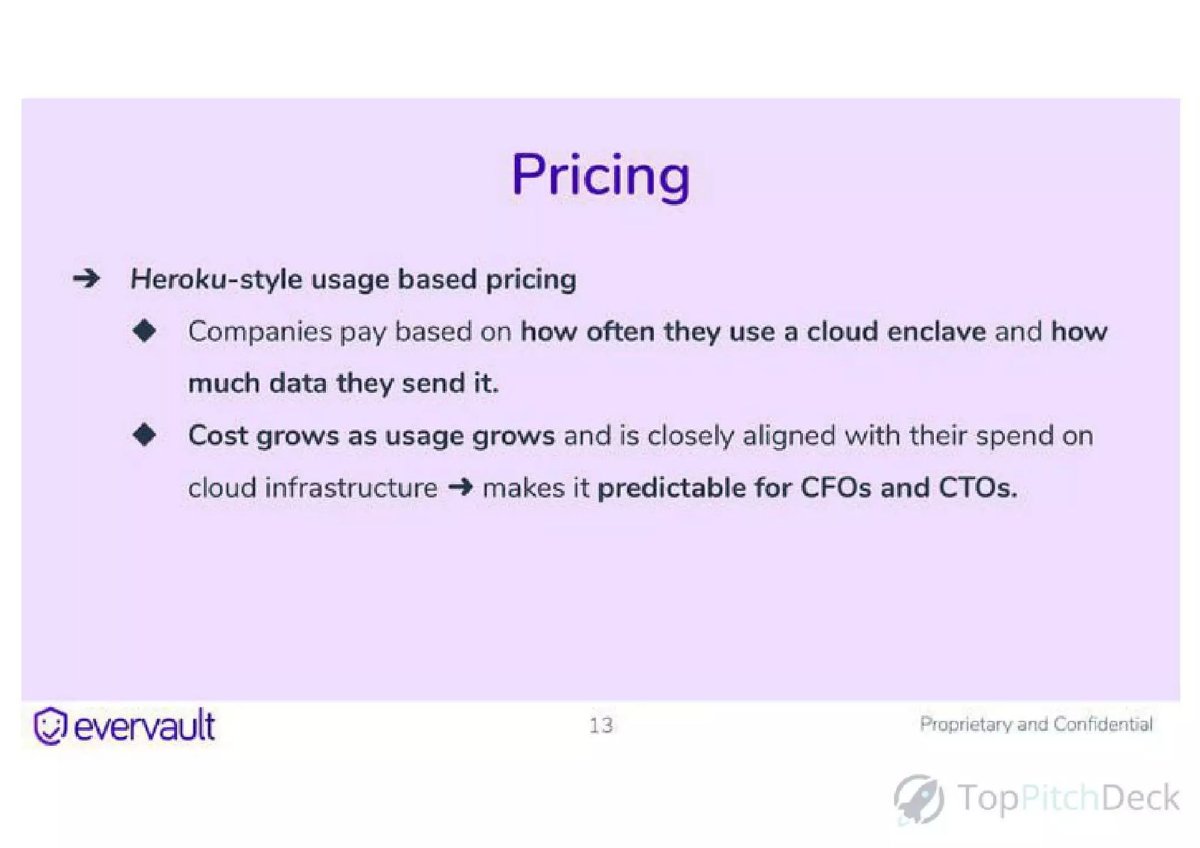
Evervault deck, slide 11. Exact stored slide matched to this analysis.
Our analysis: Turns variable bills into an advantage by tying them to a cost buyers already plan for.
Evidence and limitation: Units with no prices.
What a founder can adapt: Add one example customer bill.
Supporting analysis
What the deck claims: "Heroku-style usage based pricing." "Companies pay based on how often they use a cloud enclave and how much data they send it." Cost grows with usage, aligned with cloud spend, "predictable for CFOs and CTOs".
Presentation choice: Turns variable bills into an advantage by tying them to a cost buyers already plan for.
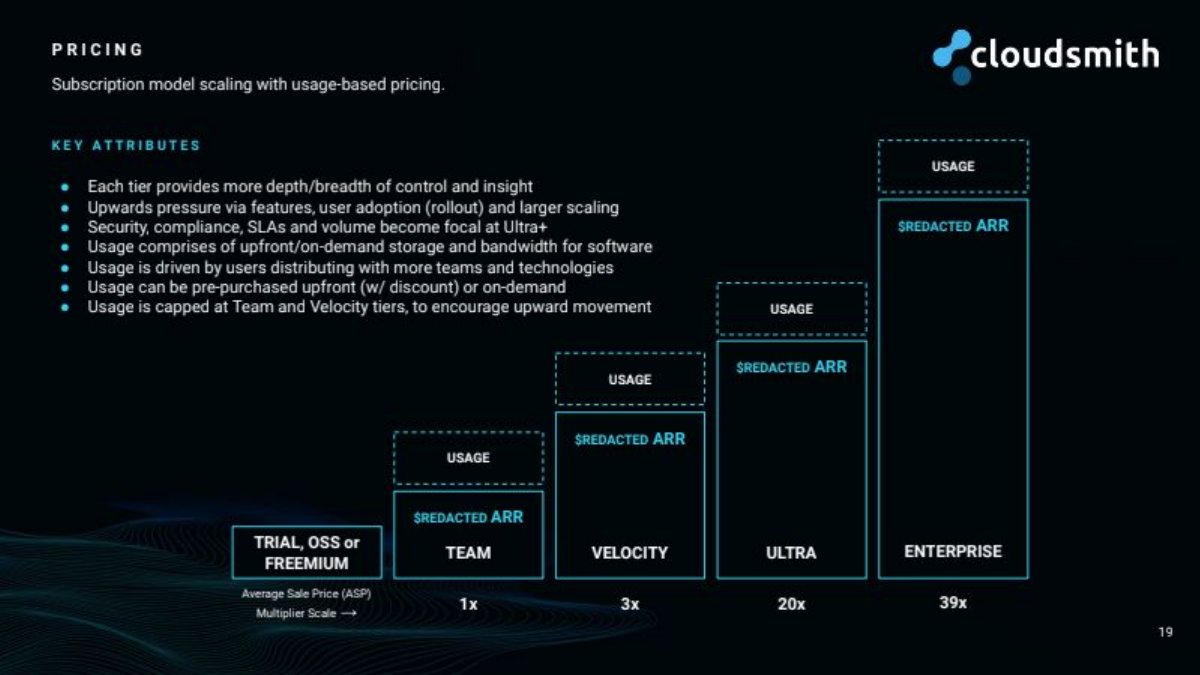
Cloudsmith deck, slide 19. Exact stored slide matched to this analysis.
Our analysis: Shows how usage stacks on tiers and how contract size grows across them.
Evidence and limitation: A pricing slide where every figure is blacked out.
What a founder can adapt: Keep the structure and show at least one real price or average contract.
Supporting analysis
What the deck claims: "Subscription model scaling with usage-based pricing." Paid tiers Team, Velocity, Ultra, Enterprise with usage on top; contract value multipliers 1x, 3x, 20x, 35x; usage of storage and bandwidth, bought upfront at a discount or on demand. Revenue per tier redacted.
Presentation choice: Shows how usage stacks on tiers and how contract size grows across them.
When it does not fit: A pricing slide where every figure is blacked out.
Training courses delivered by text message. Memo-style deck.
Arist deck, slide 17. Exact stored slide matched to this analysis.
Our analysis: A contrast example: a company that left usage pricing for predictable monthly revenue.
Evidence and limitation: Announcing a switch without the reason.
What a founder can adapt: If you switched models, say what prompted it.
Supporting analysis
What the deck claims: Bucket-based tiers by learner count and budget, averaging "$XX per user, per year" (redacted). "We initially started with a usage-based model, and transitioned to MRR agreements in November 2020."
Presentation choice: A contrast example: a company that left usage pricing for predictable monthly revenue.
When it does not fit: Announcing a switch without the reason.
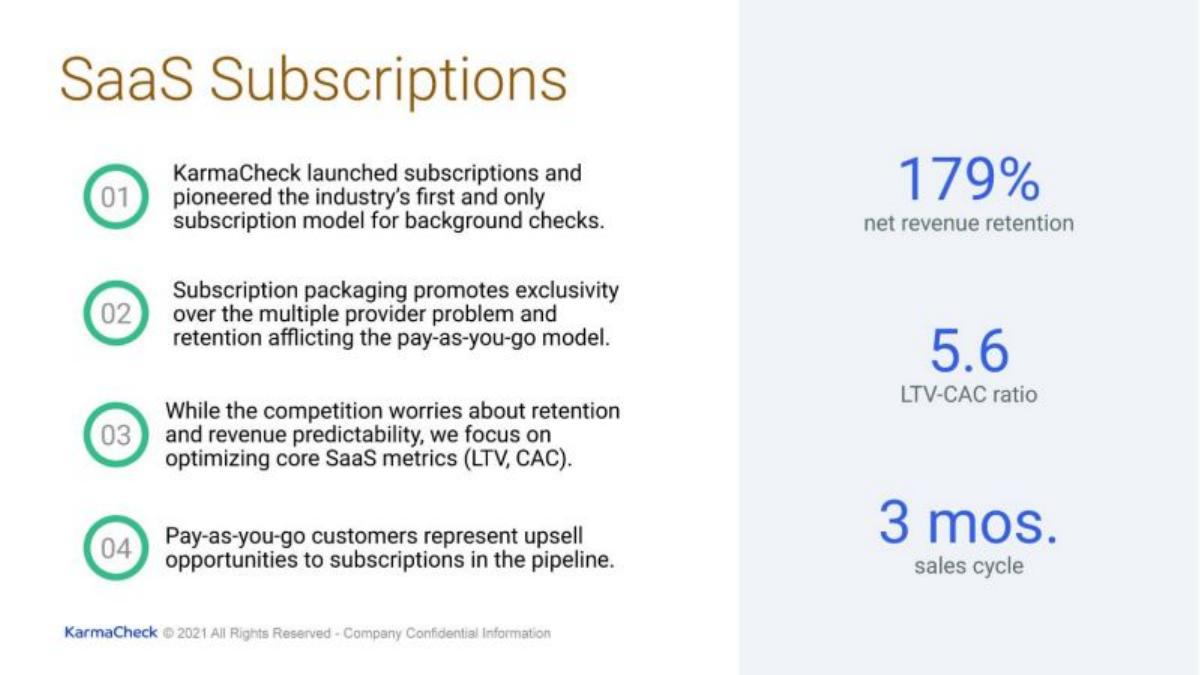
KarmaCheck deck, slide 13. Exact stored slide matched to this analysis.
Our analysis: A contrast example: pay-as-you-go as the entry point, subscriptions as the business.
Evidence and limitation: Retention claims with no split by model.
What a founder can adapt: Show the share of customers and revenue on each model.
Supporting analysis
What the deck claims: Subscriptions fix "the multiple provider problem and retention afflicting the pay-as-you-go model"; "Pay-as-you-go customers represent upsell opportunities to subscriptions". 179% net revenue retention, 5.6 LTV:CAC, 3-month sales cycle.
Presentation choice: A contrast example: pay-as-you-go as the entry point, subscriptions as the business.
When it does not fit: Retention claims with no split by model.
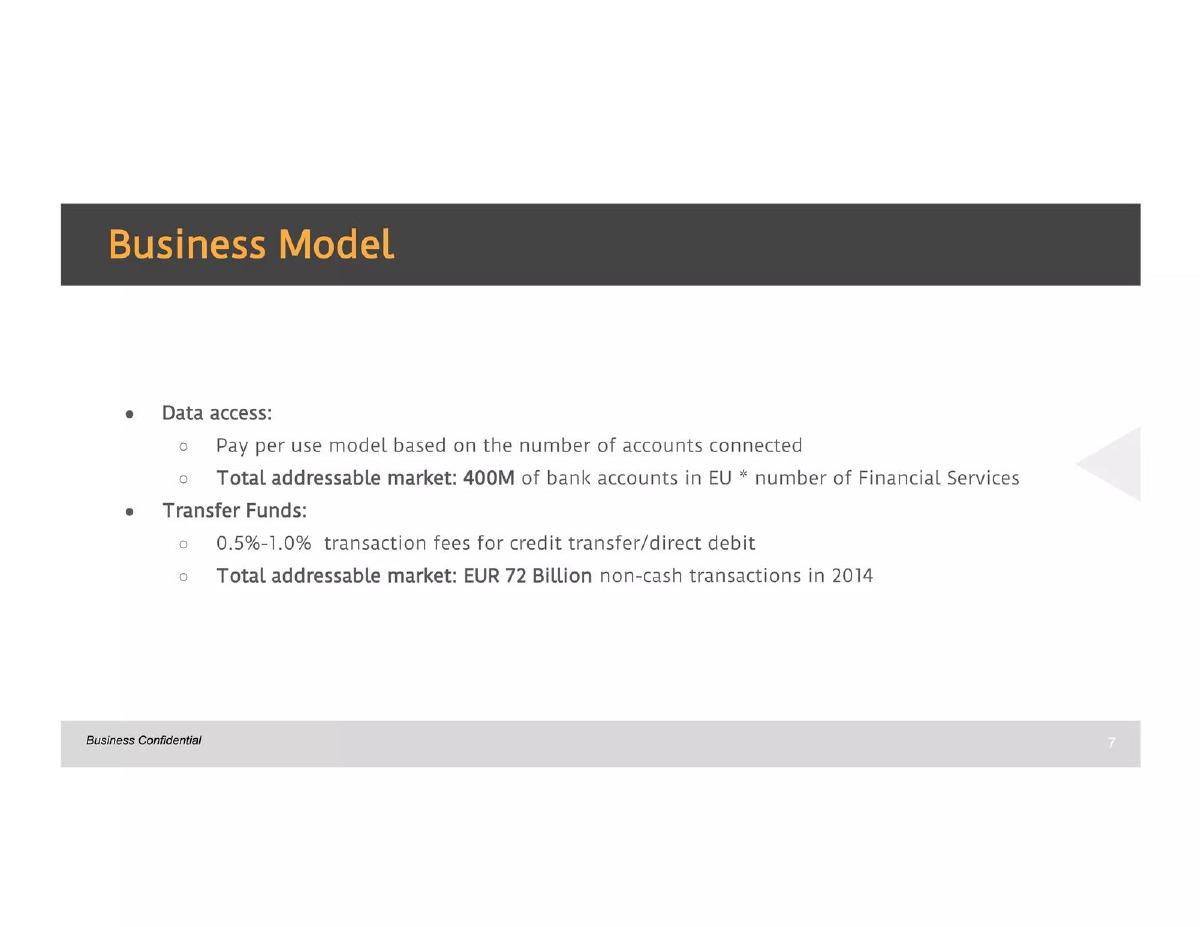
Finport (TrueLayer) business model slide — slide 7
Bank data and payments platform. Original seed deck, 2016.
Finport (TrueLayer) deck, slide 7. Exact stored slide matched to this analysis.
Our analysis: A weak example to learn from: a clear unit and a market size, but no price per account.
Evidence and limitation: Pairing a unit with a market size and nothing in between.
What a founder can adapt: Put a price on the unit so the market size means something.
Supporting analysis
What the deck claims: "Pay per use model based on the number of accounts connected" (400M EU bank accounts); transfer fees 0.5–1.0% (EUR 72 billion non-cash transactions in 2014).
Presentation choice: A weak example to learn from: a clear unit and a market size, but no price per account.
When it does not fit: Pairing a unit with a market size and nothing in between.
What each usage-based pricing slide tells an investor
Most slides name a model; few give the unit, the price and a typical customer's volume together.
Example
Unit named
Price per unit
Typical volume
Committed revenue
Carma
Yes (per check, seat, transaction)
Yes
Yes (one client)
No
MindsDB
Yes (hour)
Yes ($0.9 / $0.7)
No
Yes (prepaid rate)
Fetch
Yes (transaction)
Yes (2%)
No
Yes ($49 subscription)
Camdog
Yes (hour)
Yes ($0.1)
No
Yes ($49 base)
Evervault
Yes (enclave use, data)
No
No
No
Cloudsmith
Yes (storage, bandwidth)
No (redacted)
No
Yes (tiers, upfront)
Algolia
Units (unnamed)
No
No
Partly (ARR via sales)
Arist
Moved away
Redacted
No
Yes (MRR)
KarmaCheck
Contrast
No
No
Yes (subscriptions)
Finport
Yes (account)
No
No
No
Key Takeaways
Name the unit: per hour, per check, per account, per transaction.
Print the price of one unit and the volume of a typical customer.
Show how a customer's bill grows as they use more.
Explain how you make usage revenue predictable: prepaid commitments, minimums or a base plan.
If you moved away from pay-per-use, say why.
Test your usage-based pricing slide before you send it
Answer these with numbers, even if they are targets.
Unit. What exactly does the customer pay for?
Price. What does one unit cost, and is there a discount for committing in advance?
Volume. How many units does a typical customer use each month?
Growth. How much does a customer's usage grow in its first year?
Committed. What share of revenue is prepaid or contracted?
Copyable framework: [Price] per [unit]; typical customer uses [volume] a month ([bill]/year); [share]% of revenue on prepaid contracts
Illustrative example 1 — written by us
Before: Usage based pricing. Pricing based on units.
After: [Price] per [unit]; median customer [volume] units a month; usage per account grows [rate]% in year one; [share]% on annual contracts
What improved: Our illustrative rewrite, not Algolia's text. Bracketed parts are placeholders, not company facts. It turns labels into numbers an investor can test.
What this guide covers
Usage-based pricing means a customer's bill depends on how much they use: API calls, hours of computing, checks run, accounts connected, payments processed. Pay-as-you-go is the simplest form, with no commitment at all. Many companies combine it with a subscription: a base fee that includes some usage, with extra usage charged on top.
Investors look at this model with two questions. First, does revenue grow automatically as customers grow? That is the appeal: a customer that doubles its use doubles its bill without a new sales conversation. Second, how predictable is it? A customer on pay-as-you-go can stop tomorrow, and a quiet month for them is a quiet month for you. A good slide answers both.
Our SaaS business model guide covers subscription pricing, and our pricing guide covers price levels and packaging in general. Neither explains how to present pricing tied to use. We searched our corpus for usage-based, pay-per-use and pay-as-you-go pricing and found 47 slides across 44 decks. Ten were readable, came from companies that were private when they made the deck, and differ enough to teach something.
Name the unit and price it
The unit is the most important choice in a usage-based model, and the slide should state it plainly. It should be something the customer understands and that grows with the value they get.
Carma, which made underwriting and collection software for pay-as-you-go solar companies in emerging markets, gives the most complete example in this set. Its 2018 business model slide says "Revenue Model: pay-as-you-go" and shows a table of units, volumes, fees and totals. Underwriting for 30,000 end customers at $0.25 each comes to $7,500; data cross-validation at $0.25 to another $7,500; a credit score at $0.50 to $15,000. Underwriting for 2,000 top-up agents at $5 comes to $10,000, and 270,000 top-up app transactions at $0.05 to $13,500. A second group is priced per seat: 10 call-centre agents at $900 ($9,000), 100 service agents at $150 ($15,000), 3 dispatchers at $1,000 ($3,000), and credit limits for 2,000 agents at $5 ($10,000). The total is $90,500, and the lines add up.
The table shows exactly what a single client of Carma's size would pay and which units drive the bill. It is a lifetime revenue example for one client, labelled "Pricing and Lifetime Revenue Potential", rather than a forecast; a stronger version would say how many clients of this size Carma expected and over what period the $90,500 is earned. The pie chart next to the table splits revenue by product, but its labels are too small to read in the deck.
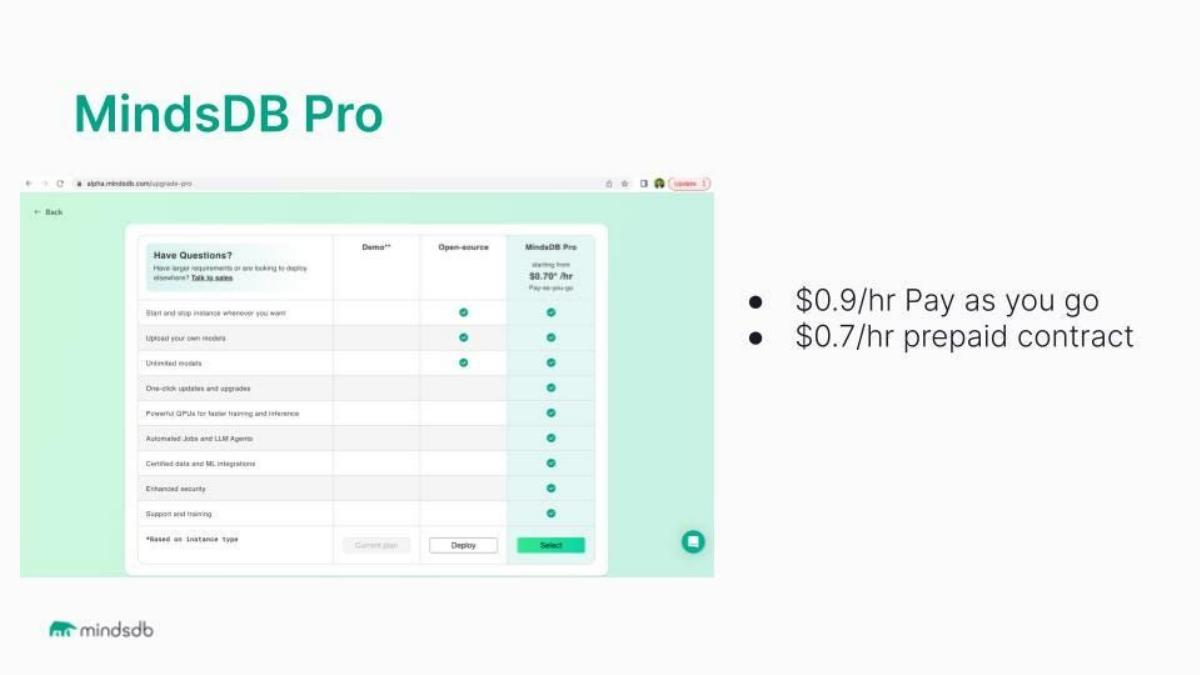
MindsDB, which provides a platform for building AI applications on top of databases, keeps its pricing slide to two lines beside a screenshot of its plans: "$0.9/hr Pay as you go" and "$0.7/hr prepaid contract". The unit is an hour of use. The two prices tell an investor the most useful thing about this model: MindsDB offers a 22% lower rate to customers who commit in advance, which is how a usage business turns unpredictable revenue into contracted revenue. What the slide leaves out is how many hours a typical customer uses, so there is no way to estimate a customer's annual bill.
Combine usage with a base fee
Pure pay-as-you-go is rare in these decks. Most companies pair a usage charge with a subscription, and the slide should make clear how the two fit together.
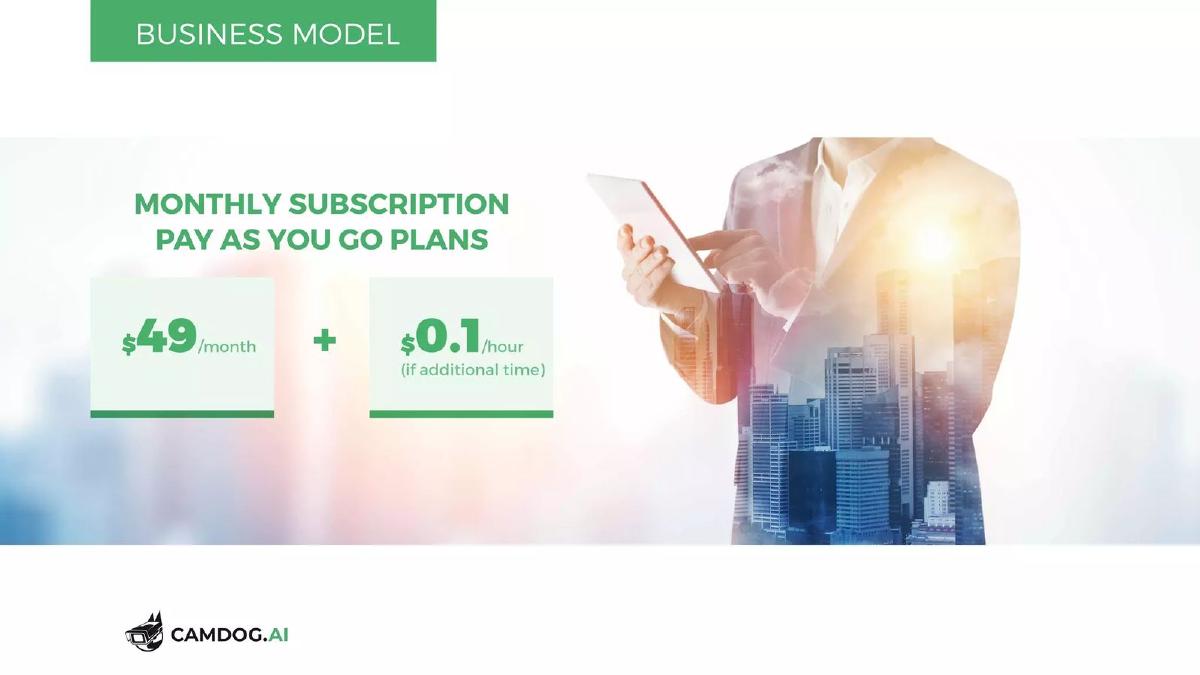
Camdog, which sold cloud video surveillance to small businesses, shows the simplest version: a "$49/month" monthly subscription plus "$0.1/hour (if additional time)". A customer pays a fixed fee that covers normal use and a small charge per extra hour. That is clear and easy to understand. The slide doesn't say how much time the $49 includes, so a reader can't tell how often the extra charge applies.
Fetch, a Malaysian payments company, shows two options side by side on its 2020 angel-round slide. Under "Pay per use model", merchants pay 2% of transaction volume through Fetch Pay. Under "Subscription model", merchants pay a subscription fee of USD49 per month. In both, customers pay 2% of all transactions made via any wallet. The comparison lets a merchant choose based on its volume: a small merchant pays less with the percentage, a large one with the flat fee. A merchant processing $2,450 a month pays the same either way. The slide doesn't say which option merchants choose in practice, or what share of revenue comes from each.
Cloudsmith, which provides software package management, titles its pricing slide "Subscription model scaling with usage-based pricing". A chart of five tiers (trial, dev or freemium; Team; Velocity; Ultra; Enterprise) shows a usage block on top of each paid tier, with an average contract value multiplier of 1x, 3x, 20x and 35x across the paid tiers. The key attributes say usage covers storage and bandwidth, is driven by users across teams, and can be bought upfront at a discount or on demand. The annual revenue for each tier is blacked out in the deck itself, so the slide shows the structure but not the money.
Explain why usage pricing suits the buyer
Usage pricing can make the buyer nervous: a bill that changes each month is harder to budget. A good slide turns that into an advantage.
Evervault, which provides encryption infrastructure for developers, titles its slide "Heroku-style usage based pricing". It says "Companies pay based on how often they use a cloud enclave and how much data they send it" and that "Cost grows as usage grows and is closely aligned with their spend on cloud infrastructure", which "makes it predictable for CFOs and CTOs". The argument is that customers already budget for cloud costs that grow with use, so an encryption bill that tracks the same pattern is easy to plan for.
That is a strong framing, and it names two units: enclave use and data volume. What it doesn't do is put a price on either. An investor can't tell whether a typical customer pays hundreds or hundreds of thousands a year. Adding one example bill would complete the slide.
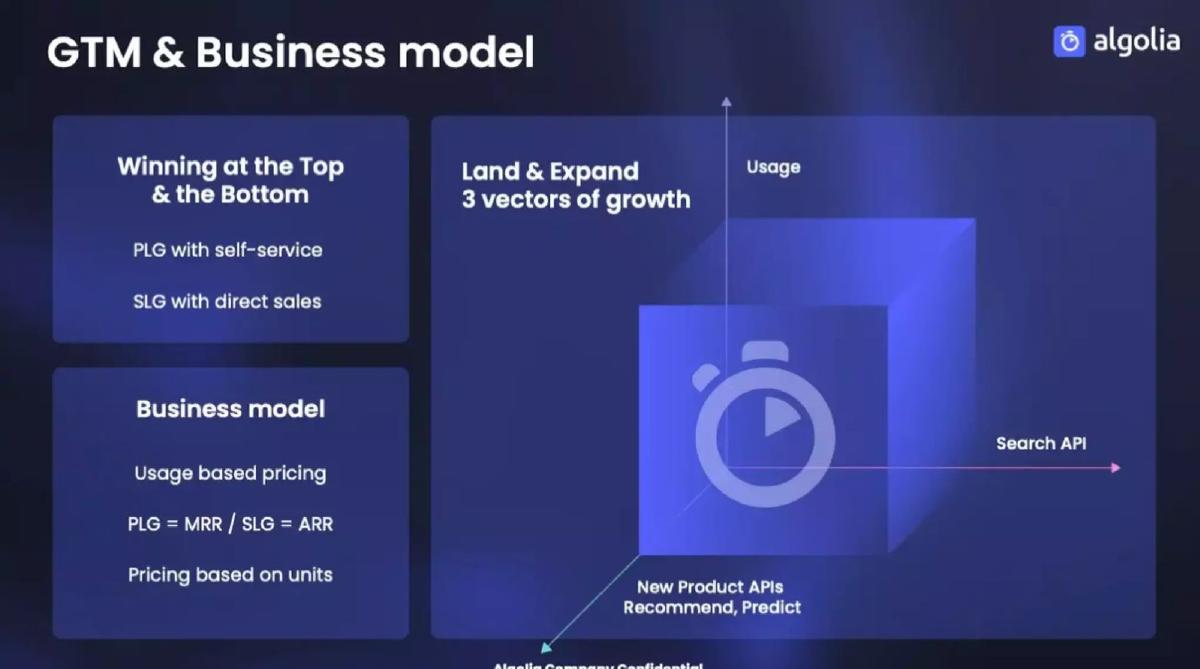
Algolia, which provides search for websites and apps, lists its model in a panel on its go-to-market slide: "Usage based pricing", "PLG = MRR / SLG = ARR" and "Pricing based on units". The shorthand says self-service customers pay monthly and customers won through direct sales sign annual contracts, both priced on usage units. It is enough for a reader who already knows the company. It doesn't name the unit, the price, or how usage grows inside an account, so it works only as a summary that later slides would need to support.
When companies move away from pay-per-use
Some of the most useful slides in this set argue against pure usage pricing. They show investors that the founders understand the model's weaknesses.
Arist, which delivers training courses by text message, describes its pricing in a written memo-style deck. It now uses "a bucket-based pricing model" with tiers based on a client's learner count and budget, averaging "$XX per user, per year" (the figure is redacted in the published deck). The third bullet says: "We initially started with a usage-based model, and transitioned to MRR agreements in November 2020. For the past year, our focus has been exclusively on MRR growth." Arist doesn't say why it switched, but the move tells an investor it chose predictable monthly revenue over usage. Saying what prompted the change (uneven bills, slow budgeting, churn) would make the slide stronger.
KarmaCheck, a background-check company, makes the case directly on a slide titled "SaaS Subscriptions". It says it "launched subscriptions and pioneered the industry's first and only subscription model for background checks", that subscription packaging fixes "the multiple provider problem and retention afflicting the pay-as-you-go model", and that "Pay-as-you-go customers represent upsell opportunities to subscriptions in the pipeline." Beside the text it shows 179% net revenue retention, a 5.6 LTV to CAC ratio and a three-month sales cycle. The slide treats pay-as-you-go as the way customers start, and subscriptions as where it makes its money. It doesn't say what share of customers or revenue is on each.
Weak examples
Finport, the original 2016 seed deck of the company that became TrueLayer, describes "Data access: Pay per use model based on the number of accounts connected" and transfer fees of 0.5–1.0% for credit transfers and direct debits. Each line is paired with a market size (400M bank accounts in the EU; EUR 72 billion in non-cash transactions in 2014). The unit is clear, but there is no price per account, so the slide gives a model and a market without the link between them.
Two other slides in our search mention usage pricing only in passing. Smartrr lists "Our usage based pricing model aligns our growth with our merchants' success" as one of three differentiators, and Flora headlines "Pay for Output, Not Seats" on a customer slide. Neither names a unit or a price, so we have not included them as examples.
The numbers investors look for
A usage-based slide is strongest when it shows the unit, the price per unit, the usage of a typical customer, and what share of revenue is committed in advance. None of the ten slides shows all four.
A worked example shows why usage per customer matters. Suppose a company charges $0.10 per API call. A customer making 100,000 calls a month pays $10,000 a month, or $120,000 a year. If that customer's use grows 50% over the year, it ends the year paying $15,000 a month without any new sale. If half of all revenue comes from customers on prepaid contracts at a lower rate, that half is predictable and the rest moves with use. These figures are illustrative, not drawn from any deck in this guide, but they show the three numbers an investor needs: price, volume and the committed share.
If you offer both pay-as-you-go and a subscription, say what share of customers and revenue sits on each, and whether customers tend to move from one to the other.
Common mistakes
No unit. Say what the customer pays for.
No price. Print the price per unit.
No volume. Show what a typical customer uses, so the bill can be estimated.
Ignoring predictability. Show prepaid, minimum or base-plan revenue.
Unexplained switch. If you left usage pricing, say why.
Diagnostic checklist
Unit named.
Price per unit stated.
Typical customer volume or bill shown.
Committed share of revenue stated.
Reason the model suits the buyer.
Frequently asked questions
How we chose these examples
Corpus: published pitch deck teardowns on StartupFundraising.com. Founder-uploaded private decks are excluded.
Selection (2026-10-01): we searched extracted slide text for usage-based pricing, pay-per-use and pay-as-you-go (47 slides, 44 decks), then read each candidate from images made from the original deck files.
Eligibility: each company was private when its deck was made. MindsDB (Series A, February 2023), Evervault (Series B, March 2026), KarmaCheck (Series A 2022, Series B 2024), Cloudsmith (Series A, September 2021), Finport/TrueLayer (seed, 2016–2017), Camdog (pre-seed and equity crowdfunding) and Carma (2018 seed deck) were checked against public funding records or the deck itself. Fetch's deck is marked as an angel round. Algolia and Arist rest on their own decks and the absence of any known listing.
Not used: Smartrr and Flora (one-line mentions with no unit or price); several decks that mention pay-as-you-go only as a market term.
Arithmetic: Carma's nine lines were added and match its $90,500 total. The Fetch break-even ($2,450 a month, where 2% equals $49) and MindsDB's 22% prepaid discount are our calculations from the slides' figures.
Overlap check: the SaaS business model and pricing guides mention usage pricing in passing; no guide covers how to present it.
Review: all ten slide images were inspected on 2026-10-01 and matched to company, deck and slide number (AI editorial model review). No person has yet completed an editorial review of this page. The worked API example uses illustrative figures, not company data.
Figures are the companies' own claims; we did not verify underlying data. We make no claim that any slide caused a fundraising outcome.