Developer Tools Problem Slides: 7 Real Pitch Deck Examples
How developer tools startups frame the problem: engineering time lost, steps that break or tools that fall short, measured for a specific team.
Developer Tools Problem Slide: Show the Engineering Time Lost
Developer tools are bought to save engineering time or remove work that breaks. Investors read a devtools problem slide for who loses that time, how much, and why the tools teams use today don't fix it. This guide compares seven real problem slides from decks tagged developer tools in our library, from a monitoring company that puts a number on time lost to defects to a slide that says only that dev environments are getting more complex.
TL;DR
Measure the time or work lost, for a named team, and say why current tools fall short. Plumbr says applications have "1-2 serious defects per developer every year", each taking "average 3 weeks" and holding up "nearly 10%" of development resources. Promethium quotes three survey figures on data-driven decisions with sources. Fivetran draws the six manual steps of traditional ETL. Apifier names three alternatives and why each fails. M30 and Ably describe the gap without a number, and CodeSandbox gives one sentence about complexity.
Developer tools problem slides from real pitch decks
Each example shows the exact stored slide above its analysis and links to the full teardown. The clearest slides come first; weaker ones follow for contrast. Claims are as shown on the slides; comments are ours.
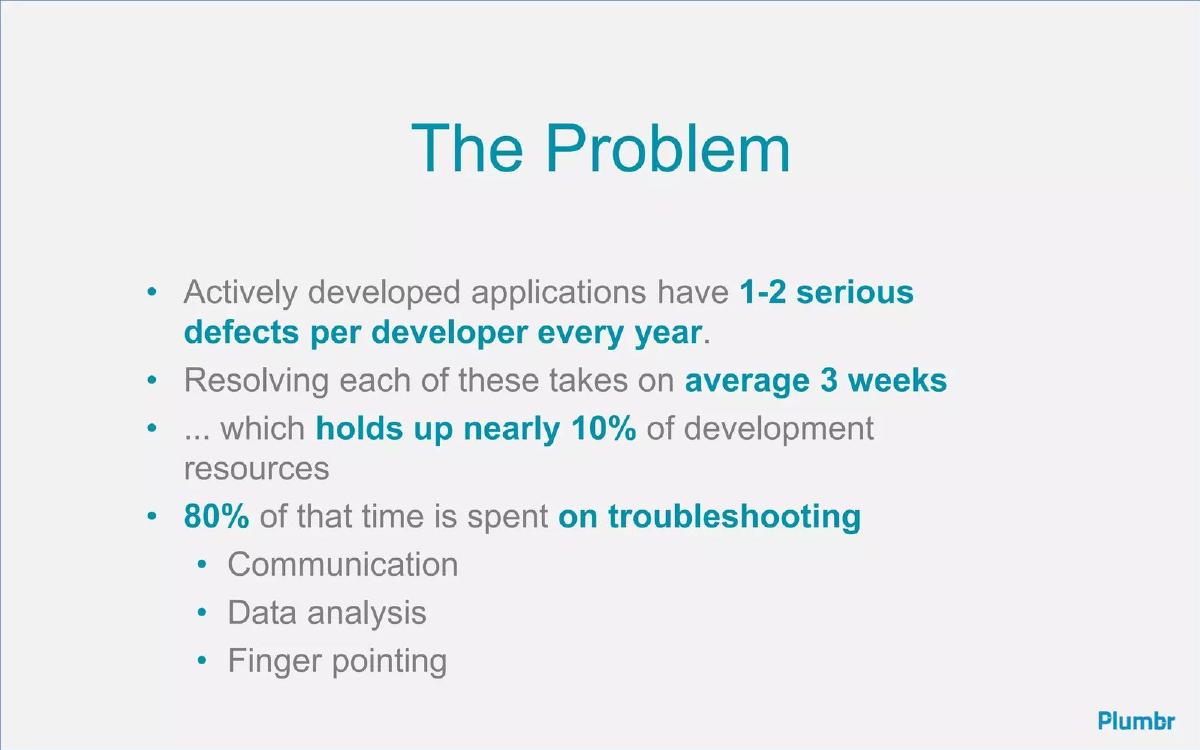
Plumbr problem slide — slide 4
Application performance monitoring. Slide titled "The Problem".
Plumbr deck, slide 4. Exact stored slide matched to this analysis.
Our analysis: Each line builds on the last, from defects to weeks to a share of the engineering budget, so a buyer can estimate the cost for their own team. The figures have no source.
Evidence and limitation: A defect rate, a time per defect, a share of resources and a breakdown of where the time goes.
What a founder can adapt: Add a source for the defect rate and the three-week figure.
Supporting analysis
What the deck claims: "Actively developed applications have 1-2 serious defects per developer every year." "Resolving each of these takes on average 3 weeks" "... which holds up nearly 10% of development resources". "80% of that time is spent on troubleshooting": "Communication", "Data analysis", "Finger pointing".
Presentation choice: For a developer tool, time lost is the problem and time saved is the return; this slide measures both sides of that.
When it does not fit: Chained estimates without saying where the first number comes from.
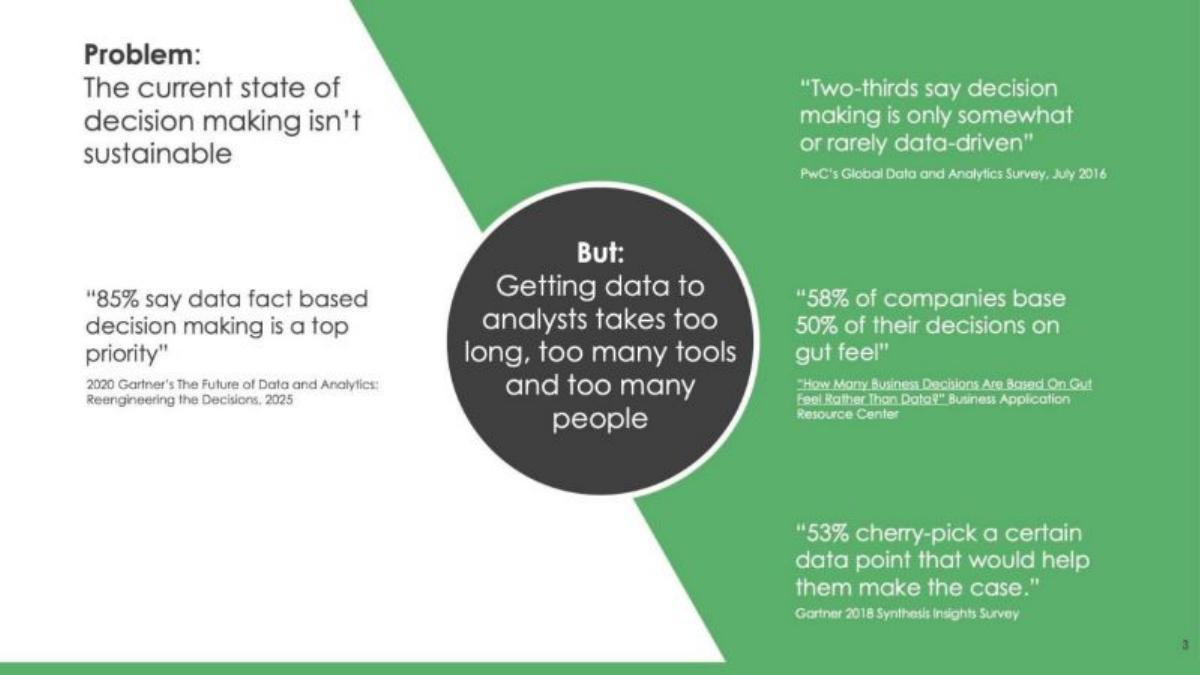
Data analytics platform. Slide titled "Problem: The current state of decision making isn't sustainable".
Promethium deck, slide 3. Exact stored slide matched to this analysis.
Our analysis: The sources make the figures easy to check, and the centre sentence names the cause: time, tools and people between data and analysts. The figures show the gap in decisions, not the time lost, and the 2016 survey is dated.
Evidence and limitation: Four survey figures, each with a named source, and one sentence on the cause.
What a founder can adapt: Add how long getting data to analysts takes today.
Supporting analysis
What the deck claims: "85% say data fact based decision making is a top priority" (Gartner). Centre: "But: Getting data to analysts takes too long, too many tools and too many people". "Two-thirds say decision making is only somewhat or rarely data-driven" (PwC, July 2016); "58% of companies base 50% of their decisions on gut feel"; "53% cherry-pick a certain data point that would help them make the case" (Gartner 2018).
Presentation choice: Sourced figures carry more weight than unsourced ones, especially on a problem slide.
When it does not fit: Survey figures that describe a trend but not the buyer's cost.
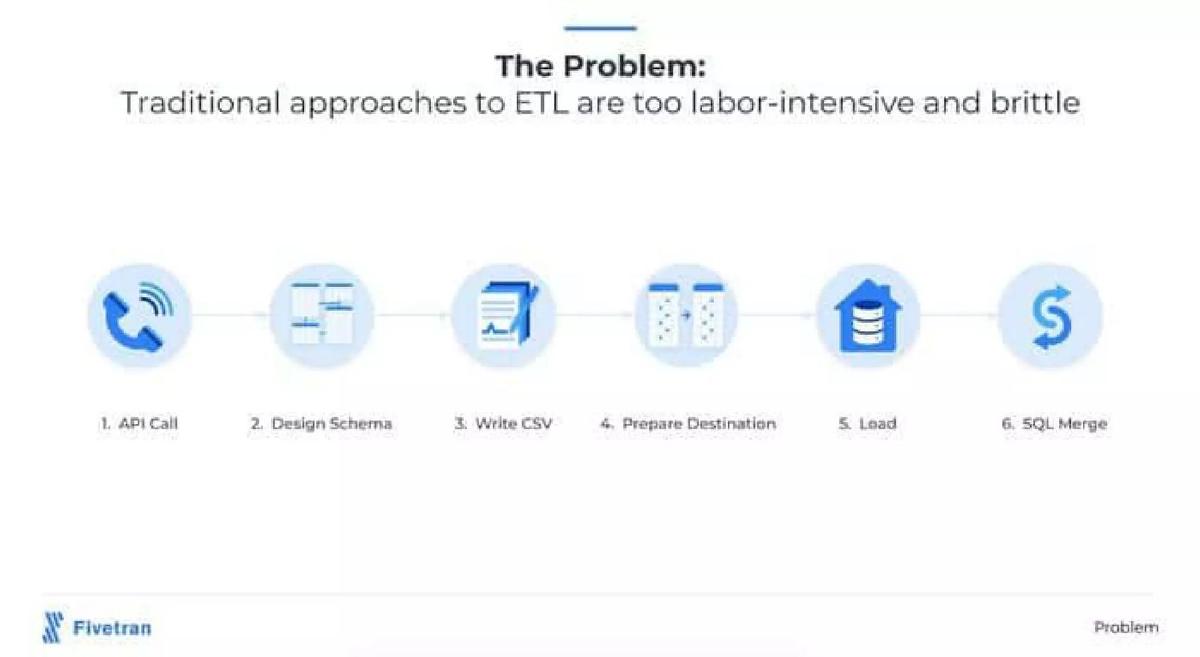
Data pipeline (ETL) service. Slide titled "The Problem: Traditional approaches to ETL are too labor-intensive and brittle".
Fivetran deck, slide 3. Exact stored slide matched to this analysis.
Our analysis: Listing every step shows a data engineer the work they would skip, and "brittle" says each step can break. The slide doesn't say how long the steps take or how often they fail.
Evidence and limitation: A headline claim and the six manual steps it refers to.
What a founder can adapt: Add the hours per pipeline or how often pipelines break.
Supporting analysis
What the deck claims: Six numbered steps with icons: "1. API Call", "2. Design Schema", "3. Write CSV", "4. Prepare Destination", "5. Load", "6. SQL Merge".
Presentation choice: Drawing today's workflow makes the problem concrete for a technical buyer.
When it does not fit: Steps without a time or failure rate.
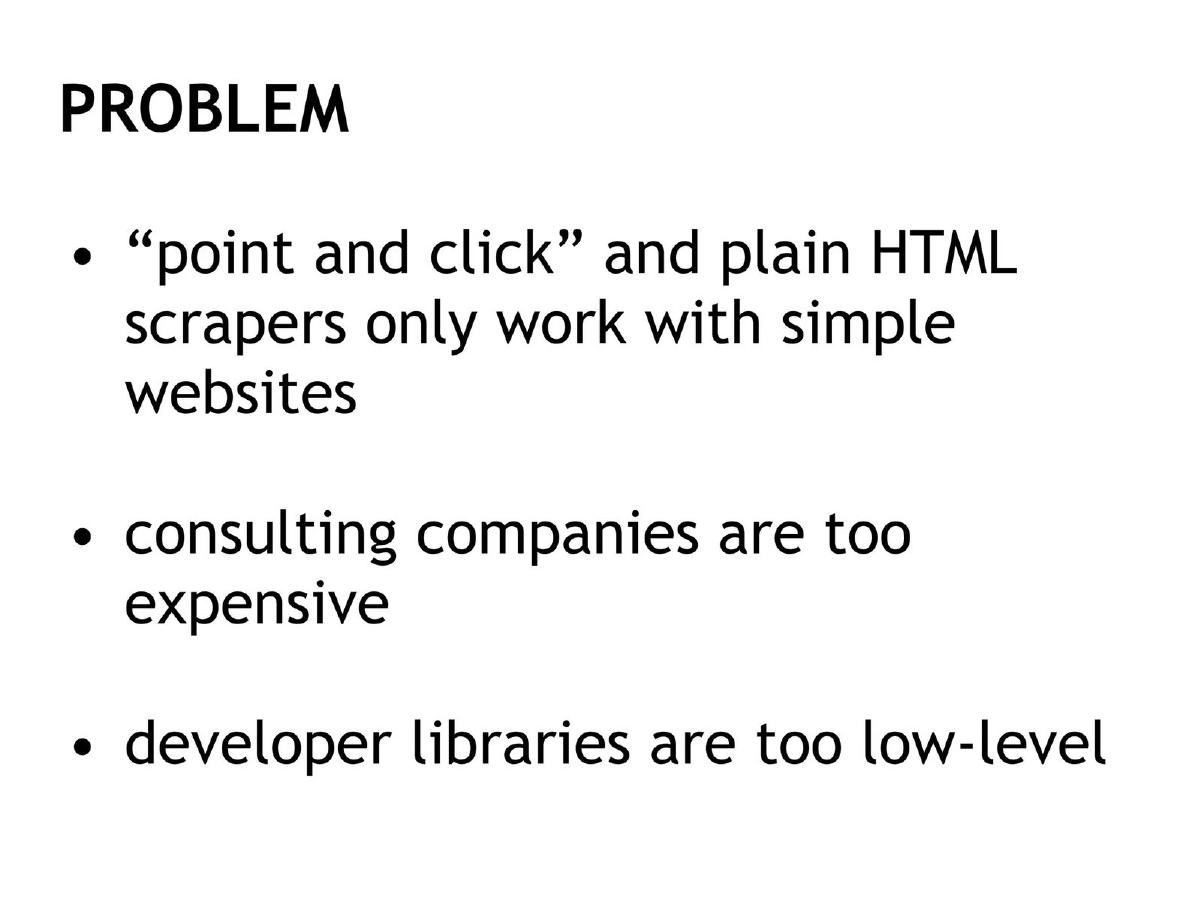
Web scraping platform (later Apify). Slide titled "Problem".
Apifier deck, slide 5. Exact stored slide matched to this analysis.
Our analysis: The slide defines the problem by what buyers use today and why each option fails, which also positions the product between them. There is no number and no named user.
Evidence and limitation: Three alternatives, each with the reason it falls short.
What a founder can adapt: Add what consultants cost or how long a library-based scraper takes to build.
Supporting analysis
What the deck claims: "'point and click' and plain HTML scrapers only work with simple websites"; "consulting companies are too expensive"; "developer libraries are too low-level".
Presentation choice: Naming alternatives answers the question of why buyers don't already solve this.
When it does not fit: "Too expensive" without a price.
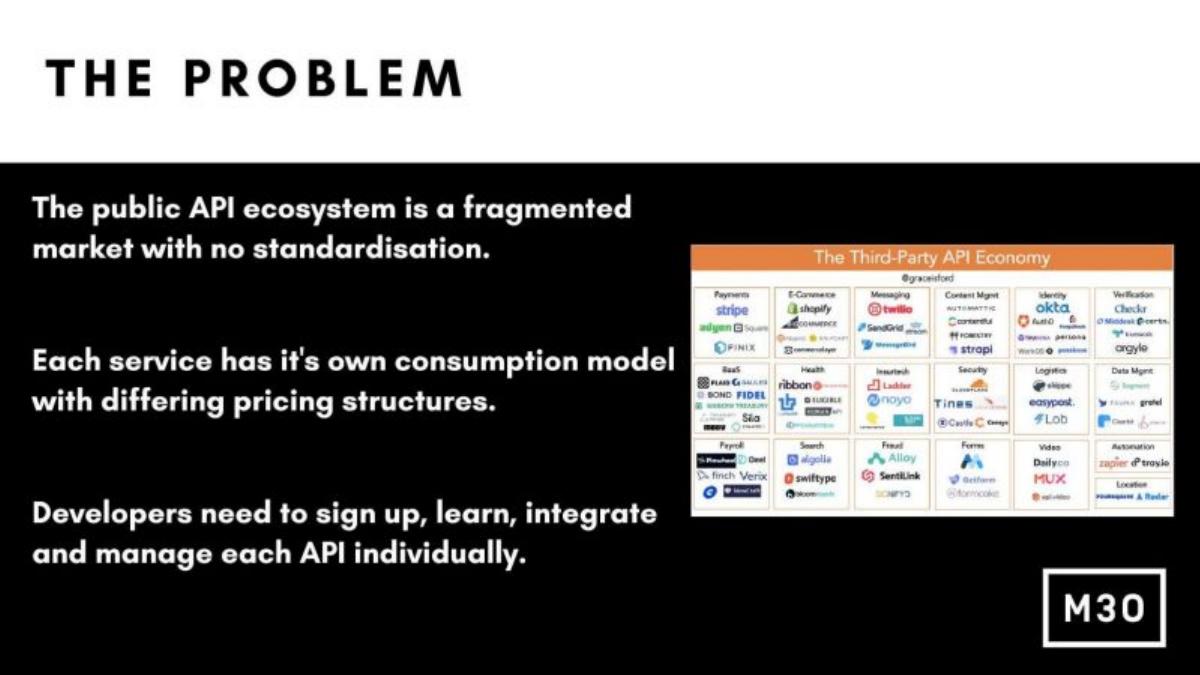
M30 deck, slide 2. Exact stored slide matched to this analysis.
Our analysis: The last line describes the repeated work clearly. The logo map shows how many APIs exist but not how many a typical team uses or how long each integration takes.
Evidence and limitation: A named user (developers), the work they repeat, and a map of APIs.
What a founder can adapt: Add how many APIs a typical team integrates and the time per integration.
Supporting analysis
What the deck claims: "The public API ecosystem is a fragmented market with no standardisation." "Each service has it's own consumption model with differing pricing structures." "Developers need to sign up, learn, integrate and manage each API individually." An image titled "The Third-Party API Economy" shows logos by category.
Presentation choice: Repeated work multiplies with each API, so a count would show the size of the problem.
When it does not fit: A logo map standing in for a number.
Realtime messaging infrastructure. Slide titled "The Problem Space".
Ably deck, slide 4. Exact stored slide matched to this analysis.
Our analysis: The slide admits alternatives exist and says where they fall short, which is honest. The four requirements are words; no outage, latency or cost figure shows what developers lose today.
Evidence and limitation: An acknowledgement of existing tools and four requirements they don't meet.
What a founder can adapt: Give one measure per requirement, such as outage hours with current tools.
Supporting analysis
What the deck claims: "Many solutions existed (and still exist) to augment applications with simple low-latency realtime updates." "Low-latency alone wasn't enough for the next wave of applications, where realtime data is intrinsic to the experience." "Developers need realtime with: Dependability, Scalability, Proximity, Simplicity".
Presentation choice: Infrastructure buyers want to know what goes wrong with current tools, such as downtime.
When it does not fit: A list of qualities in place of a failure.
Cloud development environment. Slide titled "Problem", dated 2020.
CodeSandbox deck, slide 2. Exact stored slide matched to this analysis.
Our analysis: Most of the slide explains why developers are important; the problem gets one line with no cost, such as time to set up an environment.
Evidence and limitation: One sentence on why developers matter and one on the problem.
What a founder can adapt: Replace the first sentence with setup time or time lost to environment issues.
Supporting analysis
What the deck claims: "Developers are building the future. They're the driving force behind all modern companies because software is at the heart of how fast a company can move, grow, and adapt." "But dev environments are getting more complex, and teams increasingly distributed."
Presentation choice: The context sentence doesn't tell an investor what developers lose.
When it does not fit: Spending the slide on why the user matters.
Whether an investor can see who has the problem, what it costs and why today's tools fail.
Example
Business
Who has it
Cost or number
Why today fails
Plumbr
App monitoring
Developers
3 weeks per defect; ~10% of resources
Troubleshooting time
Promethium
Data analytics
Analysts
Sourced survey figures
Too many tools and people
Fivetran
Data pipelines
Not stated (implied data engineers)
Not stated
Six manual, brittle steps
Apifier
Web scraping
Not stated
Not stated
Three alternatives fail
M30
API marketplace
Developers
Not stated
Each API integrated separately
Ably
Realtime infrastructure
Developers
Not stated
Low latency not enough
CodeSandbox
Cloud dev environments
Developers
Not stated
Complexity (unexplained)
Key Takeaways
Put a number on engineering time or resources lost.
Name the team that loses it: developers, analysts, data engineers.
Show the steps or tools teams use today and where they break.
Name the alternatives and why each falls short.
Source survey figures on the slide.
Build your developer tools problem slide
Measure the engineering time lost for a named team and say why current tools fall short.
Team. Which team loses time: developers, data engineers, analysts?
Time. How many hours or what share of their time is lost, as a number?
Today. What steps or tools do they use now?
Alternatives. Why does each alternative fall short?
Source. Where does each figure come from?
Copyable framework: Headline: [team] spends [time] on [task]. Today they [current steps or tool], which fails because [reason]. [Figure] ([source]).
Illustrative example 1 — written by us
Before: But dev environments are getting more complex, and teams increasingly distributed.
After: Setting up a dev environment takes a new engineer [time]; [team] lose [hours] a week to environment issues ([source]).
What improved: Our illustrative rewrite; the bracketed details are placeholders, not CodeSandbox's facts. It turns complexity into time lost.
What this guide adds
The general problem slide guide covers any company. Developer tools have a specific buyer, an engineering or data team, and a specific cost, people's time. Investors look for that cost measured, because it becomes the return a buyer gets from paying.
Our library's developer tools tag covers application monitoring, data pipelines, web scraping, API platforms, realtime infrastructure and cloud development environments. We note each company's business in the examples.
How we read each slide
We quote the text on the stored slide images. We have not checked any defect rate, survey figure or other claim.
Common mistakes
No time figure. Say how much engineering time is lost.
No team named. Say who loses the time.
Qualities instead of failures. Show what goes wrong, not what users want.
Context instead of problem. Don't spend the slide on why developers matter.
Unsourced figures. Give a source for defect rates and surveys.
Diagnostic checklist
A named team.
Time or resources lost, as a number.
Today's steps or tools.
Why alternatives fall short.
Sources for figures.
Frequently asked questions
What should a developer tools problem slide show?
Engineering time lost for a named team and why current tools don't fix it. Plumbr puts each serious defect at three weeks and nearly 10% of development resources.
Is drawing the current workflow enough?
It helps, as Fivetran's six ETL steps show, but add how long the steps take or how often they break.
Should I mention existing tools?
Yes, with why they fall short. Apifier names three alternatives and Ably admits existing realtime tools before saying where they fail.
How we chose these examples
Corpus: published pitch deck teardowns on StartupFundraising.com. Founder-uploaded private decks are excluded.
Selection (2026-09-27): we searched extracted slide text in decks tagged developer tools for slides that begin with "problem". 17 slides matched; we reviewed those with stored images and not used elsewhere.
Kept seven. Left out: Narrative p2 (already used in the marketplace problem slide guide) and its other problem slides, Bliss (two decks with the same three-item list, similar to Apifier without the alternatives), Fivetran p2 (a diagram; p3 is clearer), and slides whose problem isn't about developers or software teams (Chotmai, Deskdoo, GWF). No uploads were requested.
Review: stored slide text and images were checked on 2026-09-27 and matched to company, deck and slide number (editorial model review). No person has yet completed an editorial review of this page.
Claims are as shown on the slides; we have not verified them. We make no claim that any slide caused a fundraising outcome.