Cloudera’s 2008 pitch deck is a technical, thesis-driven presentation that focuses on the structural shift in computing and data management. Rather than leading with revenue or customer acquisition, the deck establishes a macro-trend: the end of uniprocessor performance gains and the rise of massive, unstructured data sets. By identifying Hadoop as the open-source implementation of Google’s proprietary MapReduce and GFS, Cloudera positioned itself as the enterprise-grade provider for a technology already validated by tech giants like Facebook, Yahoo!, and eBay. The deck is light on financial…
Key takeaways
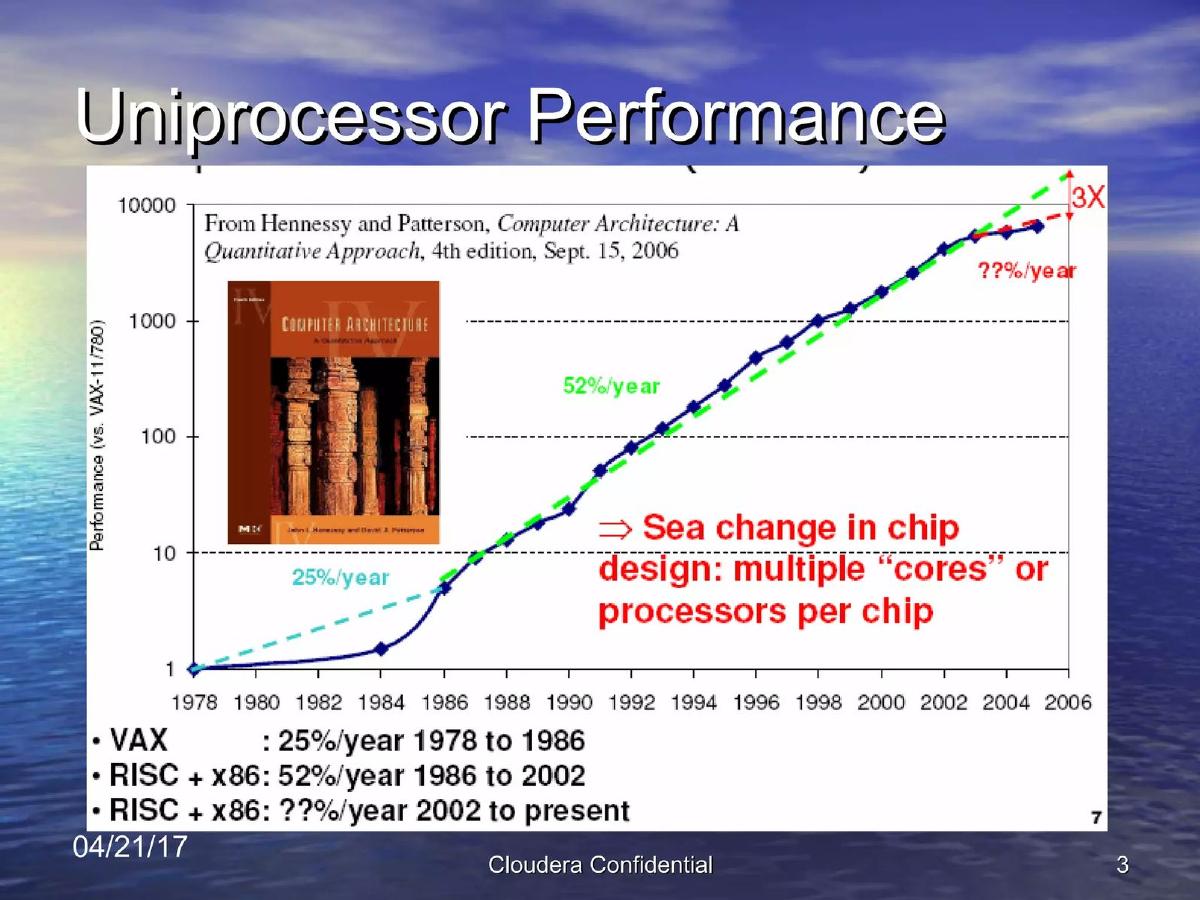
- The deck identifies a 'sea change' in chip design, moving from single-core performance to multi-core processors, necessitating new software architectures (Slide 3).
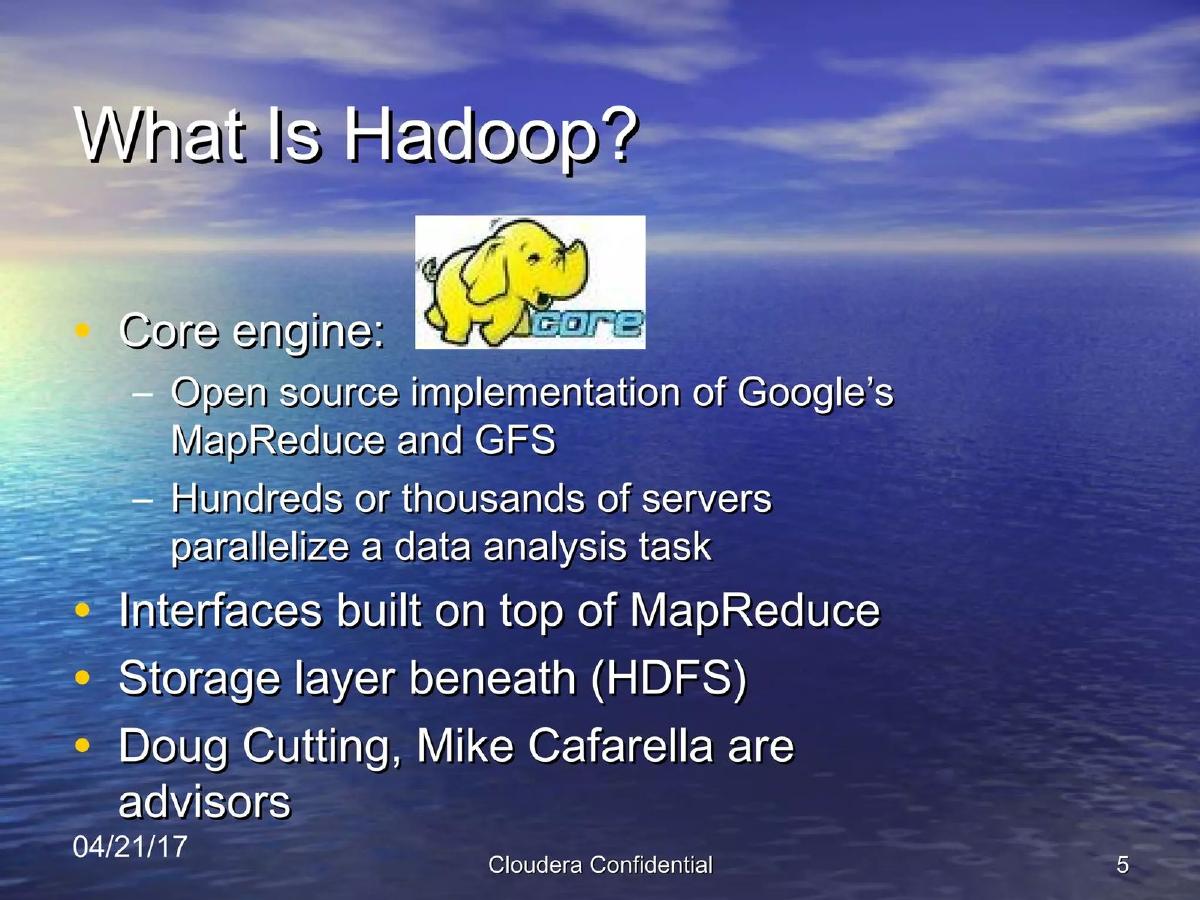
- Hadoop is explicitly defined as the open-source version of Google's MapReduce and GFS, leveraging 'hundreds or thousands of servers' (Slide 5).
- Social proof is established through a logo wall of early Hadoop adopters including Google, Facebook, Yahoo!, and The New York Times (Slide 7).
- Global demand is visualized through a Google Insights search volume map showing 'Hadoop' as a worldwide phenomenon as of September 2008 (Slide 9).
- The core problem identified is that current systems isolate users from 'event level raw data' due to expensive and non-queryable ETL grids (Slide 11).
- A spider chart compares Batch Data Processing (BDP) against OLAP/OLTP, showing BDP's superiority in handling 100PB+ volumes and unstructured schema complexity (Slide 13).
- Cloudera defines its value add as solving 'non-sexy' problems like resilience, fast recovery, and connector certification for enterprise compatibility (Slide 15).
- The deck omits a team slide, financial ask, and business model details in the provided 8-slide sequence.
Introduction: The Architecture of a Data Revolution
Cloudera’s 2008 pitch deck is a relic of a specific era in Silicon Valley—the moment when 'Big Data' transitioned from a niche Google whitepaper into a foundational enterprise requirement. The deck, titled "Cloudera: Hadoop for the Enterprise," is dated September 2008. It does not lead with a flashy vision statement; instead, it leads with a technical reality. The primary goal of this deck was to convince investors that the very nature of computing had changed, and that Cloudera was the only company prepared to bring the solution to the Fortune 500.
Slide 1: Title Slide
The title slide is minimalist, featuring a generic water-and-sky background. The subtitle, "Hadoop for the Enterprise," immediately defines the company’s category. In 2008, Hadoop was a known quantity among high-end engineers but lacked a commercial standard-bearer. Cloudera’s branding here is functional: they are the 'Enterprise' version of the open-source project.
Slide 3: The Hardware Inflection Point
Slide 3, titled "Uniprocessor Performance," is the most important slide for establishing the 'Why Now?' of the company. It features a graph from Hennessy and Patterson’s Computer Architecture: A Quantitative Approach . The data shows a clear trend: from 1986 to 2002, performance grew at 52% per year. However, post-2002, the curve flattens. The slide notes a "Sea change in chip design: multiple 'cores' or processors per chip." This establishes the technical necessity for distributed computing. If single chips aren't getting faster, you must use many chips in parallel. This is the foundational argument for Hadoop.
Slide 5: Defining the Solution
Slide 5 answers the question "What Is Hadoop?" It uses the iconic yellow elephant logo and breaks the technology down into three components: the core engine (an open-source implementation of Google’s MapReduce and GFS), the ability to use "hundreds or thousands of servers" to parallelize tasks, and the storage layer (HDFS). Crucially, it mentions that "Doug Cutting, Mike Cafarella are advisors." Mentioning the creators of Hadoop provides immediate technical credibility, signaling to investors that Cloudera has the 'inside track' on the project's development.
Slide 7: Market Validation via Logos
Slide 7, "Hadoop Users," is a classic social proof slide. It features logos from Google, Facebook, Yahoo!, eBay, and The New York Times , among others. By showing that both 'New Economy' giants and 'Old Economy' stalwarts (like the NYT and HP) were already using Hadoop, Cloudera proved the market wasn't just theoretical. The technology was already solving problems for the most sophisticated data users in the world.
Slide 9: The Global Trend
Slide 9, "Worldwide Phenomenon," uses a Google Insights map from September 2008 to show search volume for "Hadoop." The map shows significant interest in North America, Europe, and Asia (specifically India and China). This slide serves to prove that the demand is not just a Silicon Valley bubble but a global shift in how engineers are looking to solve data problems.
Slide 11: The Current System Failure
Slide 11, "Current Systems Isolate Users from the Event Level Raw Data," illustrates the problem with existing data architectures. It shows a complex diagram where "Expensive ETL Grids" act as bottlenecks, preventing data from reaching BI Reporting and Data Mining tools. The slide highlights "Non-Consumption" and "non-queryable" file server farms. The implication is clear: companies are collecting data they cannot use because their current systems are too expensive or too rigid to process it.
Slide 13: Technical Positioning
Slide 13 uses a spider chart to compare "BDP (Batch Data Processing)" versus "OLAP/OLTP." This is a sophisticated way to show market segmentation. It shows that while traditional databases (OLAP/OLTP) handle interactive responsiveness and structured data well, they fail as "Total Data Volume" approaches 100PB and "Schema Complexity" moves toward unstructured data. Cloudera (BDP) is positioned as the solution for the outer edges of this graph—the high-volume, high-complexity frontier.
Slide 15: The Cloudera Differentiators
The final slide in this set, "Cloudera Differentiators," lists the specific features Cloudera adds to the open-source Hadoop project. These include "Multi-Tenant Support," "Monitoring, Reliability, and Availability," and "Resilience and Fast Recovery." The slide explicitly calls these "non-sexy" problems. This is a brilliant rhetorical move; it acknowledges that while the open-source community likes building 'sexy' new features, enterprises pay for the 'non-sexy' stability that Cloudera provides. It also mentions "Connector certification," ensuring the system is compatible with existing enterprise tools like R, SAS, and SPSS.
What Cloudera Did Well
Macro-Trend Alignment: The deck does an exceptional job of tying the company's success to a hardware reality (the end of Moore's Law for single cores). This makes the rise of distributed computing feel inevitable rather than speculative.
Borrowing Brilliance: By explicitly linking Hadoop to Google's internal tools (MapReduce/GFS), Cloudera bypassed the need to prove the technology worked. If it worked for Google, it would work for everyone else.
Focusing on the 'Boring': Most startups try to sound exciting. Cloudera leaned into being the 'boring' enterprise layer. By focusing on SLAs, recovery, and certification, they spoke the language of the CIO, not just the developer.
What Was Missing
The Business Model: There is no mention of how Cloudera actually makes money. Is it a subscription? Per-node pricing? Professional services? In 2008, the 'Open Core' business model was still being refined, and this deck leaves the monetization strategy to the imagination.
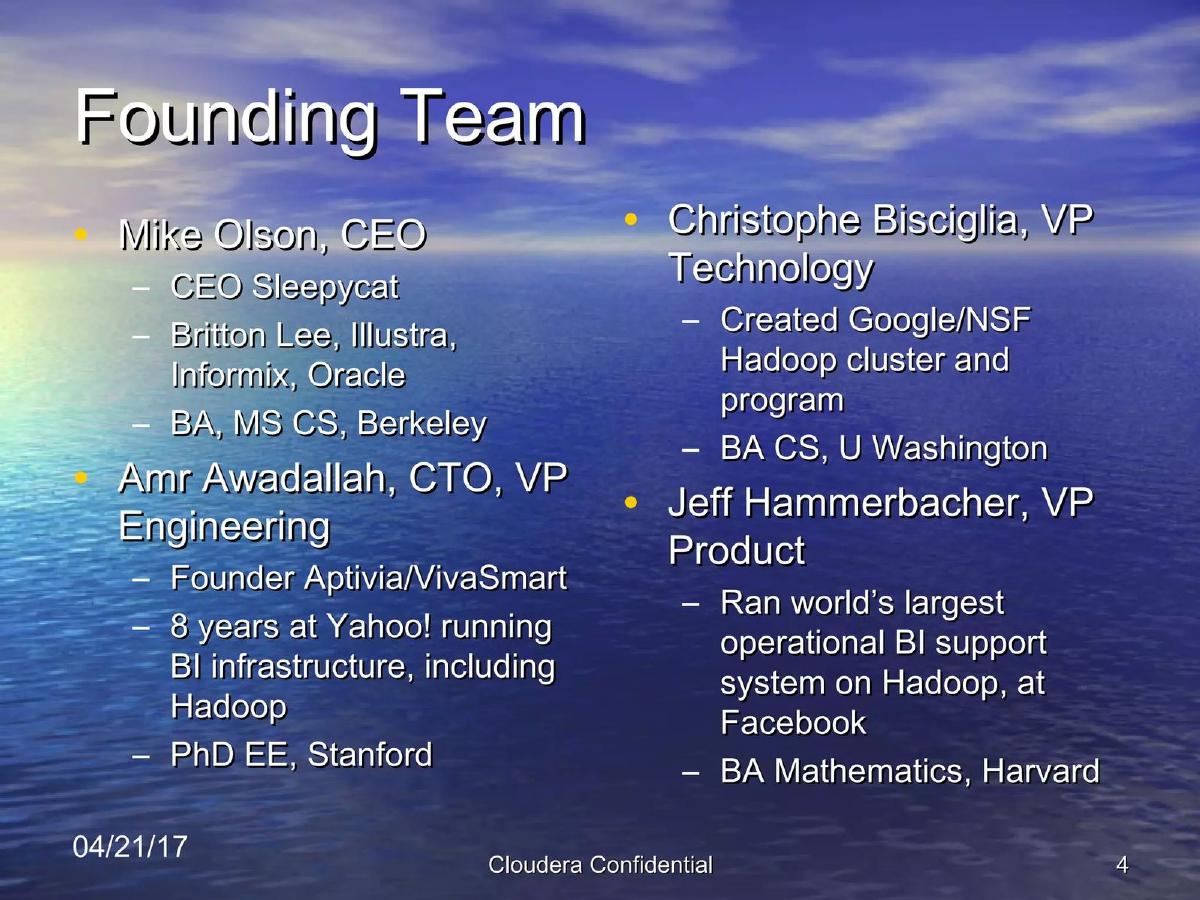
The Team: While advisors are mentioned, the core founding team (Mike Olson, Amr Awadallah, Jeff Hammerbacher, Christophe Bisciglia) is not highlighted in these slides. For a Series A or seed round, the pedigree of the founders is usually a primary selling point.
The Competition: The deck implies that traditional databases are the competition, but it doesn't address other emerging players in the Big Data space or how they will compete with cloud providers (though AWS was in its infancy in 2008).
Founder's Playbook: What to Copy
Use the 'Spider Chart': If your product is better in some ways but worse in others than the incumbent, a spider chart (Slide 13) is the best way to show that you aren't replacing the old system, but rather expanding the market into areas the old system can't reach.
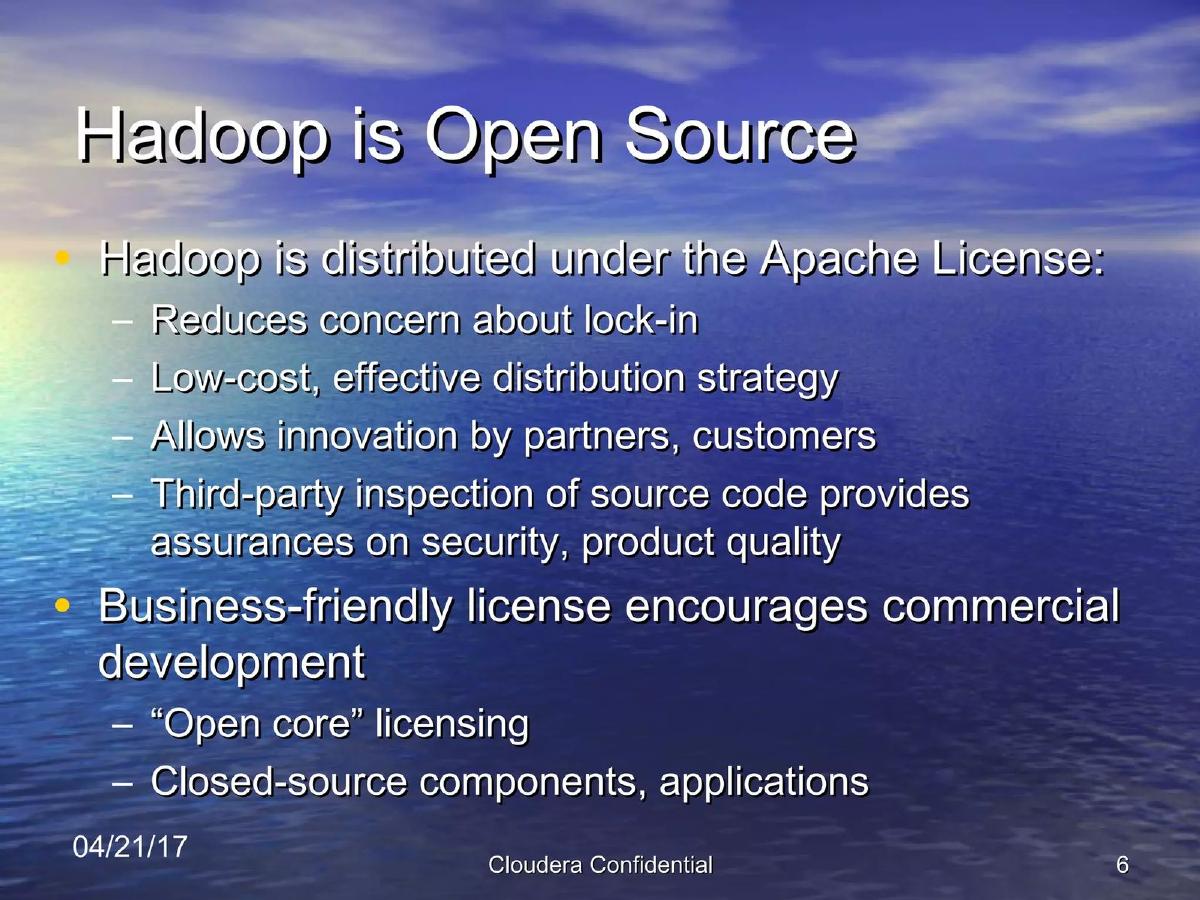
The 'Non-Sexy' Value Prop: If you are building in the developer tools or infrastructure space, don't just pitch features. Pitch the 'non-sexy' enterprise requirements (security, compliance, stability) that the open-source version lacks. That is where the commercial value lies.
Cite External Authority: Using a chart from a respected textbook (Slide 3) or search data from Google (Slide 9) provides objective validation that your market thesis isn't just your opinion—it's a documented fact.
Frequently asked questions
- What is the primary market thesis of the Cloudera deck?
- The thesis is built on hardware limitations. Slide 3 shows that uniprocessor performance growth slowed significantly after 2002. This 'sea change' meant that data processing could no longer rely on faster single chips and instead required distributed systems like Hadoop to handle the massive influx of raw, event-level data that traditional databases (OLAP/OLTP) were not designed to manage efficiently.
- How does Cloudera justify a commercial product for open-source software?
- Cloudera focuses on the 'Enterprise' gap. On Slide 15, they list differentiators that the open-source community often ignores: monitoring, reliability, SLA-backed recovery, and 'connector certification.' By calling these 'non-sexy' problems, they position themselves as the necessary adult in the room who makes experimental open-source tools safe for corporate environments.
- Who were the early adopters of the technology Cloudera was commercializing?
- Slide 7 lists a significant number of high-profile tech and media companies. These include web giants like Google, Facebook, Yahoo!, and eBay, as well as traditional institutions like The New York Times and HP. This demonstrated that the underlying technology (Hadoop) was already mission-critical for the world's most data-intensive organizations.
- What technical comparison does the deck use to highlight its advantage?
- The deck uses a spider chart on Slide 13 to compare Batch Data Processing (BDP) with traditional OLAP/OLTP systems. It shows that while traditional systems excel at responsiveness and read/write patterns, BDP (Hadoop) is required for data volumes exceeding 100TB, unstructured schema complexity, and generic data processing freedom.
- What key fundraising elements are missing from this deck?
- The provided slides lack a Team slide (though Doug Cutting and Mike Cafarella are mentioned as advisors on Slide 5), a Go-to-Market strategy, a Revenue/Business Model slide, and a specific 'Ask' regarding the amount of capital being raised. It functions more as a technical and market validation deck than a full business plan.