Climate Product Slides: 7 Real Pitch Deck Examples
How climate and energy startups present their product: labelled diagrams of how it works, ordering screens with prices, prototype output.
Climate Product Slides: Real Pitch Deck Examples
Seven product slides from climate and energy decks (home geothermal, low-carbon building walls, rain power, factory energy monitoring, heat storage, engine fluid and carbon offsets), shown in full. The strongest ones explain how the physical product works in numbered steps or show the customer ordering it; the weakest describe a lifestyle loop with no product detail.
TL;DR
A climate product slide should explain how the technology works and what one customer gets, with a number where one exists. Dandelion explains home geothermal in three numbered steps on a cut-away house ("Ground loops absorb heat from the 50 degree Fahrenheit earth underground"). Zmasswalls shows its design app and an ordering screen with a price per square foot, a total and a delivery estimate. Rainergy labels its prototype and states its output ("22 watt power and lightens up to 22 LED lamps"). Sensorfact shows data, analysis and action in three boxes, and Kraftblock gives its operating range ("350°C.... 1,300°C"). ThermoNorth states fuel and emissions savings without a source, and Klima shows a three-step offset loop with no price or measure; these are the weaker examples here.
Climate product slides
Each example shows the exact stored slide above its analysis and links to the full teardown. Stronger examples first. Claims and figures are as shown on the slides; we have not verified them.
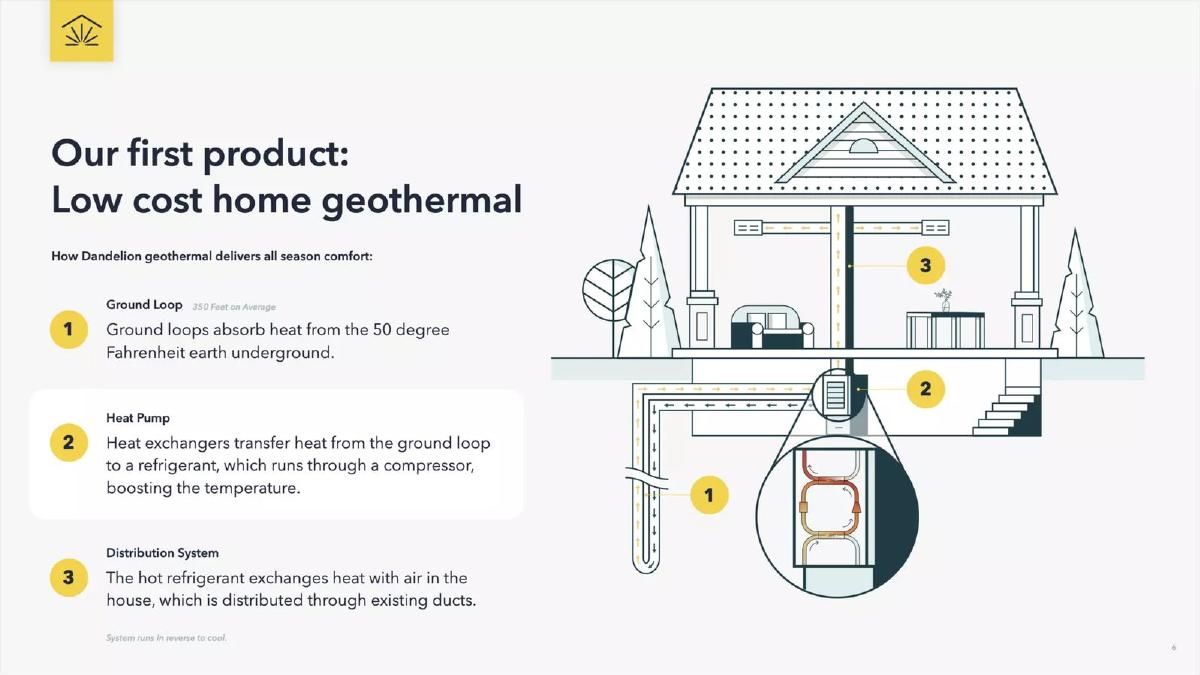
Dandelion Energy product slide — slide 6
Series B. Home geothermal heating and cooling. Numbered cut-away diagram.
Dandelion Energy deck, slide 6. Exact stored slide matched to this analysis.
Our analysis: The clearest climate product slide here: numbered steps match numbers on the drawing, so an investor understands the technology in one read.
Evidence and limitation: How the system works, with two physical figures; no price or savings on this slide.
What a founder can adapt: Number the steps of how your product works and put the same numbers on a simple drawing.
Supporting analysis
What the deck claims: "Our first product: Low cost home geothermal." "How Dandelion geothermal delivers all season comfort:" "1 Ground Loop (350 Feet on Average): Ground loops absorb heat from the 50 degree Fahrenheit earth underground." "2 Heat Pump: Heat exchangers transfer heat from the ground loop to a refrigerant, which runs through a compressor, boosting the temperature." "3 Distribution System: The hot refrigerant exchanges heat with air in the house, which is distributed through existing ducts." "System runs in reverse to cool."
Presentation choice: "Existing ducts" quietly answers an installation question; "350 feet on average" sizes the drilling.
When it does not fit: "Low cost" is claimed but not shown; add the installed price or the saving against the system it replaces.
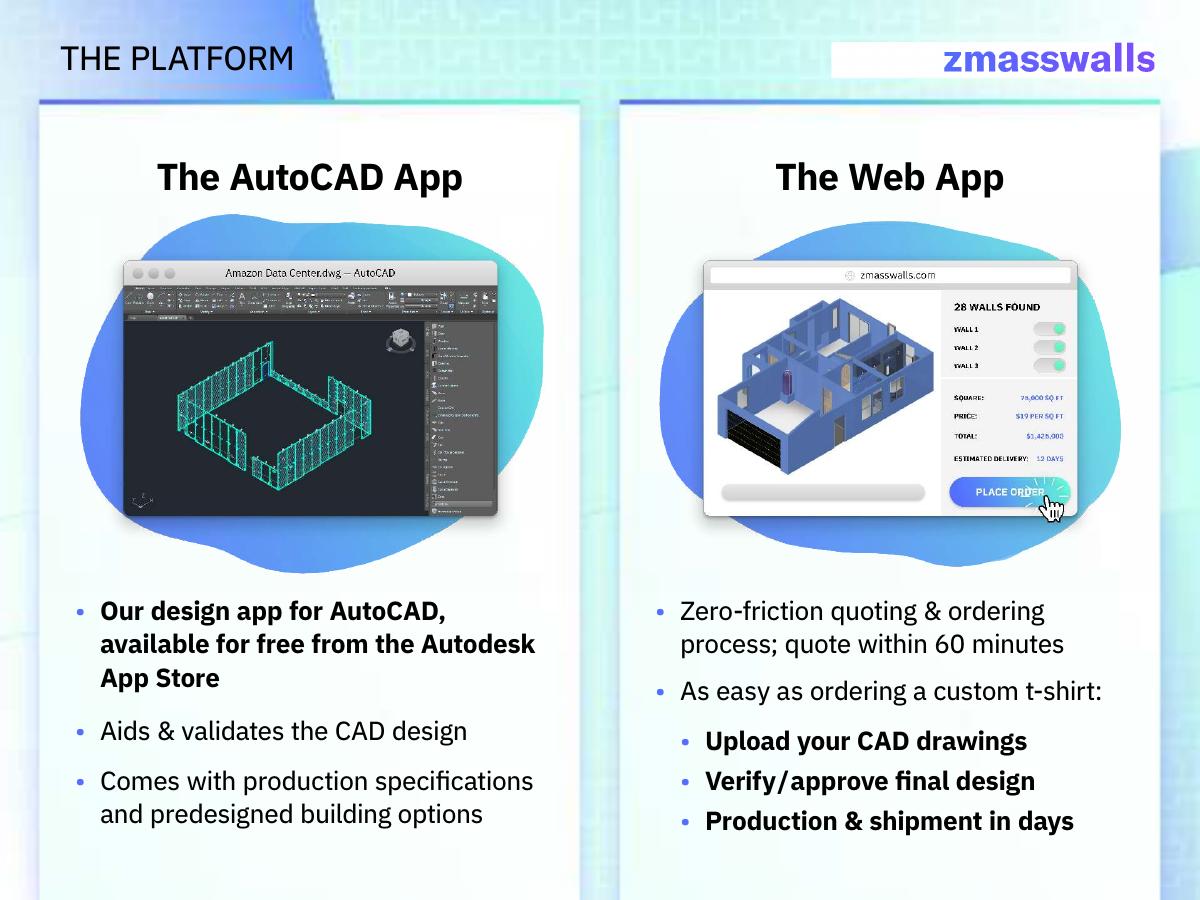
Seed stage. Low-carbon building walls. Design and ordering apps.
Zmasswalls deck, slide 5. Exact stored slide matched to this analysis.
Our analysis: Shows the product as the customer meets it: design in the tool they already use, then a quote and order.
Evidence and limitation: Real screens with a price and delivery estimate; no customer or order count.
What a founder can adapt: Show the screen where your customer gets a quote or places an order, with the price visible.
Supporting analysis
What the deck claims: "The Platform." "The AutoCAD App": "Our design app for AutoCAD, available for free from the Autodesk App Store", "Aids & validates the CAD design", "Comes with production specifications and predesigned building options". "The Web App": "Zero-friction quoting & ordering process; quote within 60 minutes", "As easy as ordering a custom t-shirt: Upload your CAD drawings, Verify/approve final design, Production & shipment in days". The web screen shows "28 Walls Found", "Price: $19 per sq ft", a total and "Estimated Delivery: 12 days".
Presentation choice: A price per square foot and a delivery time on the screen answer cost and speed without a separate slide.
When it does not fit: Say whether the screen shows a real order or a sample; the figures read like a real quote.
Seed stage. Electricity from rainwater. Labelled prototype diagram.
Rainergy deck, slide 5. Exact stored slide matched to this analysis.
Our analysis: Names each part and states what the prototype produces, and is honest that it is a lab prototype.
Evidence and limitation: A lab prototype's output; no field test or cost.
What a founder can adapt: Label the parts and give the output of what you have built, and say where it was tested.
Supporting analysis
What the deck claims: "Product." Labelled parts: "Rain collector", "Water tank", "Pipe", "Generator", "Accumulator, battery". "We have built prototype at the laboratory which is 22 watt power and lightens up to 22 LED lamps. We store energy in accumulator(battery)."
Presentation choice: Stating the stage (lab prototype) and the output lets investors judge how far the product is from market.
When it does not fit: Add the rainfall the 22 W figure assumes and the cost per unit; without them the output can't be compared.
Series B. Energy monitoring for factories. Three-step flow.
Sensorfact deck, slide 4. Exact stored slide matched to this analysis.
Our analysis: Shows that the product is hardware plus advice, and that the customer keeps getting feedback after installation.
Evidence and limitation: Three steps from sensor to advice; no savings figure on this slide.
What a founder can adapt: Show the path from measurement to the action your customer takes, in three boxes.
Supporting analysis
What the deck claims: "Sensorfact makes saving energy in the industry easy." "Data: Plug & play hardware + dashboard. Measure usage data on a machine level + access through our cloud platform." → "Analytics: Data driven savings advice. Identify and quantify savings with algorithms + savings database." → "Action: Recurring feedback on performance. Customized automated tracking reports + smart alerts."
Presentation choice: "Plug & play" and "machine level" answer the installation and detail questions an industrial buyer asks.
When it does not fit: Icons stand in for the product; show the sensor and one dashboard, and add a typical saving.
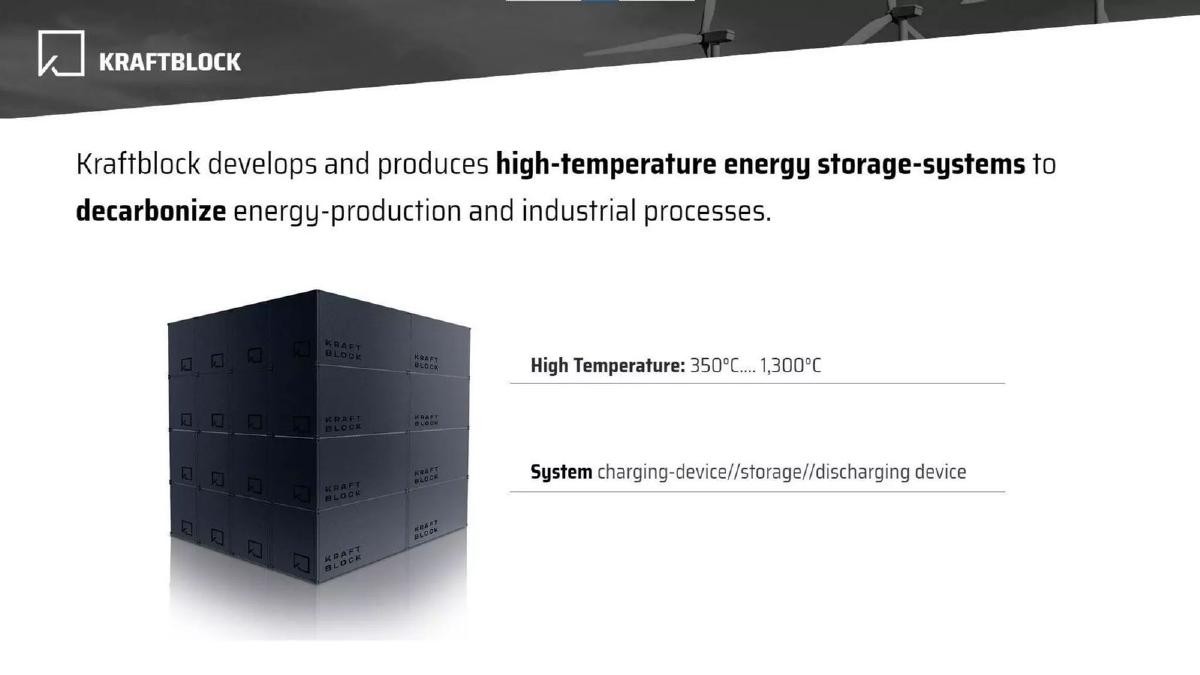
Series A. High-temperature heat storage. Product image with specs.
Kraftblock deck, slide 2. Exact stored slide matched to this analysis.
Our analysis: A single sentence, a product image and two specs; an engineer can place the product quickly.
Evidence and limitation: An operating range and the three parts of the system; no capacity or cost.
What a founder can adapt: Give the one or two specs your buyer uses to judge fit, next to an image of the product.
Supporting analysis
What the deck claims: "Kraftblock develops and produces high-temperature energy storage-systems to decarbonize energy-production and industrial processes." "High Temperature: 350°C.... 1,300°C". "System: charging-device//storage//discharging device". Image of stacked storage blocks.
Presentation choice: The temperature range tells an industrial buyer which processes it can serve.
When it does not fit: Add capacity (for example MWh per unit) and cost per unit stored; temperature alone doesn't size the system.
Engine fluid for cold climates. Chemistry diagram with savings claim.
ThermoNorth deck, slide 6. Exact stored slide matched to this analysis.
Our analysis: Shows what the product is made of and what it claims to do, but the claims are unsupported on the slide.
Evidence and limitation: Savings claims with no source or test conditions.
What a founder can adapt: State a savings figure only with the test behind it (vehicle, temperature, who tested).
Supporting analysis
What the deck claims: "Product." Diagram of ingredients: "Coating", "Emulsifier", "Initiator", "Energy saving Phase Change Material", with chemical structures and a photo of fluid being poured into an engine. "Saves 4% fuel and provides 86% less exhaust gases emissions per year! ThermoNorth keeps engine warm in cold climate!"
Presentation choice: Included for contrast: large emissions claims without a test invite doubt rather than interest.
When it does not fit: Chemical structures mean little to most investors; replace them with a before/after test result.
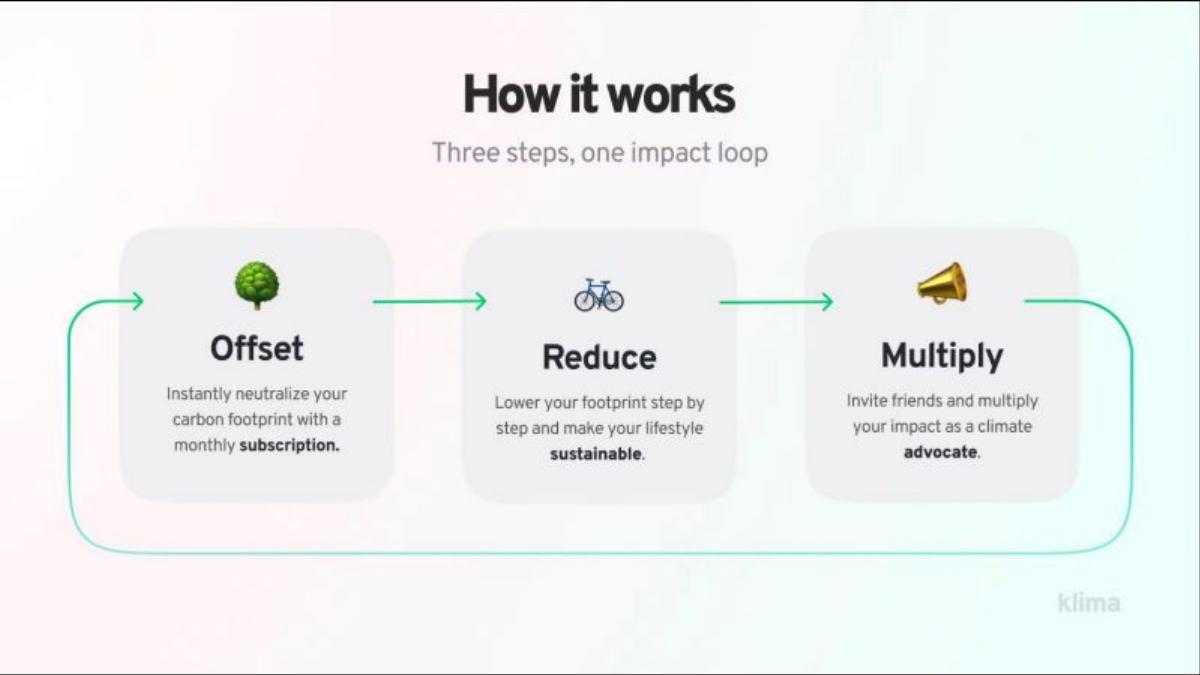
Series A. Consumer carbon offset app. Three-step loop.
Klima deck, slide 5. Exact stored slide matched to this analysis.
Our analysis: A weaker example: it describes what a user does, but not what is bought or what an offset consists of.
Evidence and limitation: User steps only; no price, offset type or measured result.
What a founder can adapt: Add the subscription price, the type of projects funded and one measure of impact per user.
Supporting analysis
What the deck claims: "How it works." "Three steps, one impact loop." "Offset: Instantly neutralize your carbon footprint with a monthly subscription." "Reduce: Lower your footprint step by step and make your lifestyle sustainable." "Multiply: Invite friends and multiply your impact as a climate advocate."
Presentation choice: Included for contrast: for offsets, investors want the price, the projects and how impact is measured.
When it does not fit: Show a real app screen; the slide has only emoji icons.
How the product is presented, whether it is shown as it really is, and which figures are on the slide.
Example
Climate type
Presented as
Real product shown
Figures on slide
Dandelion Energy
Home geothermal
Numbered cut-away diagram
Drawing
350 ft loop, 50°F ground
Zmasswalls
Building walls
Design + ordering screens
Yes (screens)
$/sq ft, quote time, delivery
Rainergy
Rain power
Labelled prototype diagram
Drawing
22 W, 22 LEDs
Sensorfact
Factory energy
Three-step flow
No (icons)
No
Kraftblock
Heat storage
Product image + specs
Yes (image)
350–1,300°C
ThermoNorth
Engine fluid
Chemistry + savings claim
Photo
4% fuel, 86% emissions (unsourced)
Klima
Carbon offsets
Behaviour loop
No
No
Key Takeaways
Explain how the technology works in three or four numbered steps.
Show the customer's view: the order, the quote or the dashboard.
Give one operating figure (output, temperature, price, delivery time).
Say whether figures come from a prototype, a pilot or customers.
Source any savings or emissions claim on the same slide.
Build your climate product slide
Start from how the technology works, then add what one customer gets and one figure.
How it works. Three or four numbered steps, matched to a simple drawing.
Customer's view. What the customer installs, orders or sees.
One figure. Output, operating range, price or delivery time.
Stage and source. Lab, pilot or customer data, and who measured any savings.
Copyable framework: [1 step] → [2 step] → [3 step]. The customer [installs/orders/sees X]. [Figure] measured in [lab/pilot/customer site].
Illustrative example 1 — written by us
Before: Offset: Instantly neutralize your carbon footprint with a monthly subscription.
After: For [price] a month, a subscriber funds [type of project] offsetting [X tonnes] a year, shown in the app each month.
What improved: Our illustrative rewrite; not Klima's wording. Bracketed parts are placeholders to fill with real facts. It adds the price, what is funded and a measured result.
What this guide adds
The library already has a general product slide guide, product slides by stage, and fintech, SaaS, healthcare and edtech product guides, plus climate problem, solution and market guides. This page looks only at climate and energy decks, where the product is often physical and investors want to see how it works, what it produces and how it reaches a customer.
Sector labels come from the sector recorded for each published teardown (high confidence for Dandelion, Kraftblock, ThermoNorth and Klima; medium for Zmasswalls, Rainergy and Sensorfact). None of these seven slides appears in another guide. Dandelion's and Rainergy's decks are also used in the climate market guide, and Klima's in the climate problem guide, each for a different slide.
Four ways climate decks show the product
How-it-works diagram (Dandelion, Rainergy): a labelled drawing of the system with numbered steps or named parts, and for Rainergy, the prototype's output.
Customer's view (Zmasswalls, Sensorfact): the design and ordering screens, or the path from measurement to advice, as the customer experiences it.
Specs and savings (Kraftblock, ThermoNorth): the product with its operating range, or with fuel and emissions claims.
Behaviour loop (Klima): steps a consumer takes, with no product detail. Easy to make, but leaves the investor asking what is sold and what it achieves.
Common mistakes
Savings without a source. Say who measured them and how.
Icons instead of the product. Show the device, the site or the screen.
No stage stated. Say lab, pilot or in use by customers.
"Low cost" without a price. Give the price or the saving.
Specs without size. Add capacity or output alongside ranges.
Diagnostic checklist
Numbered steps of how it works.
A drawing, photo or screen of the real product.
At least one operating figure or price.
Stage of the product stated.
Any savings claim sourced.
Frequently asked questions
How we chose these examples
Corpus: published pitch deck teardowns on StartupFundraising.com. Founder-uploaded private decks are excluded.
Selection (2026-09-26): we took teardowns whose recorded sector is climate (high or medium confidence) and whose slide is classified as a product slide, with a stored image and readable text. We read the candidates, left out slides that were not about the product (backlogs, company overviews, management, market or problem slides filed under this type) and large listed-company decks, and kept seven that show different ways of presenting a climate product. ThermoNorth and Klima are included as weaker examples for contrast.
Sector is the category recorded for each teardown (confidence given in the section above). Stages are shown where recorded with high confidence (Dandelion and Sensorfact, Series B; Kraftblock and Klima, Series A) or medium confidence (Zmasswalls and Rainergy, shown as seed).
Review: stored slide images were checked on 2026-09-26 and matched to company, deck and slide number, and quoted text was read from the images (editorial model review). No person has yet completed an editorial review of this page.
Claims and figures are as shown on the slides; we have not verified them. We make no claim that any slide caused a fundraising outcome.