Product Roadmap Slide Examples: 11 Real Pitch Decks
How startups show a product roadmap in a pitch deck: quarters, launches, targets and funding milestones.
Product Roadmap Slide: Put a Date Next to a Goal Investors Can Check Later
A roadmap slide tells investors what the company will do with their money and when. Most roadmaps in pitch decks are a row of quarters with launches underneath. That shows the team has a plan, but not whether the plan worked. The roadmaps investors remember attach a number to each date: hosts signed, assets handled, monthly users, revenue. Those numbers become the questions at the next board meeting and the next round. This guide compares eleven real roadmap slides, from Fireside's quarter-by-quarter host targets to a roadmap whose quarters run out of order.
TL;DR
Put a date and a measurable goal side by side, and keep the dates in order. Fireside lists host targets for each quarter (50+ in Canada, then 100+) and a goal to convert half its pilots into paid contracts. Koia sets a dollar value of assets for each quarter: more than $200k, then $500k, then $1m. Hangout gives user and revenue ranges for 2025, 2026 and 2027. Touchspin ties its funding rounds to game launches. Canix, Gable and Cometa give dates for launches but no numbers to judge them by. Pixt lists activities with no results, BettorUp's grid is mostly empty, and Hoard's quarters are out of order.
Product roadmap slides from real pitch decks
Each example shows the exact stored slide above its analysis and links to the full teardown. Roadmaps with measurable targets come first; weaker ones follow for contrast. Text is as shown on the slides; comments are ours.
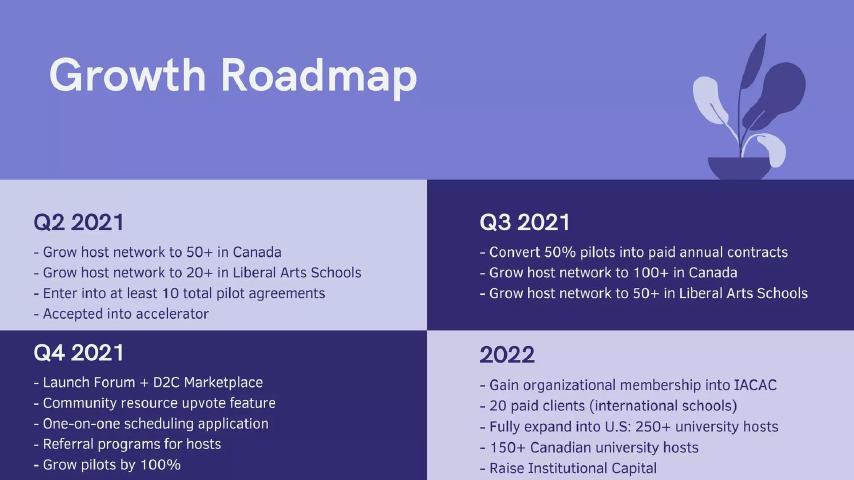
Fireside roadmap slide — slide 9
Early-stage education startup connecting students with university hosts. Slide titled "Growth Roadmap".
Fireside deck, slide 9. Exact stored slide matched to this analysis.
Our analysis: A roadmap where almost every line is a number that can be checked at the end of the quarter.
Evidence and limitation: Company plan. Targets only; no current figures on this slide to measure progress from.
What a founder can adapt: Add the current figure next to the first target, so readers can see how big each step is.
Supporting analysis
What the deck claims: Q2 2021: "Grow host network to 50+ in Canada", "Grow host network to 20+ in Liberal Arts Schools", "Enter into at least 10 total pilot agreements". Q3 2021: "Convert 50% pilots into paid annual contracts", "Grow host network to 100+ in Canada". Q4 2021: "Grow pilots by 100%". 2022: "20 paid clients (international schools)", "Fully expand into U.S: 250+ university hosts", "Raise Institutional Capital".
Presentation choice: Investors can see the growth path in hosts, pilots and paid contracts, and when the next raise is planned. The 50% pilot conversion target shows the team knows which number matters most.
When it does not fit: Mixing outcome targets with feature launches in one list without saying which matter most.
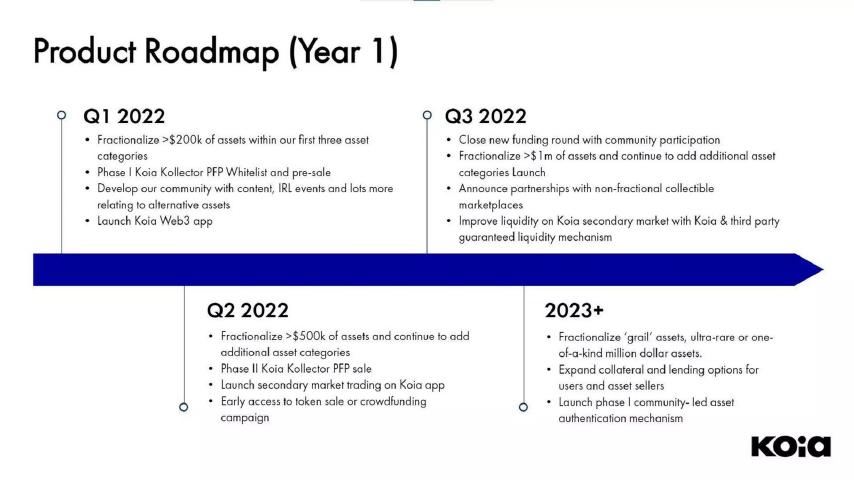
Koia deck, slide 12. Exact stored slide matched to this analysis.
Our analysis: One clear number, the value of assets on the platform, rises every quarter beside the launches that should drive it.
Evidence and limitation: Company plan for its first year.
What a founder can adapt: Choose one measure that shows your platform working, and set a target for it each quarter.
Supporting analysis
What the deck claims: Q1 2022: "Fractionalize >$200k of assets within our first three asset categories", "Launch Koia Web3 app". Q2 2022: "Fractionalize >$500k of assets and continue to add additional asset categories", "Launch secondary market trading on Koia app". Q3 2022: "Close new funding round with community participation", "Fractionalize >$1m of assets". 2023+: "Fractionalize 'grail' assets, ultra-rare or one-of-a-kind million dollar assets."
Presentation choice: A single growth measure across quarters is easy to remember and easy to check. The next funding round sits at the point the plan reaches $1m.
When it does not fit: Ending the plan with an open-ended "2023+" box full of ambitions and no numbers.
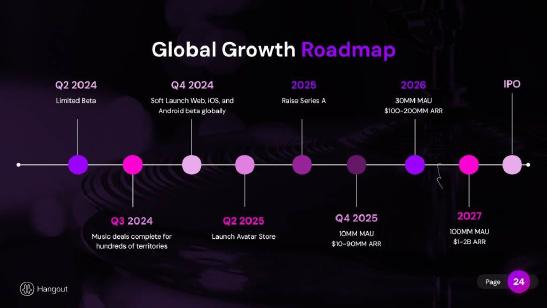
Consumer music and social app. Slide titled "Global Growth Roadmap".
Hangout deck, slide 24. Exact stored slide matched to this analysis.
Our analysis: Launches lead into user and revenue targets, with the Series A and IPO marked on the same line.
Evidence and limitation: Company plan. Revenue targets are given as wide ranges.
What a founder can adapt: Keep the funding points on the roadmap, but narrow the targets so they can be held to.
Supporting analysis
What the deck claims: Q2 2024 "Limited Beta"; Q3 2024 "Music deals complete for hundreds of territories"; Q4 2024 "Soft Launch Web, iOS, and Android beta globally"; 2025 "Raise Series A"; Q2 2025 "Launch Avatar Store"; Q4 2025 "10MM MAU $10-90MM ARR"; 2026 "30MM MAU $100-200MM ARR"; 2027 "100MM MAU $1-2B ARR"; then "IPO".
Presentation choice: It shows the reader where the next round fits and what the company must reach first. Monthly active users (MAU) and annual recurring revenue (ARR) are standard measures.
When it does not fit: Revenue ranges so wide ("$10-90MM") that almost any result would count as on plan.
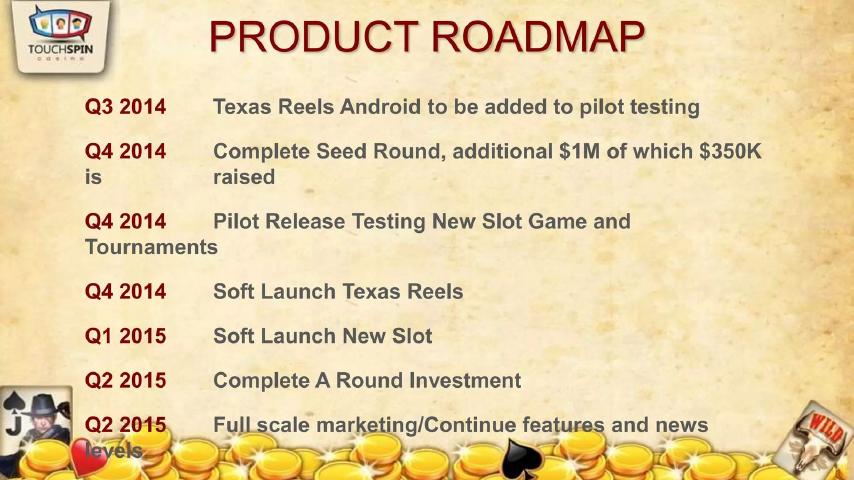
Mobile casino games startup. Slide titled "Product Roadmap".
Touchspin Gaming deck, slide 21. Exact stored slide matched to this analysis.
Our analysis: Funding rounds are placed in the same timeline as the launches they pay for.
Evidence and limitation: Company plan, with progress on the current round stated.
What a founder can adapt: Show your round on the roadmap with what is already committed.
Supporting analysis
What the deck claims: "Q3 2014 Texas Reels Android to be added to pilot testing"; "Q4 2014 Complete Seed Round, additional $1M of which $350K is raised"; "Q4 2014 Pilot Release Testing New Slot Game and Tournaments"; "Q4 2014 Soft Launch Texas Reels"; "Q1 2015 Soft Launch New Slot"; "Q2 2015 Complete A Round Investment".
Presentation choice: Readers see how much of the seed round is committed and what it buys before the Series A.
When it does not fit: Four items in one quarter: the reader will doubt the team can deliver them all.
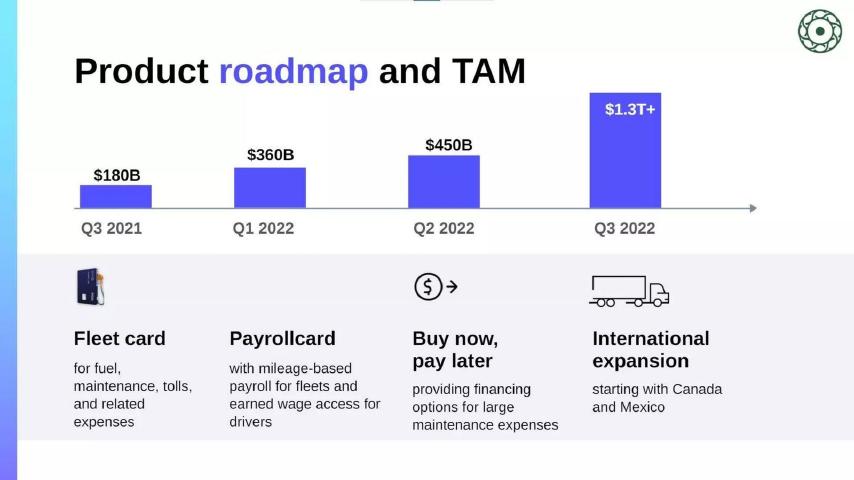
Payments company for trucking fleets. Slide titled "Product roadmap and TAM".
AtoB deck, slide 20. Exact stored slide matched to this analysis.
Our analysis: Each launch is tied to the size of market it opens.
Evidence and limitation: Company estimates of total addressable market (TAM); sources are not shown on this slide.
What a founder can adapt: If your roadmap expands your market, show how much each step adds and where the figures come from.
Supporting analysis
What the deck claims: Bars rising from "$180B" (Q3 2021) to "$360B" (Q1 2022), "$450B" (Q2 2022) and "$1.3T+" (Q3 2022), above four products: "Fleet card", "Payrollcard", "Buy now, pay later" and "International expansion starting with Canada and Mexico".
Presentation choice: It explains why the order of launches matters: each step widens the market the company can sell into.
When it does not fit: Market size in place of the company's own targets: it says what is possible, not what you will win.
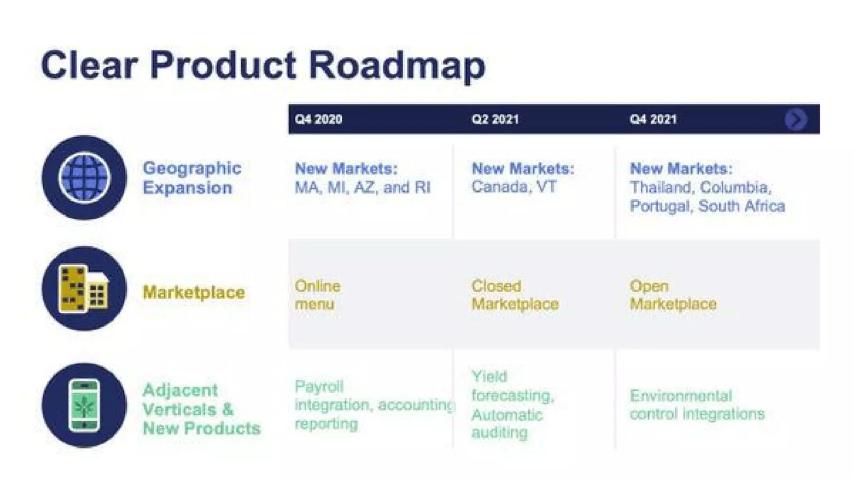
Software for cannabis growers. Slide titled "Clear Product Roadmap".
Canix deck, slide 9. Exact stored slide matched to this analysis.
Our analysis: A tidy grid of three tracks, each moving forward each period, without any targets.
Evidence and limitation: Company plan.
What a founder can adapt: Keep the grid, and add one row for the number each track should move.
Supporting analysis
What the deck claims: Three tracks across Q4 2020, Q2 2021 and Q4 2021. "Geographic Expansion": "New Markets: MA, MI, AZ, and RI", then "Canada, VT", then "Thailand, Columbia, Portugal, South Africa". "Marketplace": "Online menu", "Closed Marketplace", "Open Marketplace". "Adjacent Verticals & New Products": "Payroll integration, accounting reporting", "Yield forecasting, Automatic auditing", "Environmental control integrations".
Presentation choice: Grouping work into a few tracks is easy to read and shows how the pieces fit together.
When it does not fit: A roadmap of launches only, with no way to tell later whether they worked.
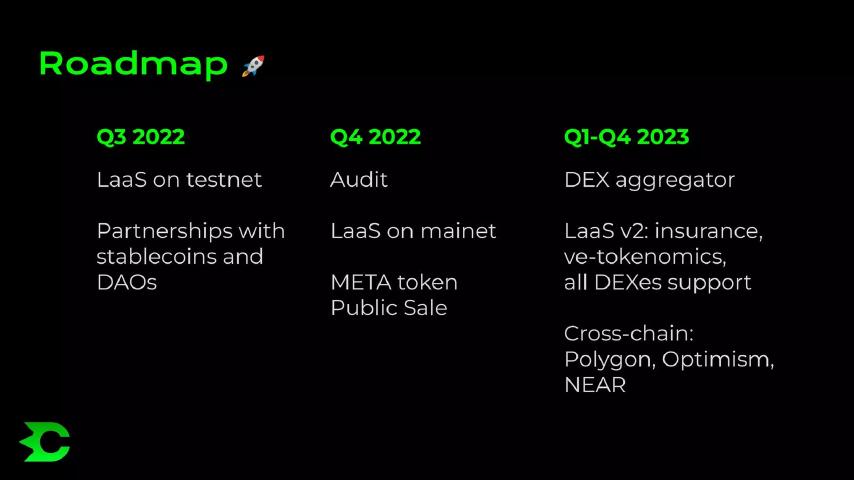
Cometa deck, slide 14. Exact stored slide matched to this analysis.
Our analysis: Clear launch stages (test version, security audit, live version), with a whole year as the last period.
Evidence and limitation: Company plan.
What a founder can adapt: Add usage targets after launch, not just more launches.
Supporting analysis
What the deck claims: Q3 2022: "LaaS on testnet", "Partnerships with stablecoins and DAOs". Q4 2022: "Audit", "LaaS on mainet", "META token Public Sale". Q1-Q4 2023: "DEX aggregator", "LaaS v2: insurance, ve-tokenomics, all DEXes support", "Cross-chain: Polygon, Optimism, NEAR".
Presentation choice: Putting the audit before the live launch shows the team plans for security review.
When it does not fit: A final period covering a whole year: it signals the plan has not been thought through that far.
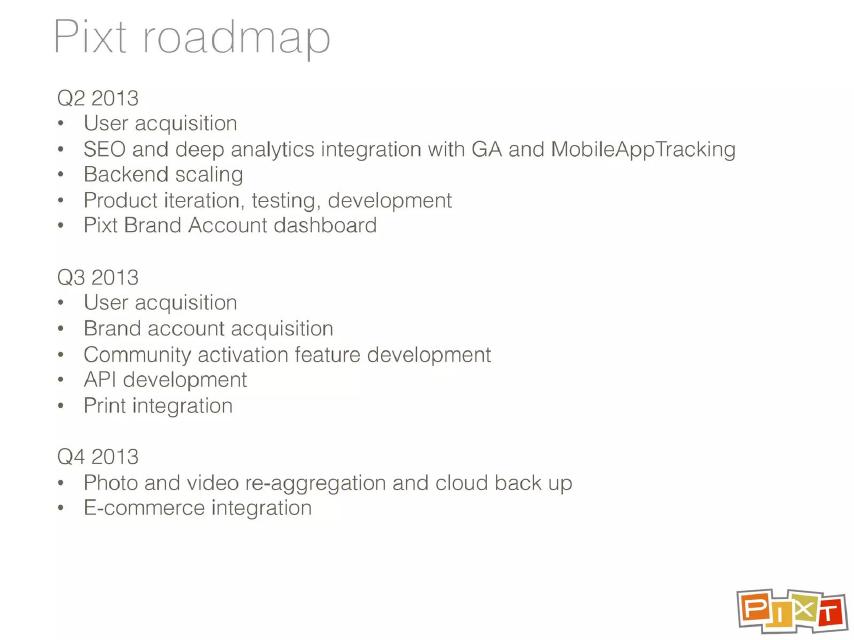
Pixt deck, slide 8. Exact stored slide matched to this analysis.
Our analysis: A task list by quarter. "User acquisition" appears twice with no target.
Evidence and limitation: Company plan.
What a founder can adapt: Turn each repeated activity into a target: "User acquisition" becomes a number of users by the end of the quarter.
Supporting analysis
What the deck claims: Q2 2013: "User acquisition", "SEO and deep analytics integration with GA and MobileAppTracking", "Backend scaling". Q3 2013: "User acquisition", "Brand account acquisition", "API development", "Print integration". Q4 2013: "Photo and video re-aggregation and cloud back up", "E-commerce integration".
Presentation choice: Shown for contrast. Readers learn what the team will work on, but not how many users or brand accounts it expects.
When it does not fit: Listing the same activity in several quarters without saying what it should achieve.
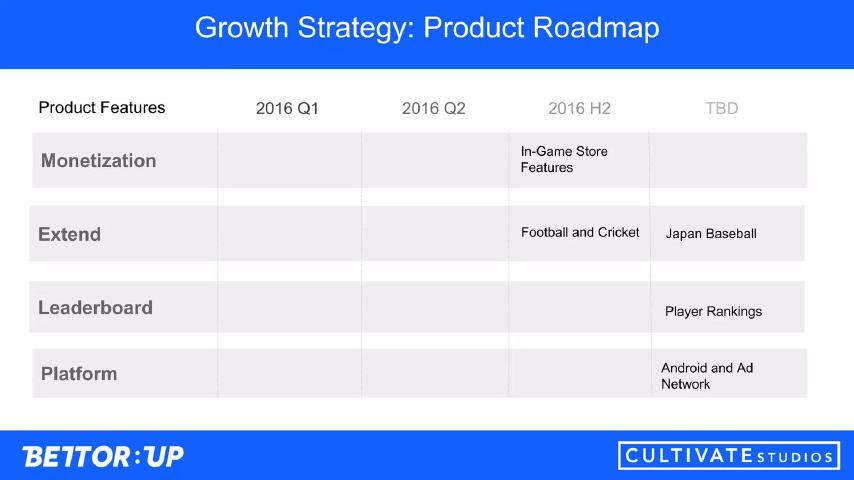
BettorUp deck, slide 20. Exact stored slide matched to this analysis.
Our analysis: Most cells are empty, and several items sit in a "TBD" column.
Evidence and limitation: Company plan.
What a founder can adapt: If you only have a few items, use a simple list instead of a grid.
Supporting analysis
What the deck claims: A grid of "Monetization", "Extend", "Leaderboard" and "Platform" against "2016 Q1", "2016 Q2", "2016 H2" and "TBD". Filled cells: "In-Game Store Features", "Football and Cricket", "Japan Baseball", "Player Rankings", "Android and Ad Network".
Presentation choice: Shown as a warning. A mostly blank grid suggests the plan is thinner than the layout implies.
When it does not fit: A "TBD" column: it tells investors the item has no date.
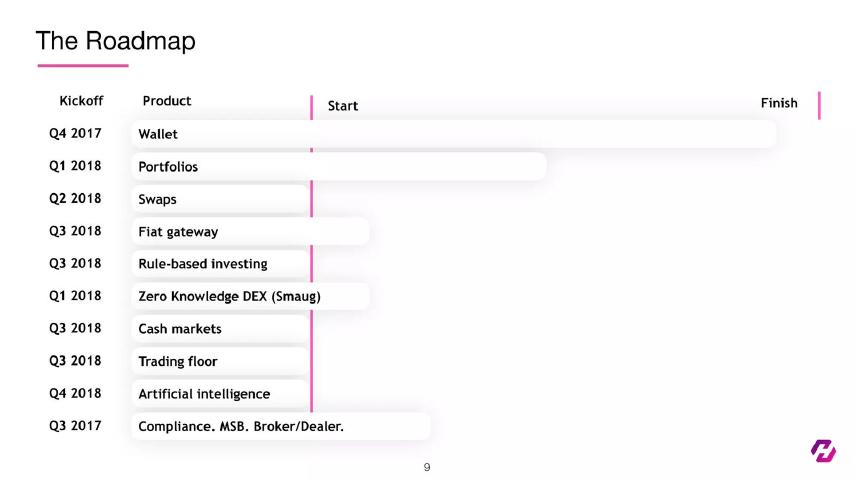
Hoard deck, slide 9. Exact stored slide matched to this analysis.
Our analysis: Ten products, with dates out of order and five starting in Q3 2018.
Evidence and limitation: Company plan.
What a founder can adapt: Sort by date, and cut the list to what this round will pay for.
Supporting analysis
What the deck claims: Kickoff dates beside products: "Q4 2017 Wallet", "Q1 2018 Portfolios", "Q2 2018 Swaps", "Q3 2018 Fiat gateway", "Q3 2018 Rule-based investing", "Q1 2018 Zero Knowledge DEX (Smaug)", "Q3 2018 Cash markets", "Q3 2018 Trading floor", "Q4 2018 Artificial intelligence", "Q3 2017 Compliance. MSB. Broker/Dealer." Bars run between "Start" and "Finish".
Presentation choice: Shown as a warning. The out-of-order dates make readers work to follow the plan, and the number of launches looks hard to deliver.
When it does not fit: Listing the earliest item last, and crowding many launches into one quarter.
Whether each slide uses ordered dates, gives measurable targets, and links the plan to funding.
Example
Ordered dates
Measurable targets
Funding on roadmap
Fireside
Yes
Yes (hosts, pilots, clients)
Yes (2022)
Koia
Yes
Yes (asset value)
Yes (Q3 2022)
Hangout
Yes
Partly (wide ranges)
Yes (Series A, IPO)
Touchspin Gaming
Yes
No
Yes (seed, Series A)
AtoB
Yes
Market size only
No
Canix
Yes
No
No
Gable
Yes
No
No
Cometa
Yes
No
Token sale only
Pixt
Yes
No
No
BettorUp
Partly (TBD column)
No
No
Hoard
No
No
No
Key Takeaways
Use calendar quarters, in order.
Give at least one measurable target per period.
Show where the round ends and the next one starts.
Group work into a few tracks, not a long feature list.
Keep the near term detailed and the far term short.
Build your roadmap slide
Start from what this round must achieve, then work back to the quarters.
End point. What must be true when this round's money runs out?
Measure. Which one or two numbers show the plan is working?
Quarters. What target does each quarter need to hit to get there?
Launches. Which launches drive each target? Cut the rest.
Funding. Where does the next round fit?
Copyable framework: [Quarter]: launch [product], reach [number] [measure]. [Quarter]: [number] [measure]. By [quarter], [end-point target], ready to raise [next round].
Illustrative example 1 — written by us
Before: Q3: User acquisition, API development. Q4: E-commerce integration.
After: Q3 2027: launch API; reach 20,000 monthly users. Q4 2027: launch shop; 40,000 users, first $10k monthly sales. Q2 2028: 100,000 users, ready to raise Series A.
What improved: Our illustrative rewrite; all figures are invented for the example. Each launch is tied to a target, and the next round is placed on the timeline.
What this guide adds
The biotech pipeline guide covers drug development stages, and the milestones guide covers what a company has already done. This guide covers the forward plan for products and growth: what will launch, by when, and how investors will know whether it worked. We look at how each slide states its dates, what it promises, and whether the promise can be checked.
How we read each slide
We read each stored slide image and quote the text on it. These are plans made at the time of each deck; we have not checked whether any company hit its targets. Where text on a slide is small, we quote only what we could read clearly.
Activities versus outcomes
An activity is something the team will do: launch an app, build an integration, run a campaign. An outcome is a result that can be counted: hosts signed, assets handled, users, revenue. Most roadmaps list activities. The stronger slides here put at least one outcome next to each date, so a reader can come back in six months and check.
Outcomes do not have to be revenue. Fireside counts university hosts and pilot conversions; Koia counts the value of assets on its platform. Pick the number that shows the plan is working at your stage.
What investors check
Does the roadmap match the raise? Investors look for where this round's money runs out and what the company will have by then. Touchspin and Hangout mark funding rounds on the roadmap itself; most slides leave the reader to guess.
Is the near term believable? A plan with many launches in the next two quarters suggests a team that has not yet felt how long things take. Detail near, fewer items far is usually more credible.
Are the dates consistent? A roadmap whose quarters run out of order, or that starts in the past, makes readers wonder how carefully the rest of the deck was put together.
Common mistakes on roadmap slides
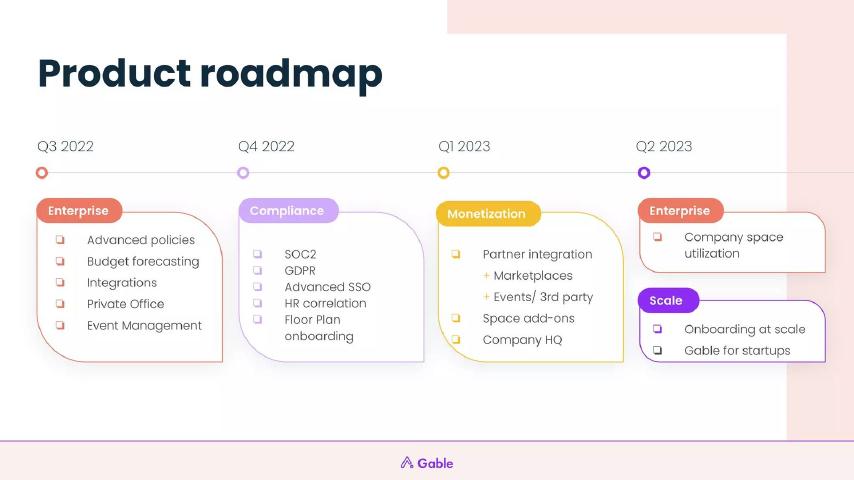
The most common is a list of features with dates and nothing to measure. Gable, Canix, Cometa and Pixt each show launches without saying what success looks like.
The second is a slide too crowded or too empty to read. BettorUp's grid has most cells blank and a column labelled "TBD"; two other roadmaps we considered were too small to read at all.
The third is order. Hoard lists Q3 2017 at the bottom of a list that otherwise runs from Q4 2017 to Q4 2018, with Q1 2018 appearing twice.
Common mistakes
Activities without outcomes. Pixt lists "User acquisition" twice with no target.
Out-of-order dates. Hoard lists Q3 2017 last.
Empty grid. BettorUp's grid is mostly blank, with a "TBD" column.
Too much near term. Five launches in one quarter look hard to deliver.
Ranges too wide. A target of "$10-90MM" can hardly be missed.
No link to the round. Show where this round's money runs out.
Diagnostic checklist
Uses calendar quarters, in order.
Gives at least one measurable target per period.
Marks where the next round fits.
Groups work into a few tracks or themes.
Keeps the near term realistic.
Has no empty cells or TBD columns.
Frequently asked questions
What should a product roadmap slide in a pitch deck show?
Calendar quarters in order, the main launches, a measurable target for each period, and where the next round fits. Fireside and Koia set a number for each quarter.
How far ahead should a pitch deck roadmap go?
Usually until this round's money runs out, with less detail further out. Koia shows four quarters in detail and one short "2023+" box.
Should a roadmap include revenue targets?
Include the number that best shows the plan is working at your stage. Hangout uses users and revenue; Fireside uses hosts and paid contracts; Koia uses asset value.
What mistakes do investors spot on roadmap slides?
Feature lists without outcomes, dates out of order, empty grids and too many launches in one quarter. Hoard's quarters run out of order; BettorUp's grid is mostly blank.
How we chose these examples
Corpus: published pitch deck teardowns on StartupFundraising.com. Founder-uploaded private decks are excluded.
Selection (2026-10-01): we searched extracted slide text across the full corpus for slides whose title contains "roadmap" followed by a dated quarter. 14 matched; 13 were not used in any other guide. We viewed all 13 and kept 11 from 11 companies.
Not used: Noqx p11 and Opentest (Loom) p10, whose text is too small to read in the stored images.
Review: stored slide images were read on 2026-10-01 against company, deck and slide number (editorial model review). No person has yet completed an editorial review of this page. We did not check whether any company met its roadmap, and we make no claim that any slide caused a fundraising outcome.