Nazar, a Brazilian database performance startup, raised $442,500 in 2014 using a remarkably lean 11-slide deck. The presentation relies heavily on visual metaphors—using a 'Nazar' (evil eye) logo to symbolize oversight and a news headline to illustrate the cost of downtime. While the deck lacks traditional venture capital staples such as a TAM/SAM/SOM analysis, a competitive landscape, and a specific funding request, it compensates with clear product screenshots and a revenue chart showing growth from approximately $25,000 in Q3 2016 to nearly $40,000 in Q1 2017. The team slide emphasizes 40+…
Key takeaways
- The deck uses a news headline about Best Buy's Black Friday downtime to create immediate emotional stakes for a technical problem (Slide 3).
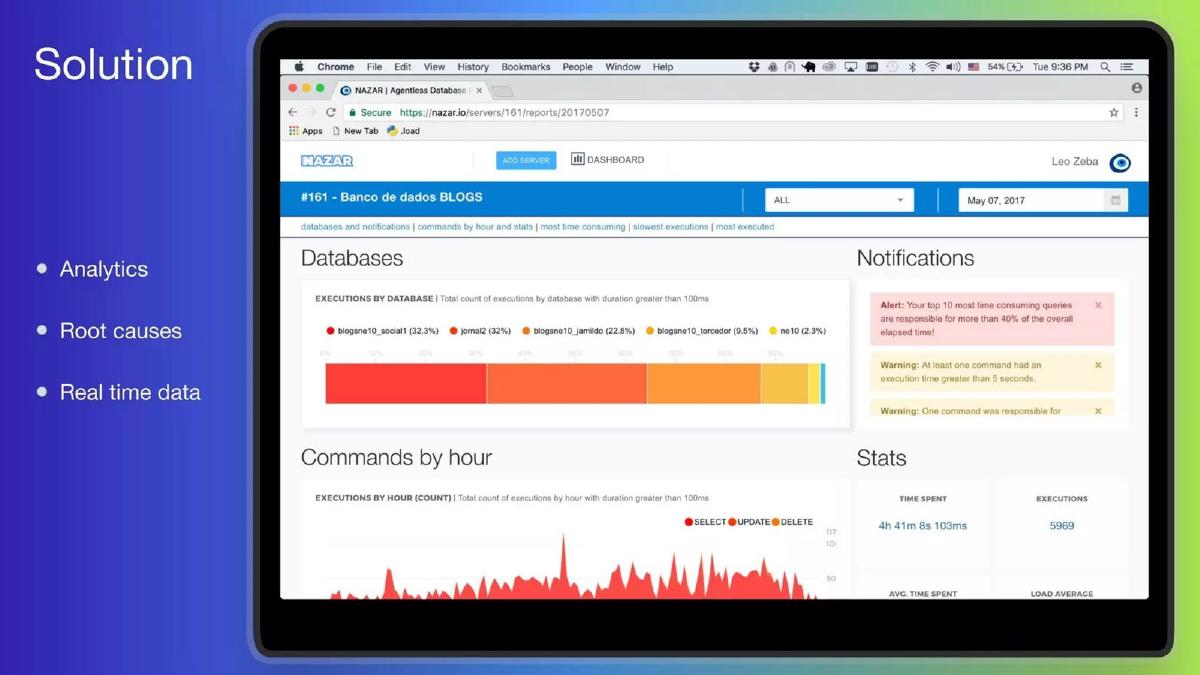
- Product value is distilled into three core pillars: Analytics, Root causes, and Real-time data (Slide 5).
- The startup demonstrates social proof by listing logos from over 30 businesses, including Pipefy and Sprinklr (Slide 7).
- Revenue growth is shown as a steady upward trend, moving from $25,000 to nearly $40,000 over three quarters (Slide 8).
- The team slide aggregates experience to a single impressive figure: '40+ years of Experience' (Slide 9).
- A high-impact metric of '3.5 Billion SLOW QUERIES' is used as a closing proof of scale (Slide 10).
- There is a total absence of a financial 'Ask' slide, leaving investors without a specific target amount or use of funds within the deck.
- Market size and competitive analysis are entirely omitted, assuming the investor already understands the database monitoring category.
Introduction: The Power of Visual Simplicity
Nazar’s 11-slide pitch deck is a departure from the text-heavy, data-dense presentations often seen in the enterprise infrastructure space. Founded in 2014, the Brazilian company focuses on database performance monitoring. Their deck relies on high-contrast visuals and minimal text to guide the viewer through a narrative of problem, solution, and traction. While it ignores several 'standard' slides, its focus on revenue and existing customers makes a compelling case for a pre-seed investment.
The Hook and the Problem (Slides 1-4)
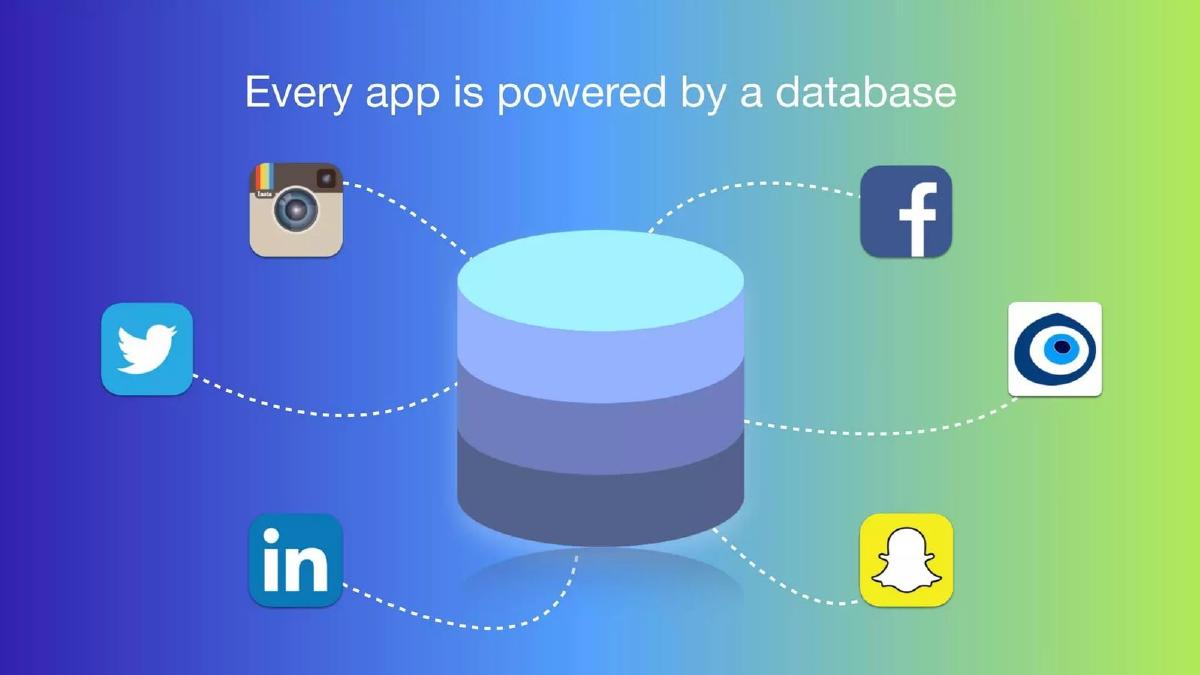
Slide 1 introduces the brand with the Nazar eye logo and the tagline: 'DATABASE PERFORMANCE Made EASY.' It is a clean, professional start that immediately identifies the niche. Slide 2 uses a simple diagram to establish the ubiquity of the problem: 'Every app is powered by a database,' showing icons for Instagram, Facebook, Twitter, LinkedIn, and Snapchat connected to a central database cylinder. This sets the stage for a horizontal market opportunity.
Slide 3 shifts from the theoretical to the visceral. It features a news clipping: 'Best Buy's website goes down on Black Friday' with a large red banner screaming 'DOWNTIME!' This is an effective use of a 'hair on fire' problem. It moves the conversation from technical maintenance to business-critical revenue loss. Slide 4 defines the specific pain point for engineers. Against a backdrop of dense, unreadable SQL code, the text reads: 'Hard to identify the causes.' This perfectly captures the frustration of debugging complex systems under pressure.
The Solution and Product (Slides 5-6)
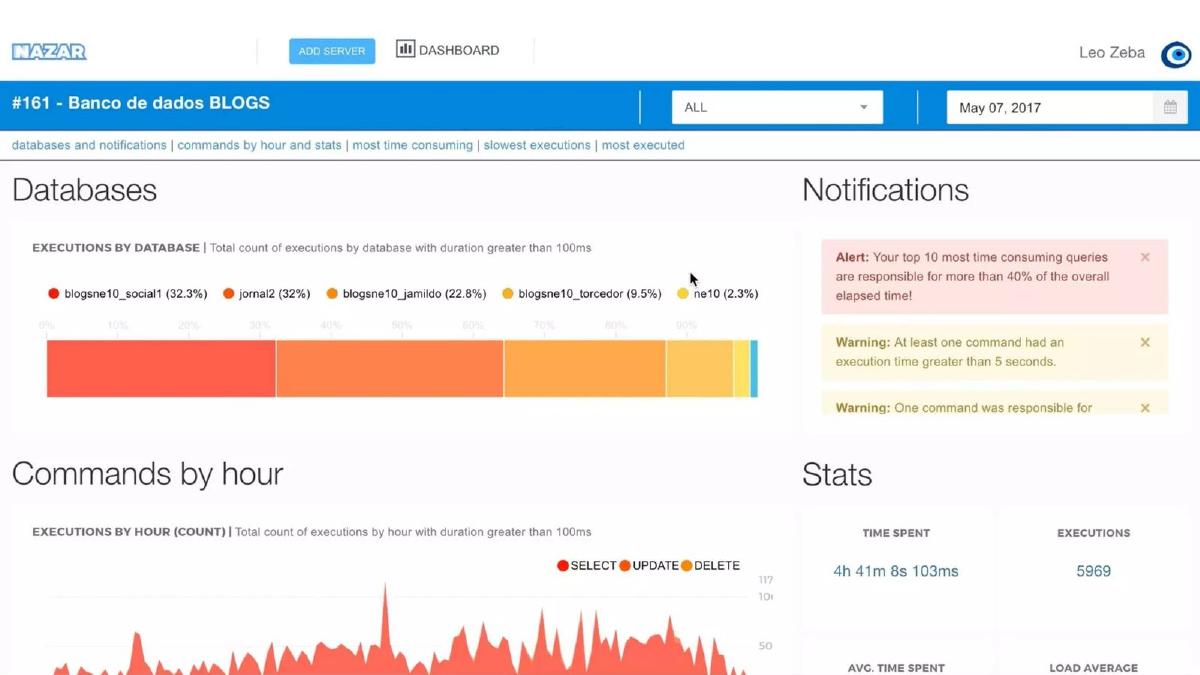
Slide 5 introduces the Nazar platform. It lists three value propositions: Analytics, Root causes, and Real-time data. The slide features a screenshot of the dashboard inside a laptop frame, showing a 'Banco de dados BLOGS' (Database BLOGS) with a breakdown of executions by duration. Slide 6 provides a full-screen view of the same dashboard. We see specific alerts like 'Your top 10 most time consuming queries are responsible for more than 40% of the overall elapsed time!' This proves the product isn't just a monitor, but an actionable diagnostic tool.
Traction and Social Proof (Slides 7-8)
Slide 7 is a classic 'Logo Slide.' It features six prominent logos, including Pipefy and Sprinklr, and a blue badge stating '+30 Businesses.' For a pre-seed company in 2014, having over 30 business customers is a significant signal of product-market fit. Slide 8 backs this up with a revenue chart. The bar graph shows quarterly growth: approximately $25,000 in Q3 2016, $30,000 in Q4 2016, and nearly $40,000 in Q1 2017. The dotted trend line emphasizes the upward trajectory. Note that the revenue figures are relatively small, but the growth is consistent.
The Team and Scale (Slides 9-11)
Slide 9 introduces the founders: Antônio Inocêncio (CEO), Leonardo Santos (CTO), and Matheus Mendonça (CPO). Rather than listing individual resumes, they aggregate their credibility: '40+ years of Experience in Software Engineering, Database Performance and Sales.' This is a smart way to project authority in a technical field. Slide 10 is a 'wow' slide, featuring a colorful, abstract heat map of data with the text '3.5 Billion SLOW QUERIES.' It’s a scale metric designed to show that their engine can handle massive data volumes. Slide 11 is the contact slide, providing the website (nazar.io), an AngelList link, and an email address.
What Works in the Nazar Deck
Visual Storytelling: The transition from the Best Buy downtime (Slide 3) to the 'Hard to identify' code (Slide 4) creates a clear narrative arc. It identifies a massive business risk and then shows the technical bottleneck preventing its resolution.
Actionable Product Shots: Instead of showing a generic landing page, Nazar shows a dashboard with specific, red-flag alerts (Slide 6). This allows an investor to see exactly how a customer would use the tool to save time and money.
Aggregated Experience: By totaling their years of experience to '40+ years' (Slide 9), the founders make themselves look like industry veterans. This is particularly effective for a technical product where 'grey hair' (or at least deep experience) is a trust signal for enterprise buyers.
What is Missing from the Nazar Deck
The Ask: There is no slide detailing how much money they are raising, the valuation, or what they intend to do with the funds. This suggests the deck may have been used as a visual aid for a pitch rather than a standalone document sent to VCs.
Market Sizing (TAM): There is no mention of how big the database monitoring market is. While Slide 2 hints at a large market by showing social media giants, investors usually want to see a bottom-up calculation of the total addressable market.
Competition: The deck operates in a vacuum. In 2014, companies like New Relic and AppDynamics were already established. Nazar fails to explain why their 'Agentless' approach (hinted at in the browser tab on Slide 5) is superior to existing incumbents.
Business Model: We see revenue, but we don't know how they make it. Is it a monthly subscription? A per-server fee? A percentage of data processed? The lack of unit economics is a notable gap.
What a Founder Should Copy
The 'Problem' Slide: Use a real-world news event to ground your problem. If you are solving a security issue, show a hack. If you are solving a logistics issue, show a supply chain collapse. It makes the problem feel urgent and expensive.
Minimalist Text: Notice that almost no slide has more than 10 words. This forces the audience to listen to the presenter (if live) or focus on the data/visuals (if sent). It prevents the 'reading the slide' trap.
The Scale Metric: Even if you don't have millions in revenue, find a 'big number' that represents the work your system has done. '3.5 Billion Queries' (Slide 10) sounds impressive and suggests a level of technical maturity that a simple revenue number might not convey.
Final Thoughts
Nazar’s deck is a high-signal, low-noise presentation. It successfully bridges the gap between a highly technical product and the business value it provides. While it leaves many questions unanswered—specifically regarding the competitive landscape and the financial ask—it provides enough traction and social proof to earn a second meeting. For early-stage founders, the lesson here is clear: show the product, show the growth, and let the results speak louder than the bullet points.
Frequently asked questions
- How much did Nazar raise with this deck?
- According to catalogue data from pitchdeckhunt.com, Nazar raised $442,500. The deck itself does not state the amount raised or the terms of the round, which is a common omission in decks used for verbal presentations or those shared after an initial meeting.
- What is the core problem Nazar solves?
- Nazar addresses the difficulty of identifying the causes of database downtime and performance lag. Slide 4 uses a background of complex SQL code with the overlay 'Hard to identify the causes' to illustrate the 'needle in a haystack' problem that developers face during outages.
- Who are Nazar's customers?
- Slide 7 highlights several notable customers, including Pipefy, VivaReal, Sprinklr, Mandic, Dedalus, and Cuponeria. The slide also notes they have 'plus 30 Businesses' as clients, indicating a solid B2B foundation for a pre-seed stage company.
- Is there a business model or pricing slide?
- No. The deck completely omits a business model slide. While Slide 8 shows revenue growth, it does not explain the pricing tiers, average contract value, or whether the revenue is recurring (SaaS) or service-based.
- What is the significance of the 3.5 billion queries on Slide 10?
- This slide serves as a 'big number' proof point. It suggests that Nazar's system has already processed or identified 3.5 billion slow queries. This demonstrates the technical robustness of their platform and the sheer scale of the problem they are tackling.