Narrative's 12-slide Series A deck is a study in structural clarity, focusing heavily on the friction of existing data acquisition workflows. By quantifying the manual process as a six-month ordeal (Slide 3) and contrasting it with their automated marketplace, they build a compelling case for a 'Data Operating System.' The deck successfully anchors its value proposition in four pillars: Data Fidelity, Autonomy, Liquidity, and Transparency (Slide 5). However, the presentation is notable for what it lacks: there is no team slide, no specific 'ask' or use-of-funds breakdown, and no detailed unit…
Key takeaways
- The global data monetization market is projected to reach $700 billion by 2025 (Slide 1).
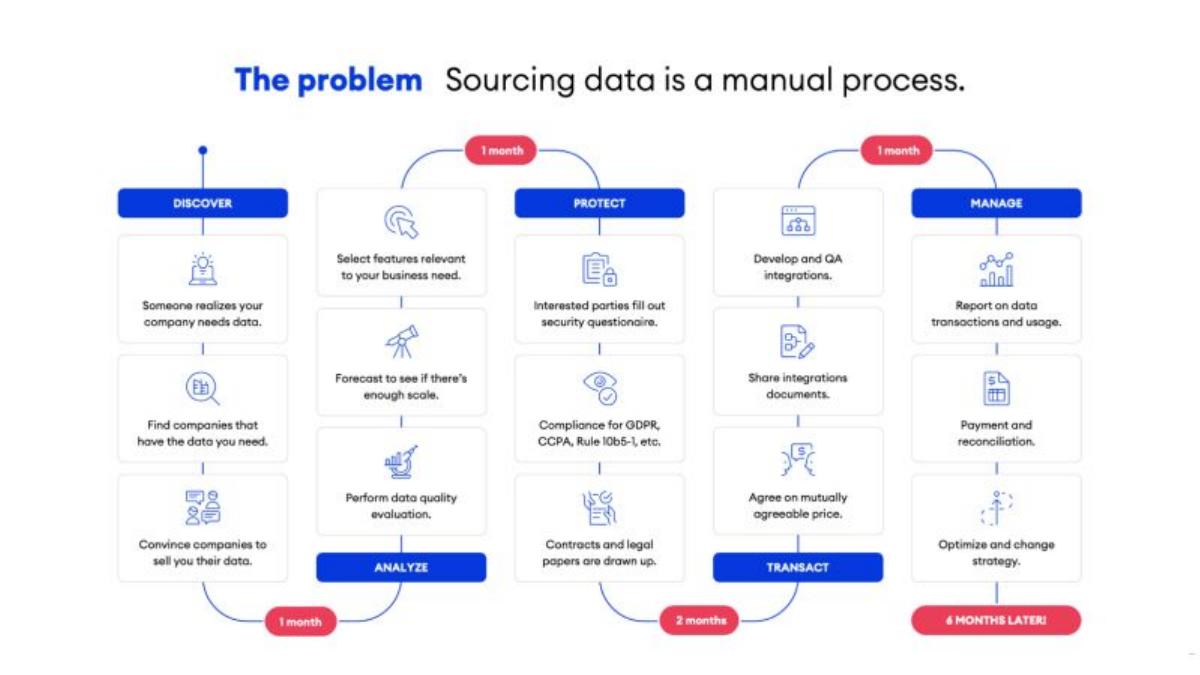
- Manual data sourcing is depicted as a grueling six-month process involving discovery, analysis, protection, transaction, and management (Slide 3).
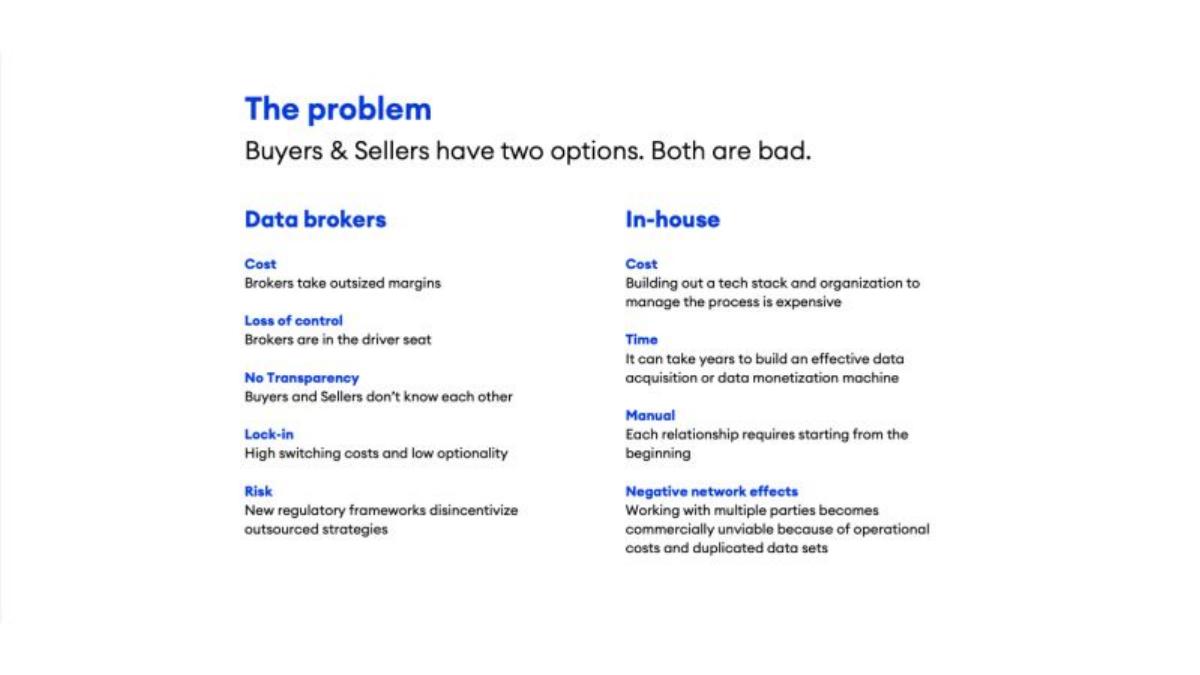
- The company identifies two 'bad' current options: high-margin data brokers or expensive, slow in-house builds (Slide 2).
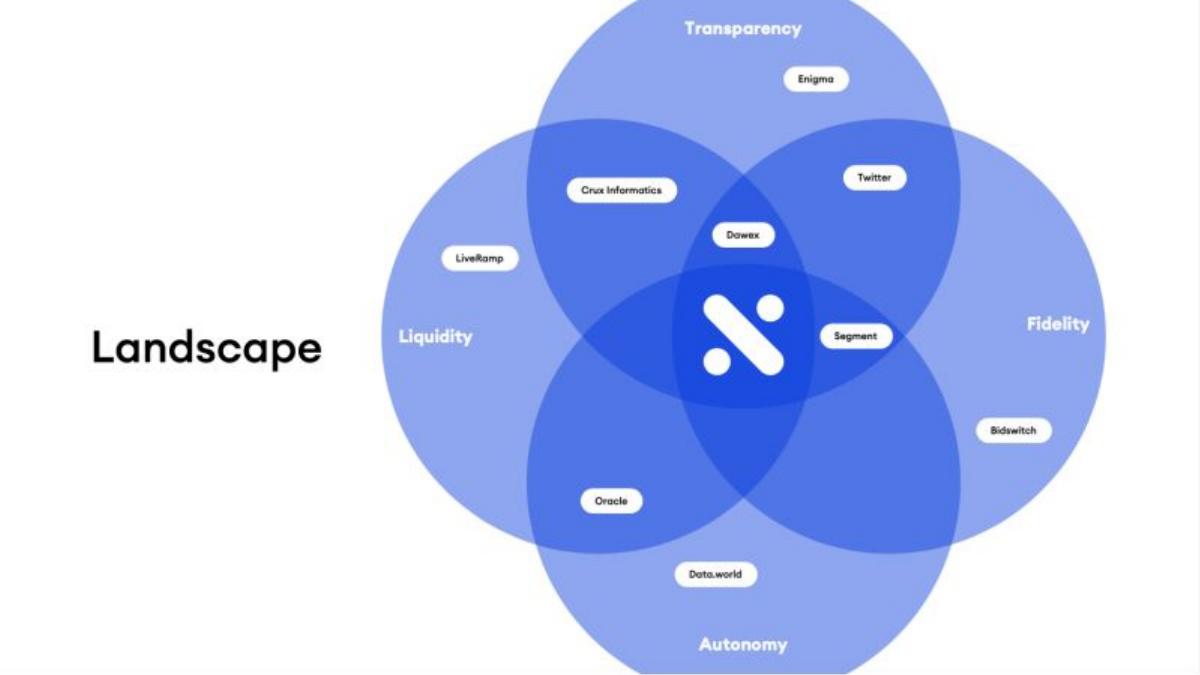
- Narrative positions itself at the intersection of Liquidity, Transparency, Fidelity, and Autonomy in a crowded landscape (Slide 6).
- The platform reported a marketplace scale of 31 sellers and 28 buyers at the time of the deck (Slide 7).
- Revenue growth is shown as a consistent upward trend from Q3 2018 through forecasted Q2 2020, though specific dollar amounts are omitted (Slide 9).
- The deck includes a 'Proven data outcomes' slide listing 9 industry acquisitions ranging from $150M to $4.4B to demonstrate exit potential (Slide 11).
- There is no team slide or founder background information included in the 12-slide sequence.
The Narrative Series A Teardown
Narrative’s 2020 Series A deck is a lean, 12-slide presentation that focuses on the mechanics of the data economy. Rather than relying on flashy branding or founder pedigree, the deck uses process mapping to expose the friction in how enterprises buy and sell data. The following is a slide-by-slide analysis of how they secured $8.5M in funding.
Slides 1-4: The Problem and Market Opportunity
Slide 1 opens with a massive TAM (Total Addressable Market) claim: the global data monetization market is estimated to reach $700 billion by 2025 . The text notes that while enterprises have 'fallen in love' with data, the marketplace capabilities haven't evolved as fast as the participants. This sets the stage for a 'market pull' narrative.
Slide 2 introduces the 'bad options' framework. It pits Data Brokers (high cost, no transparency, lock-in) against In-house builds (expensive, slow, negative network effects). By framing the status quo as a choice between two failures, Narrative creates a logical vacuum that only their solution can fill.
Slide 3 is perhaps the most important slide in the deck. It visualizes the 'manual process' of sourcing data. It breaks the workflow into five stages: Discover, Analyze, Protect, Transact, and Manage. Crucially, it attaches timelines to these steps, showing that the journey takes 6 months to complete. This is a classic 'show, don't just tell' tactic that quantifies pain for the investor.
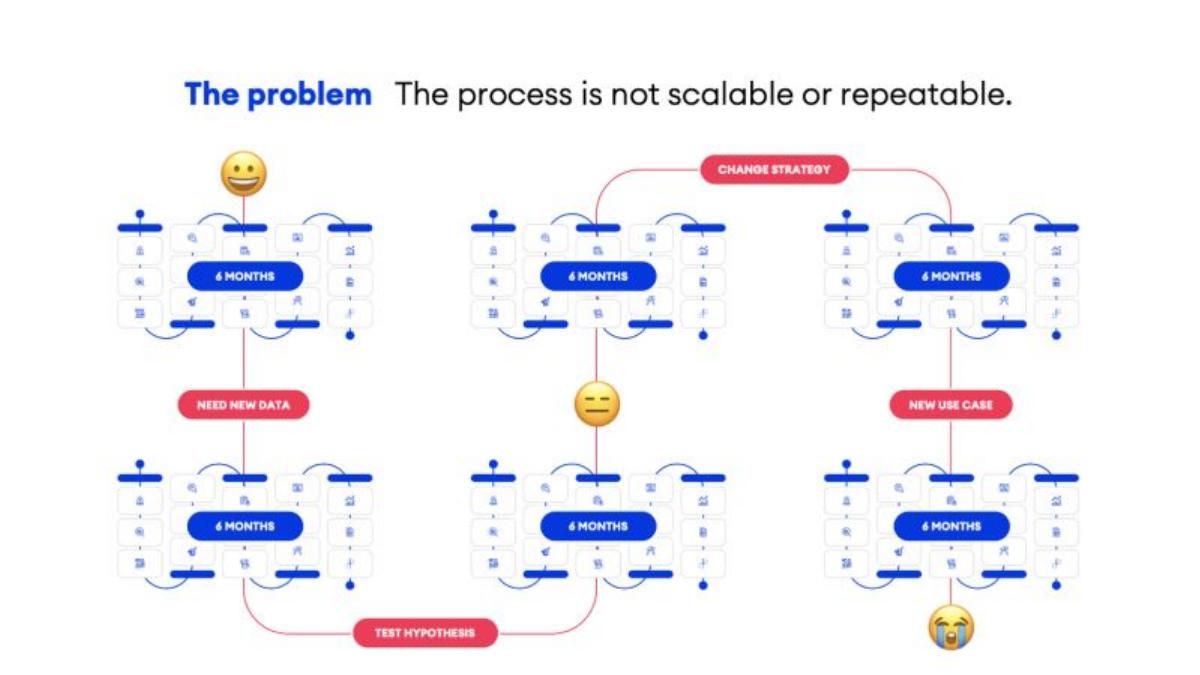
Slide 4 doubles down on this pain by showing that the 6-month process is not repeatable. It uses emojis to show a user's descent from happiness to tears as they realize that changing a strategy or needing new data requires restarting the entire 6-month cycle. It is a visceral way to argue for automation.
Slides 5-6: The Strategic Pillars and Competitive Landscape
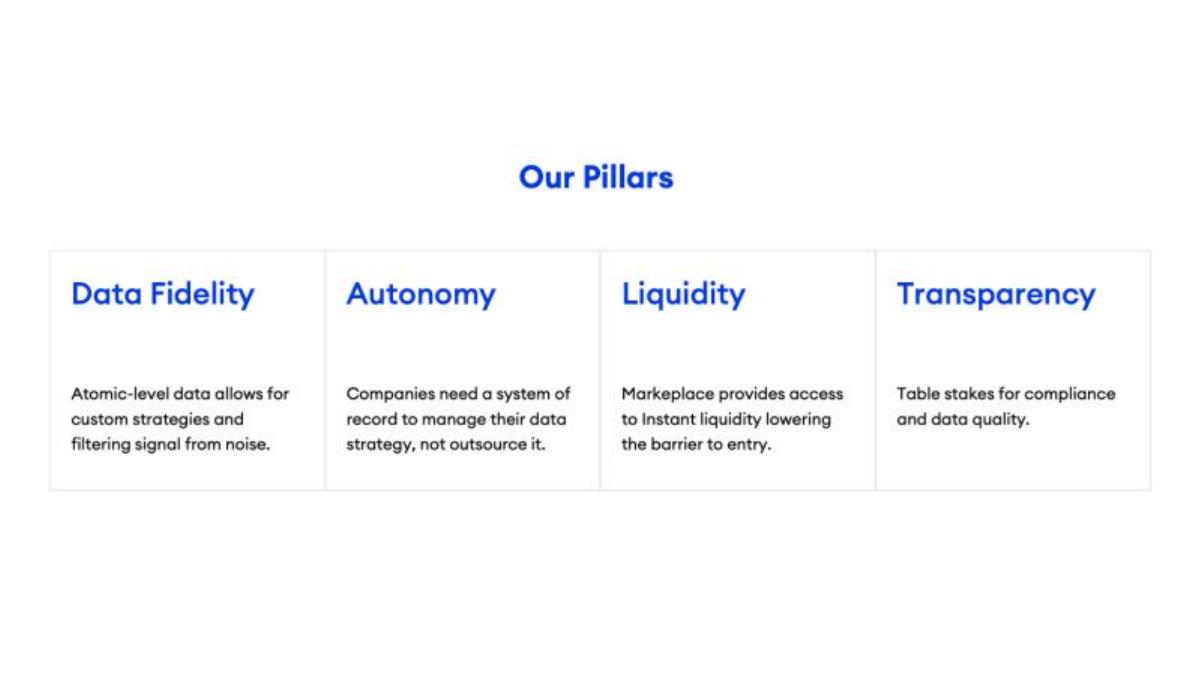
Slide 5 defines the company's 'Pillars': Data Fidelity, Autonomy, Liquidity, and Transparency. These aren't just features; they are presented as the fundamental requirements for a modern data strategy. By defining the terms of the debate, Narrative prepares the investor for the competitive slide that follows.
Slide 6 uses a landscape diagram to map competitors. Instead of a standard 2x2 grid, they use a four-circle Venn diagram. They place themselves at the center, while placing well-known entities like Twitter, Oracle, Segment, and LiveRamp in the periphery. This suggests that while these companies do one or two things well, only Narrative provides the full stack of transparency, fidelity, liquidity, and autonomy.
Slides 7-8: The Solution and Ecosystem
Slide 7 introduces the 'Narrative Federated Data Lake.' It provides a technical but accessible diagram of how data flows from sellers to buyers. It includes a specific traction metric: 31 sellers and 28 buyers . This proves the marketplace is live and functional, not just a theoretical concept.
Slide 8 expands this vision into a 'Data Operating System.' It introduces the concept of an 'Application Ecosystem' where third parties can build on top of Narrative. This is a key Series A 'platform play'—moving from a tool to an infrastructure layer that others rely on. It mentions 'Channel Partners' and '3rd party apps,' signaling future scalability beyond their own internal tools.
Slides 9-11: Traction, Product, and Exits
Slide 9 shows 'Net revenue growth.' The chart shows a steady climb from Q3 2018 through a forecasted Q2 2020. While the lack of dollar amounts on the Y-axis is a common way to protect sensitive data in shared decks, the consistent slope of the bars suggests a predictable and growing business model.
Slide 10 highlights a specific product feature: the Discover Assistant . It shows a screenshot of the platform, specifically a scatterplot for 'Uber Drivers' data. This grounds the high-level ecosystem talk in a tangible user interface, proving the software actually exists and is 'Live in the platform.'
Slide 11 is the 'Proven data outcomes' slide. This is an effective substitute for a traditional exit slide. By listing nine major acquisitions—such as Datalogix by Oracle for $1.2B and Krux by Salesforce for $700M —Narrative demonstrates that the data management sector is a hotbed for M&A. It tells the investor: 'If we win this category, here is who will buy us and for how much.'
Slide 12: External Reference
Slide 12 is a placeholder/promotional slide for the deck source and does not contain company-specific information.
What Narrative Got Right
Workflow Quantification: By mapping out the 6-month manual process on Slide 3, Narrative makes the 'why now' and 'why this' incredibly clear. They aren't just selling software; they are selling the recovery of six months of lost time. · Platform Positioning: Moving from Slide 7 (the marketplace) to Slide 8 (the operating system) shows a clear path to becoming an essential piece of enterprise infrastructure, which justifies a Series A valuation. · Exit Validation: Slide 11 is a powerful closer. It removes the 'who will buy this?' doubt by showing a long list of multi-hundred-million and billion-dollar exits in the exact same niche.
What is Missing
The Team: There is no mention of the founders, their backgrounds, or the engineering talent. In a technical 'Data Operating System' play, the 'who' is often as important as the 'what.' · The Ask: The deck never specifies how much money is being raised or what the specific milestones for the next 18-24 months are. · Unit Economics: While revenue growth is shown, there is no mention of Customer Acquisition Cost (CAC), Lifetime Value (LTV), or churn rates, which are standard for a Series A software teardown. · Business Model Details: The deck mentions a marketplace and tools, but it doesn't explicitly state if they take a percentage of transactions, a SaaS fee, or both.
Founder Takeaways
Visualize the friction: If your product replaces a manual process, map that process out step-by-step. Showing the 'before' state as a complex, multi-month ordeal makes your 'after' state look like magic. · Use Emojis sparingly but effectively: Slide 4 uses simple emojis to communicate the emotional toll of a bad business process. It’s a rare moment of personality in a dry technical deck that helps the message stick. · Define your own landscape: Don't feel restricted to a 2x2 grid. Narrative's Venn diagram on Slide 6 allowed them to claim a 'center' that didn't exist in traditional market maps.
Frequently asked questions
- What is the primary problem Narrative solves according to the deck?
- Narrative addresses the inefficiency of data acquisition. Slide 3 illustrates that sourcing data is currently a manual, fragmented process that takes at least six months to complete, involving legal hurdles, security questionnaires, and custom integrations. They argue that this process is neither scalable nor repeatable, leading to frustration when strategies change or new data is needed.
- How does Narrative differentiate itself from competitors like Oracle or LiveRamp?
- On Slide 6, Narrative uses a four-way Venn diagram to position itself as the only player offering a combination of Transparency, Fidelity, Liquidity, and Autonomy. While competitors like Oracle are placed in the 'Autonomy' quadrant and LiveRamp in 'Liquidity,' Narrative claims the center spot, suggesting a more holistic 'Data Operating System' approach.
- What metrics does the deck provide regarding their marketplace traction?
- Slide 7 provides a snapshot of their marketplace ecosystem, citing 31 sellers and 28 buyers. It also mentions a 'Narrative Federated Data Lake' for atomic-level data. Slide 9 shows a bar chart of 'Net revenue growth' from 2018 to 2020, though the Y-axis lacks specific numerical values, showing only relative growth and forecasts.
- Why did the deck include a list of billion-dollar acquisitions in the data space?
- Slide 11, titled 'Proven data outcomes,' serves as a proxy for a 'Market Validation' or 'Exit Strategy' slide. By listing acquisitions like Datalogix by Oracle ($1.2B) and Epsilon by Publicis ($4.4B), Narrative is signaling to investors that the category has a high ceiling for liquidity and that major incumbents are active buyers.
- What are the most significant omissions in this pitch deck?
- The most striking omission is the lack of a Team slide. In a Series A round, investors typically require deep bios of the founders and key engineers. Additionally, there is no 'Ask' slide (specifying how much they are raising) and no 'Use of Funds' slide, which are standard components of a fundraising narrative.