Nanogrid's 2017 pre-seed deck is a lean, 11-slide presentation that successfully raised $150,000 by targeting the growing complexity of the residential energy market. The deck relies heavily on visual storytelling, using complex utility rate charts to illustrate a problem that is difficult for homeowners to manage manually. By positioning their software as a way to optimize solar, storage, and EV charging, the founders tapped into the 'smart home' trend of the late 2010s. While the deck lacks a formal 'Ask' slide or detailed unit economics, it compensates with a high-pedigree team featuring b…
Key takeaways
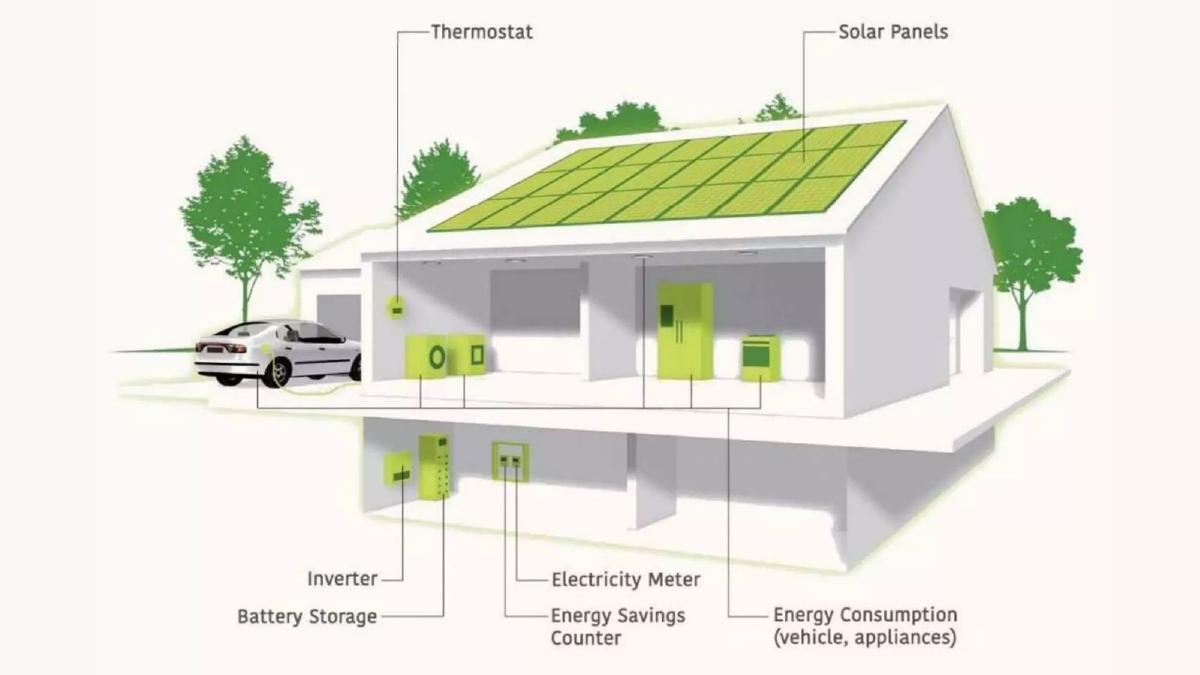
- The deck uses a visual diagram of a home to identify six key energy components: thermostat, solar panels, inverter, battery storage, electricity meter, and energy consumption (Slide 2).
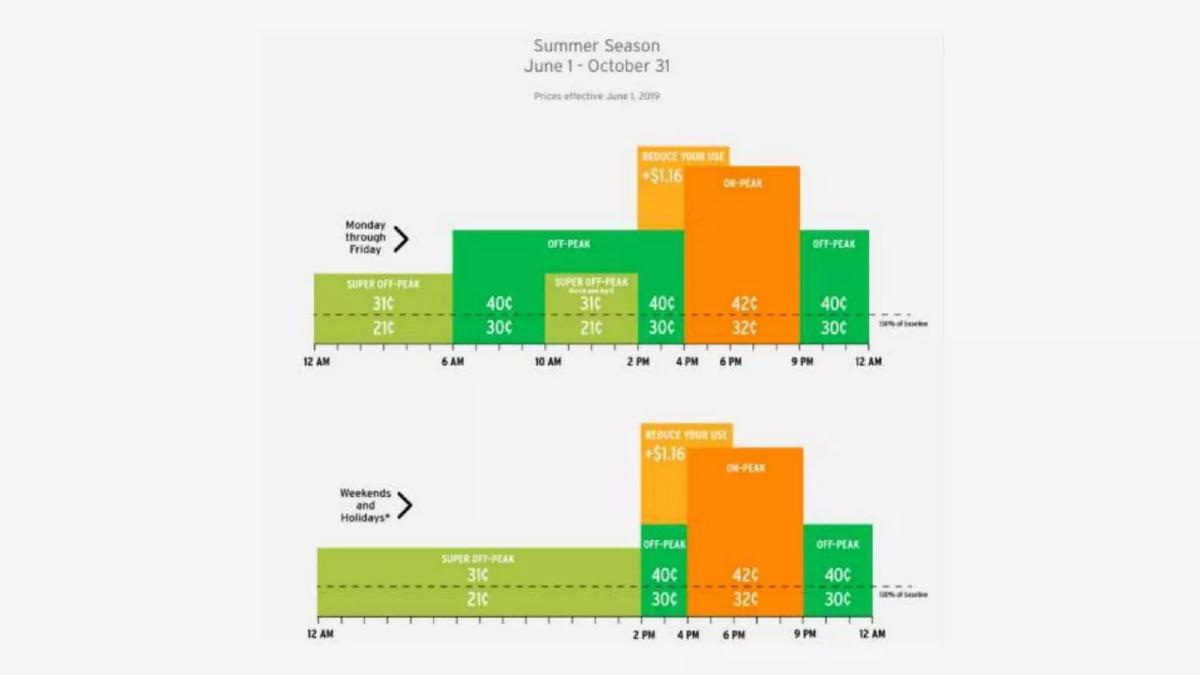
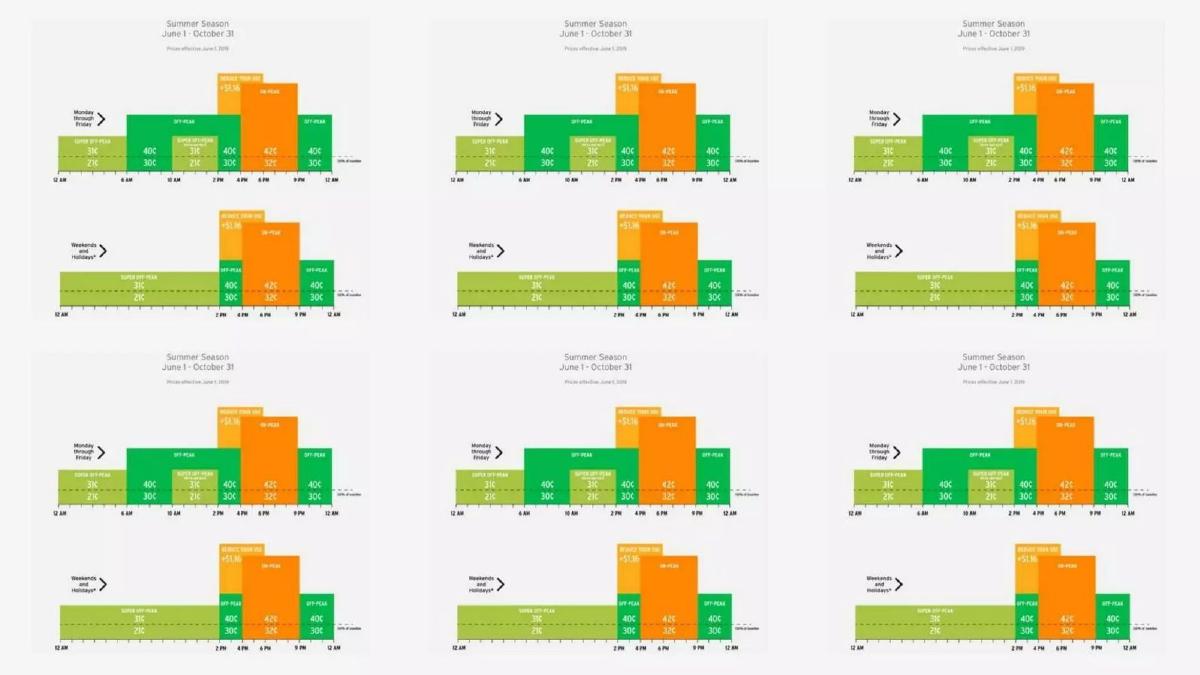
- A complex utility rate chart for the 'Summer Season' illustrates the difficulty of manual energy management, showing rates fluctuating between 21 cents and 42 cents per kWh (Slide 3).
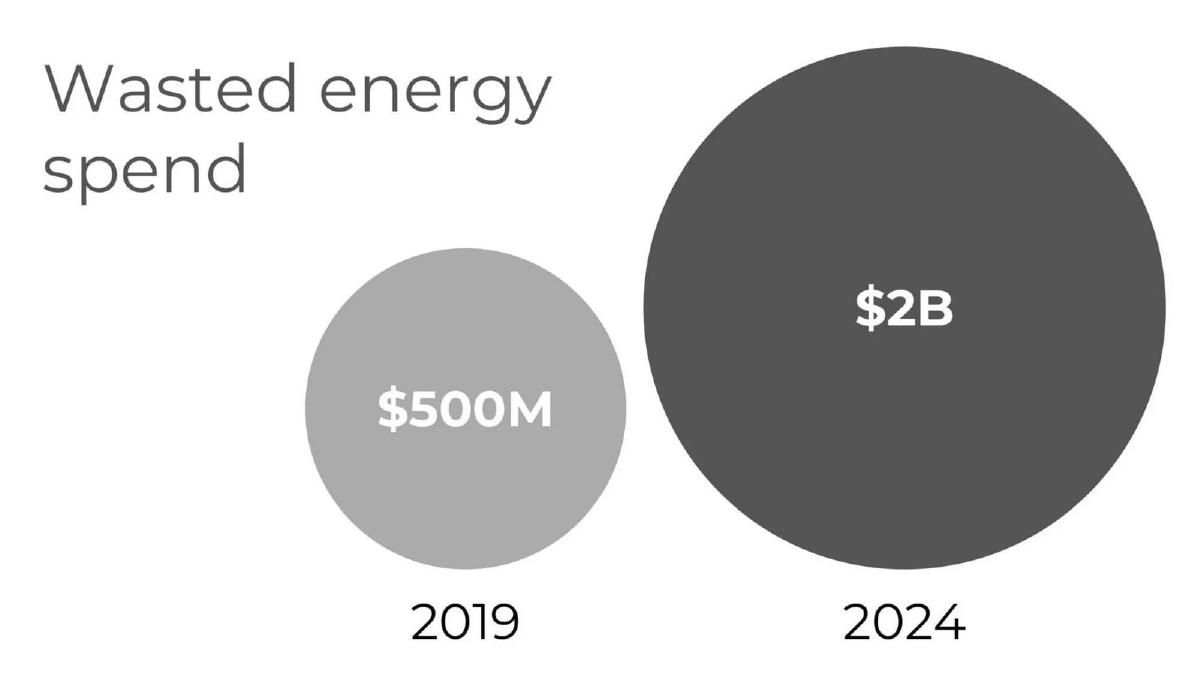
- The market opportunity is framed as 'Wasted energy spend,' projected to grow from $500M in 2019 to $2B in 2024 (Slide 5).
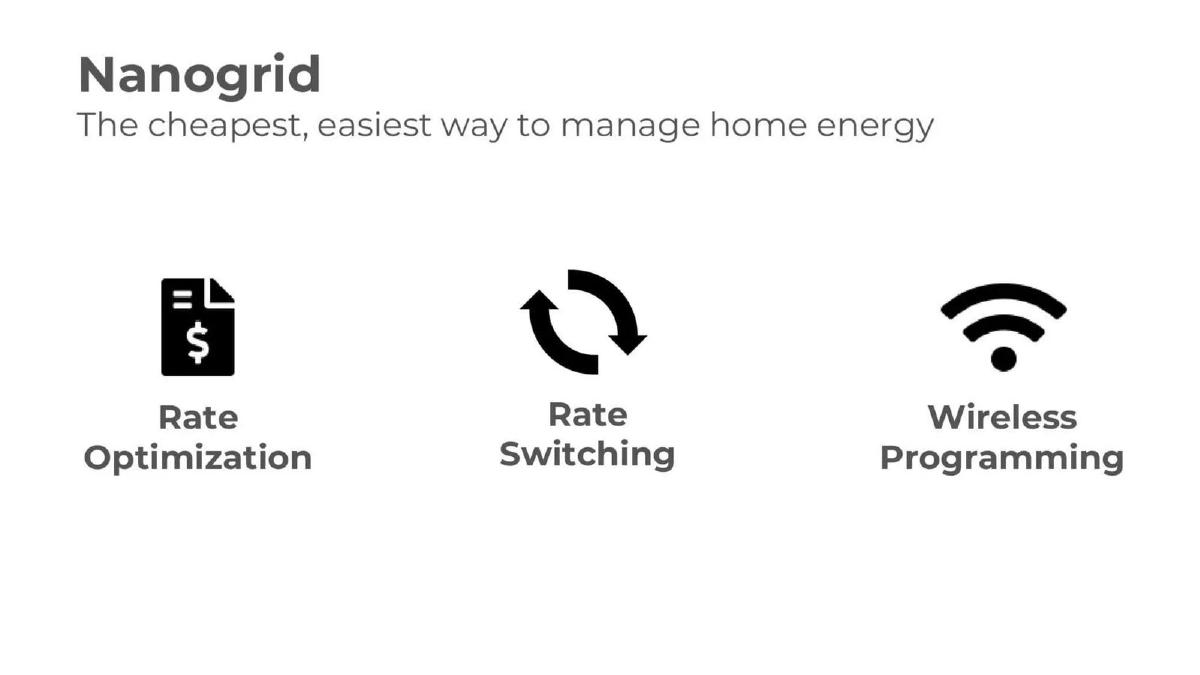
- The solution is distilled into three core pillars: Rate Optimization, Rate Switching, and Wireless Programming (Slide 6).
- The deck uses a comparative visual between a 'typical programmable thermostat' and a Nest thermostat to imply their software will provide a similar UX leap for energy management (Slide 7).
- The team slide highlights technical pedigree with logos for MIT, Olin College of Engineering, and Genability, plus a Forbes 30 Under 30 recognition (Slide 9).
- Traction is represented by a single figure: '$250k Revenue in ~1 Year' (Slide 10).
- The deck completely omits a specific funding request, valuation, or breakdown of how the $150,000 raise would be spent.
Introduction: The Lean Technical Pitch
Nanogrid’s 2017 pitch deck is a classic example of a pre-seed technical pitch. At just 11 slides, it doesn't get bogged down in corporate jargon or over-designed graphics. Instead, it focuses on a singular, growing pain point: the increasing complexity of the electrical grid for the average homeowner. By 2017, the proliferation of residential solar, home batteries (like the Tesla Powerwall), and electric vehicles had created a 'nanogrid' within the home, but the software to manage these assets was lagging. This teardown explores how Nanogrid used visual evidence of market complexity to justify their existence.
The Vision and the Ecosystem (Slides 1-2)
Slide 1 is a standard title slide featuring the logo and the tagline: "Making home energy transparent and clean." It includes an AngelList link and a contact email, signaling this was likely used for early-stage outreach. Slide 2 provides the necessary context for the company name. It shows a cross-section of a modern home, labeling the components that Nanogrid intends to orchestrate: the thermostat, solar panels, inverter, battery storage, electricity meter, and general energy consumption from vehicles and appliances. This slide effectively defines the 'surface area' of their product without needing a wall of text.
The Complexity Problem (Slides 3-4)
Slide 3 is perhaps the most important slide in the deck. It displays a 'Time of Use' (TOU) rate chart for the summer season. It shows that electricity isn't just one price; it fluctuates between 21 cents and 42 cents per kWh depending on the time of day and whether it is a weekday or weekend. Slide 4 repeats this chart six times in a grid. While this might seem like a formatting error, it serves a rhetorical purpose: it visually overwhelms the viewer, reinforcing the idea that managing these rates across different seasons and utilities is impossible for a human to do manually. It sets the stage for an automated software solution.
Market Opportunity and Solution (Slides 5-6)
Slide 5 addresses the 'Why Now?' and 'How Big?' questions. It uses two simple circles to represent 'Wasted energy spend.' It claims the market was $500M in 2019 and would grow to $2B by 2024. Note that since the deck is from 2017, these were forward-looking projections at the time. Slide 6 introduces the Nanogrid solution, described as "The cheapest, easiest way to manage home energy." It breaks the product down into three functional icons: Rate Optimization (calculating the best times to use energy), Rate Switching (moving between utility plans), and Wireless Programming (the actual control of the devices).
The 'Nest' Comparison and Product Scope (Slides 7-8)
Slide 7 uses a powerful visual analogy. On the left, it shows a cluttered, 'Typical Programmable Thermostat Interface' with dozens of tiny buttons and confusing labels. On the right, it shows the sleek, minimalist Nest thermostat. There is no text on this slide, but the message is clear: Nanogrid intends to do for the entire home energy system what Nest did for the thermostat—replace manual complexity with elegant automation. Slide 8 shows various appliances—a dishwasher, an EV charger, a dryer, a home battery, and a water heater—under the Nanogrid logo, indicating the breadth of devices their software can control.
Team, Traction, and Conclusion (Slides 9-11)
Slide 9 presents the team. CEO Jon McKay and CTO Dan Lopuch are positioned as high-pedigree founders. The slide includes logos for Olin College of Engineering, MIT, and Genability. The inclusion of the 'Forbes 30 Under 30' logo adds third-party validation, which is crucial in a pre-seed round where the product may still be in development. Slide 10 provides the only hard financial metric in the deck: "$250k Revenue in ~1 Year." This is a strong traction signal for a pre-seed company, suggesting they already had paying B2B customers or pilot programs. Slide 11 is a repeat of the title slide, serving as a contact page.
What Works in the Nanogrid Deck
The strongest element of this deck is its visual storytelling . Instead of explaining that utility rates are complicated, Slide 3 and 4 show the complication. The comparison to Nest on Slide 7 is a brilliant way to communicate a value proposition (simplicity) by piggybacking on a well-known success story in the same industry. Furthermore, the team slide is exceptionally strong for a $150k raise. Having a founder from Genability—a company that literally maps utility rates—provides immediate founder-market fit. The deck is also refreshingly concise ; it respects the investor's time by focusing only on the problem, the solution, and the proof that the team can build it.
What Is Missing from the Nanogrid Deck
The most glaring omission is the Ask . There is no slide indicating how much money they are looking for, what the milestones are for the next 18 months, or how the funds will be allocated. While this information is often handled in the body of an email or a face-to-face meeting, including it in the deck helps anchor the conversation. Additionally, the deck lacks a Business Model slide. We know they have $250k in revenue, but we don't know if that came from one-off consulting, software licenses, or hardware markups. Finally, there is no Competitive Landscape . In 2017, companies like OhmConnect or various DERMS (Distributed Energy Resource Management Systems) providers were already in the space; failing to acknowledge them can make a founder look uninformed.
What a Founder Should Copy
Founders in technical or 'unsexy' industries (like utilities) should copy Nanogrid's use of raw data as a problem statement . If your industry is governed by complex regulations or spreadsheets, put those spreadsheets on a slide to show how painful they are. Also, the analogy slide (Slide 7) is a masterclass in positioning. If you are building the 'X for Y,' find a visual way to represent that transition from the 'old way' to the 'new way.' Lastly, the minimalist design —using high-quality icons and plenty of white space—ensures that the investor's focus remains on the core message rather than distracting graphics.
Final Thoughts
Nanogrid’s deck is a 'teaser' style presentation. It is designed to get a meeting, not to serve as a comprehensive due diligence document. For a $150,000 pre-seed round, this level of detail is often sufficient, provided the team pedigree and early traction are as strong as they appear here. It successfully identifies a massive shift in the energy landscape and positions the founders as the right people to navigate it.
Frequently asked questions
- How much did Nanogrid raise with this deck?
- According to the catalogue data, Nanogrid raised $150,000 in a Pre-Seed round in 2017. The deck itself does not state the amount raised or the terms of the investment, which is common for decks shared after a round closes or used for initial interest.
- What is the primary problem Nanogrid is solving?
- The problem is the complexity of residential energy pricing. Slide 3 and Slide 4 show intricate 'Time of Use' rate schedules where prices change based on the hour of the day and season. Nanogrid argues that homeowners cannot optimize their solar, EV, and battery usage against these rates without automated software.
- Who are the founders of Nanogrid?
- The company was founded by Jon McKay (CEO) and Dan Lopuch (CTO). Their credentials, shown on Slide 9, include education from Olin College of Engineering and MIT, and professional experience at Genability, a company specializing in utility rate data.
- What is Nanogrid's business model?
- The deck does not explicitly detail the business model (e.g., SaaS fees, percentage of savings, or hardware partnerships). However, the catalogue listing mentions they serve solar installers, EV makers, and storage developers, suggesting a B2B or B2B2C software integration model.
- Is there a clear exit strategy or financial projection in the deck?
- No. The deck is very lean on financials. It provides a single market size projection for 'Wasted energy spend' ($2B by 2024 on Slide 5) and a single traction point ($250k revenue on Slide 10), but lacks a multi-year P&L or exit analysis.