TasteSpace's 2013 seed deck is a masterclass in identifying a massive regional market gap. By highlighting that 99% of Latin American restaurants were not selling online despite spending on traffic, the company positioned itself as the essential infrastructure for the region's $70 billion restaurant industry. The deck effectively uses traction metrics—showing $2,000,000+ in generated restaurant revenue and 10% month-over-month growth in orders—to prove product-market fit. While the business model relies on a hybrid of annual subscriptions ($300-$1000) and transaction fees (5-10%), the deck's…
Key takeaways
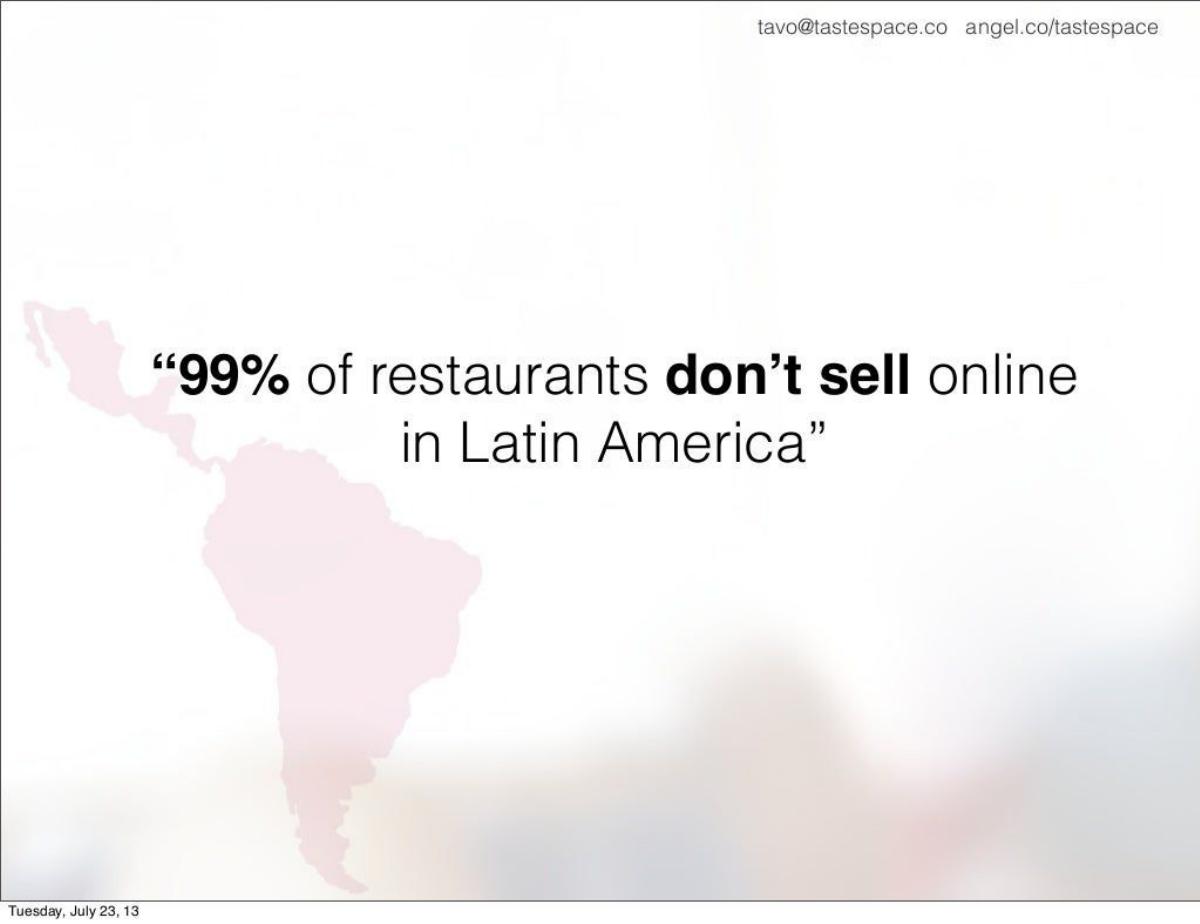
- The deck identifies a stark market inefficiency: 99% of Latin American restaurants do not sell online (Slide 2).
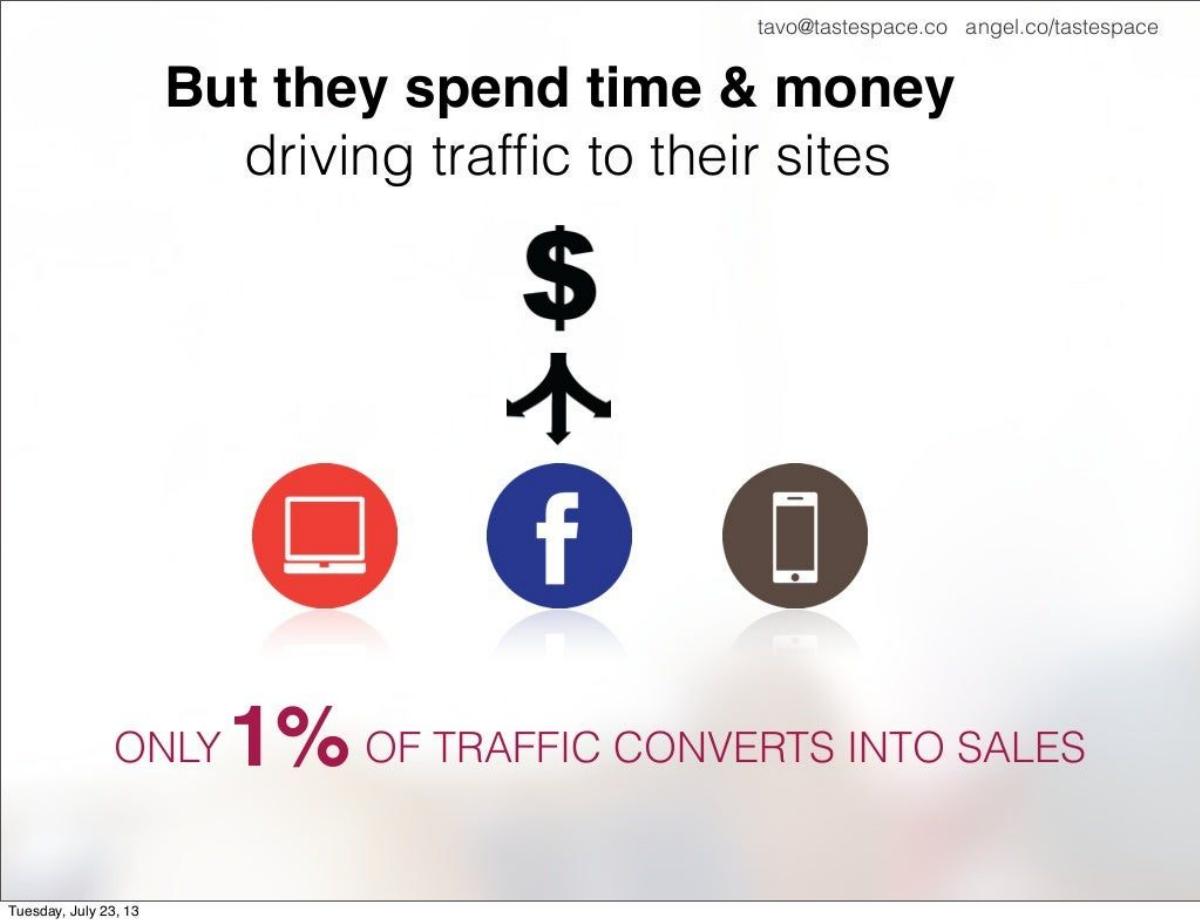
- TasteSpace claims to convert traffic better than existing sites, where only 1% of traffic currently converts to sales (Slide 3).
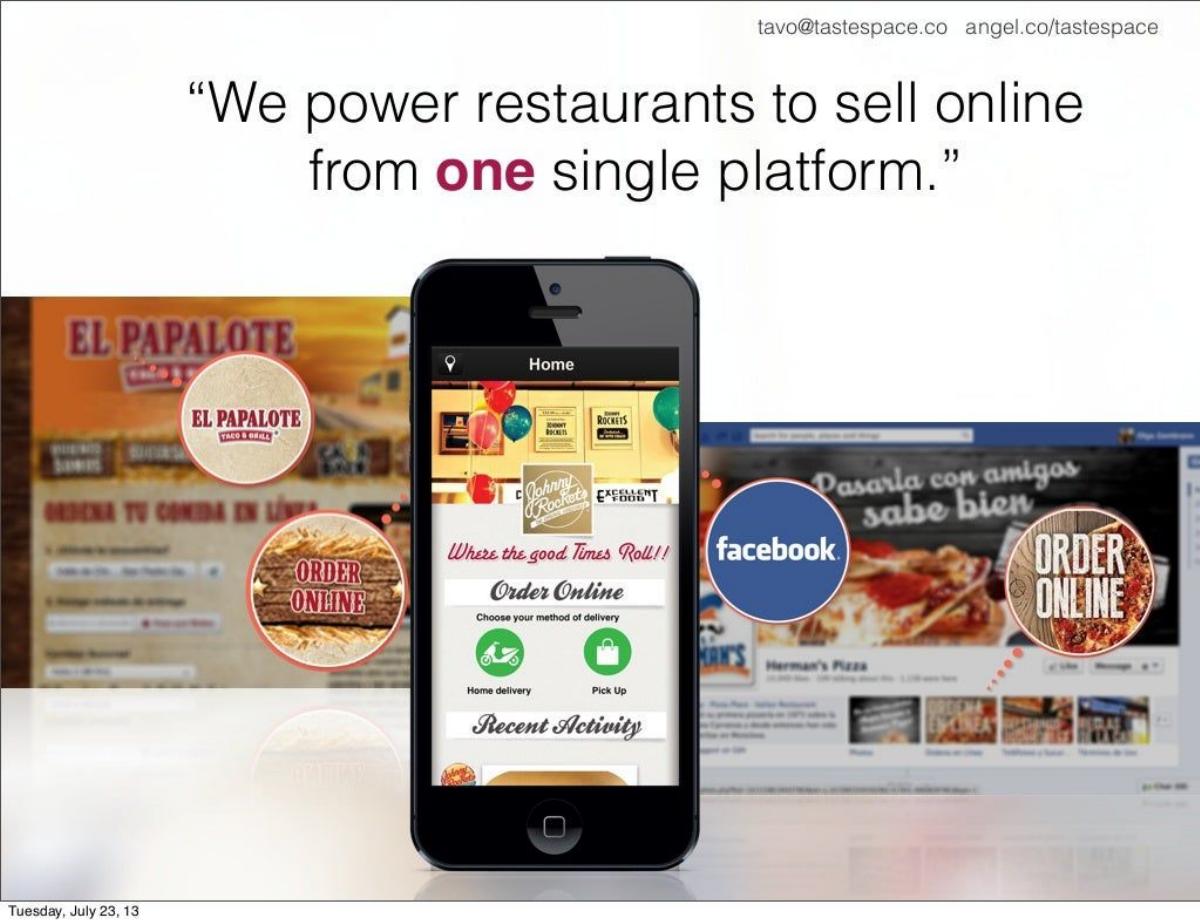
- The product is a unified platform managing restaurant presence across web, mobile, Facebook, and a marketplace (Slide 9).
- Traction is significant, with over $2,000,000 in revenue generated for restaurants across Argentina, Mexico, and Chile (Slide 10).
- The company achieved a 10% month-over-month growth rate in online food orders, totaling 120,000+ orders (Slide 11).
- The market opportunity is valued at $70 billion, with 4,000,000+ restaurants in LATAM, four times more than in the USA (Slide 16).
- Revenue is generated through a $300 - $1,000 annual subscription plus a 5-10% fee per online order (Slide 18).
- The team is supported by high-level advisors, including Glenn Allen, a co-founder of OpenTable (Slide 20).
TasteSpace: The Infrastructure for LATAM's Digital Dining Revolution
The 2013 pitch deck for TasteSpace represents a pivotal moment in the Latin American tech ecosystem. At a time when the U.S. market was already seeing consolidation in food tech, TasteSpace identified that the LATAM market was essentially a blank slate. With 21 slides, the deck focuses on the sheer scale of the untapped opportunity and the company's early success in capturing it. The narrative is driven by a 'single platform' solution for a fragmented problem.
Slides 1-3: The Problem of the 99%
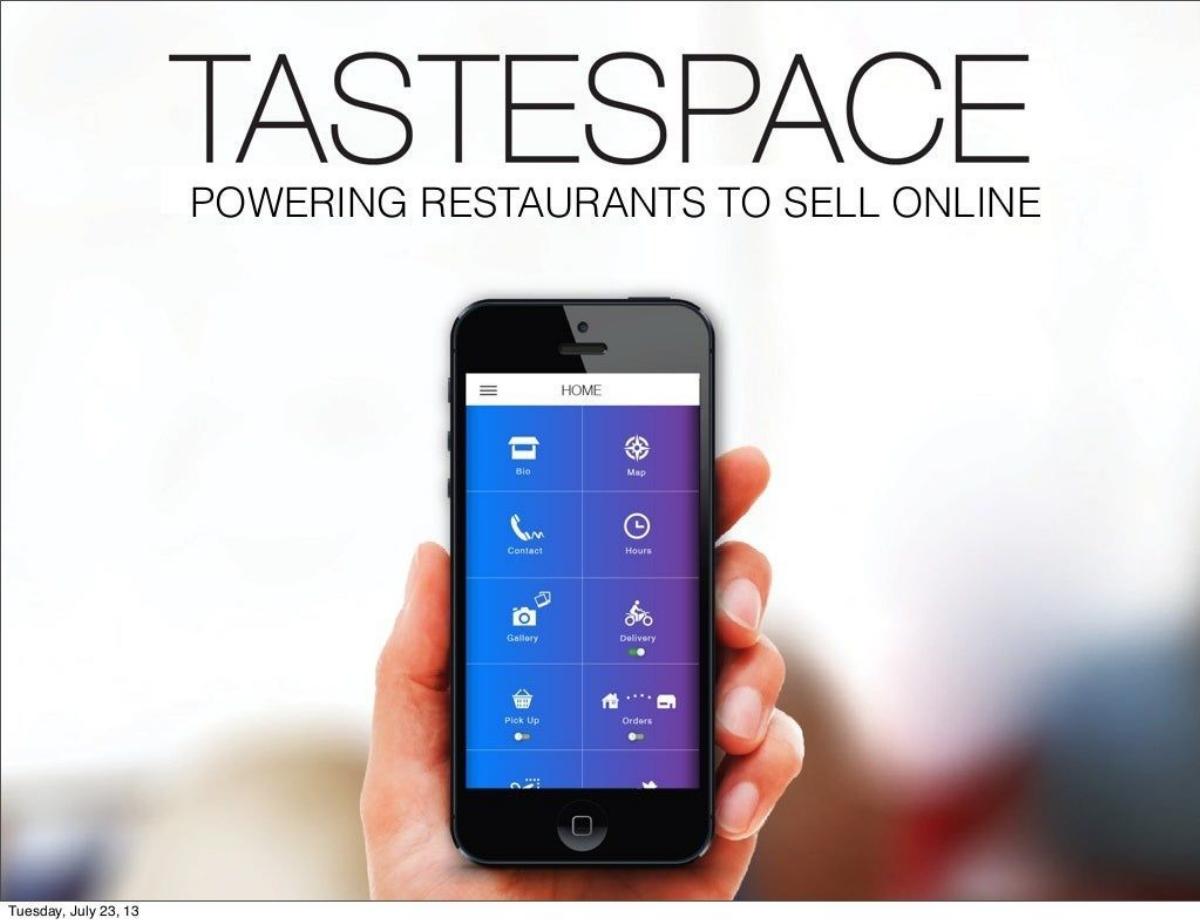
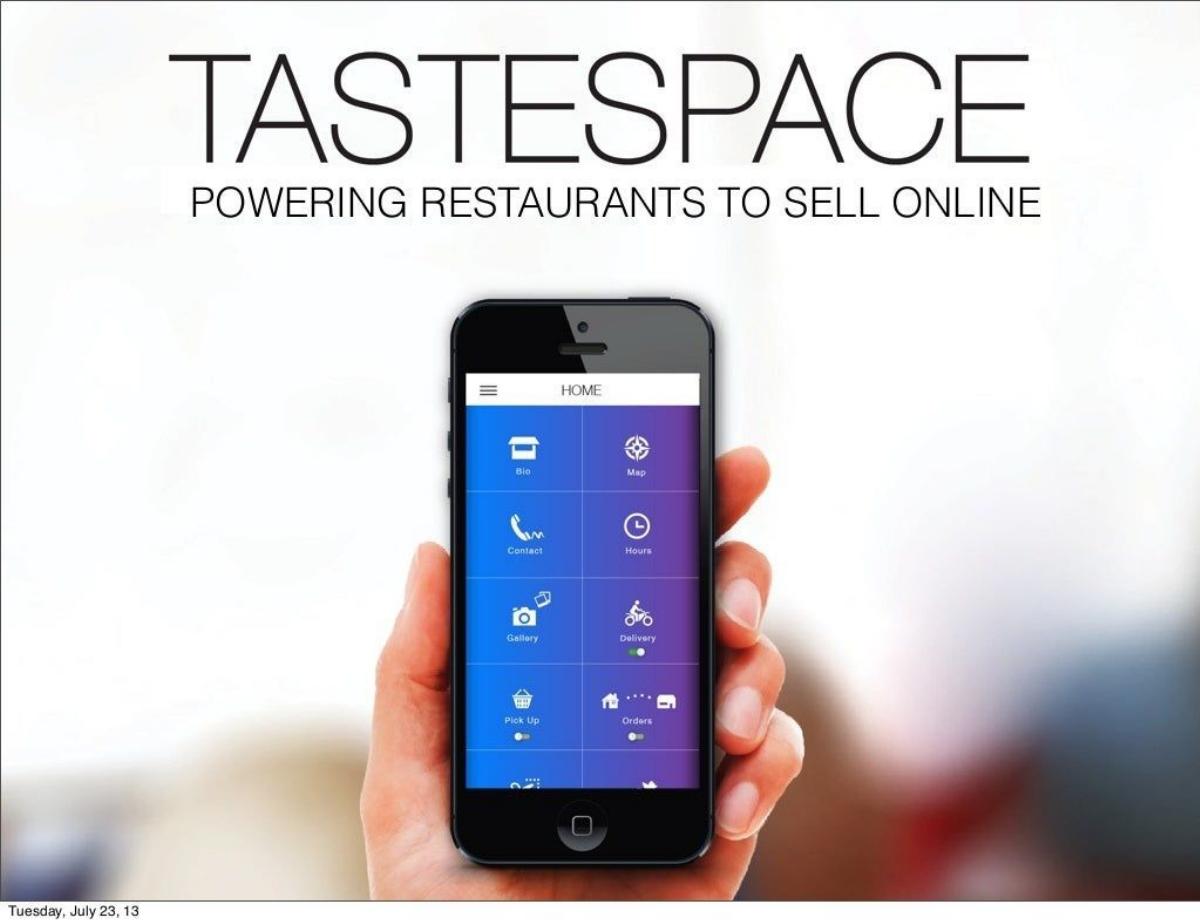
The deck opens with a clear value proposition on Slide 1 : "Powering restaurants to sell online." This is immediately followed by a staggering statistic on Slide 2 : "99% of restaurants don't sell online in Latin America." By leading with this number, TasteSpace establishes the magnitude of the market inefficiency. Slide 3 adds another layer to the problem, noting that even when restaurants drive traffic to their sites via Facebook or mobile, only 1% of that traffic converts into sales. This sets up the 'why now' and 'why us'—the current solutions are failing to capture intent.
Slides 4-9: The Unified Solution
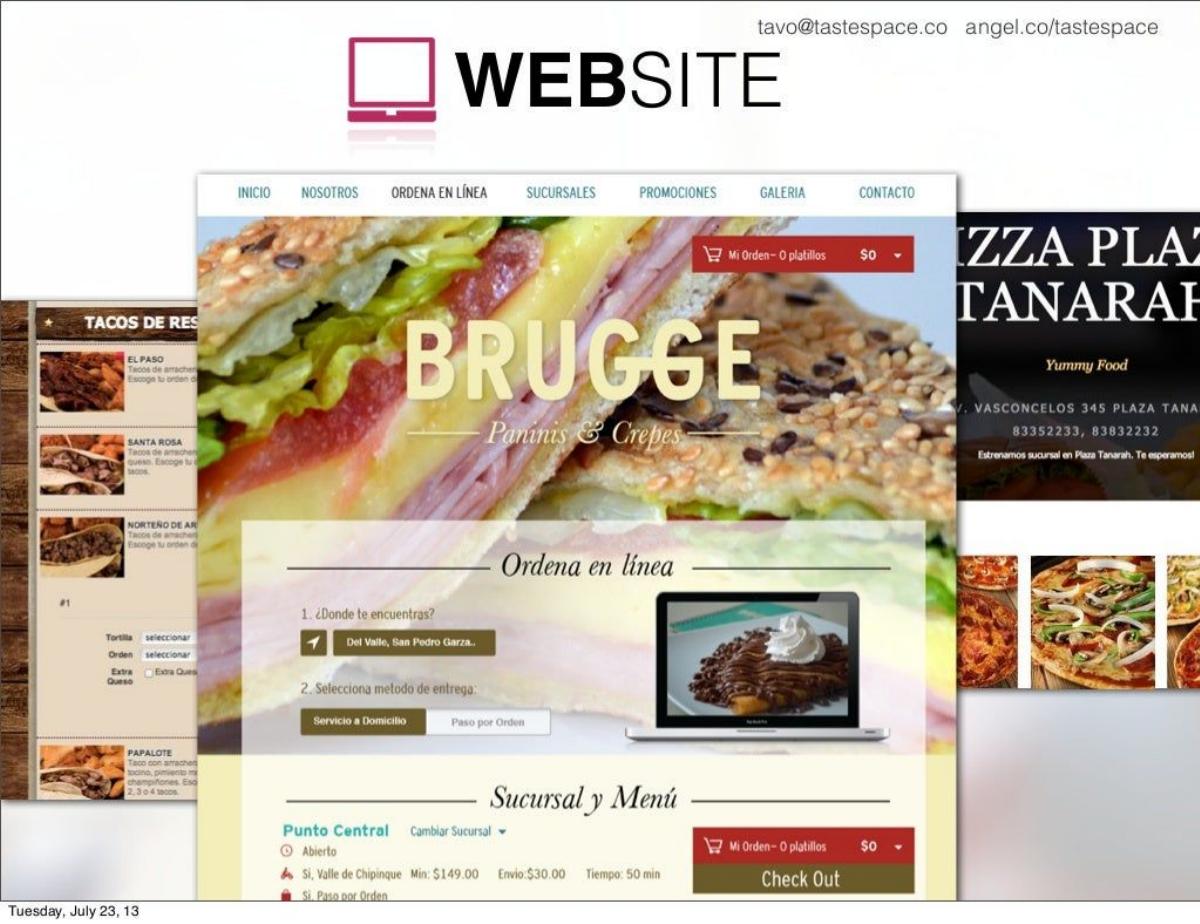
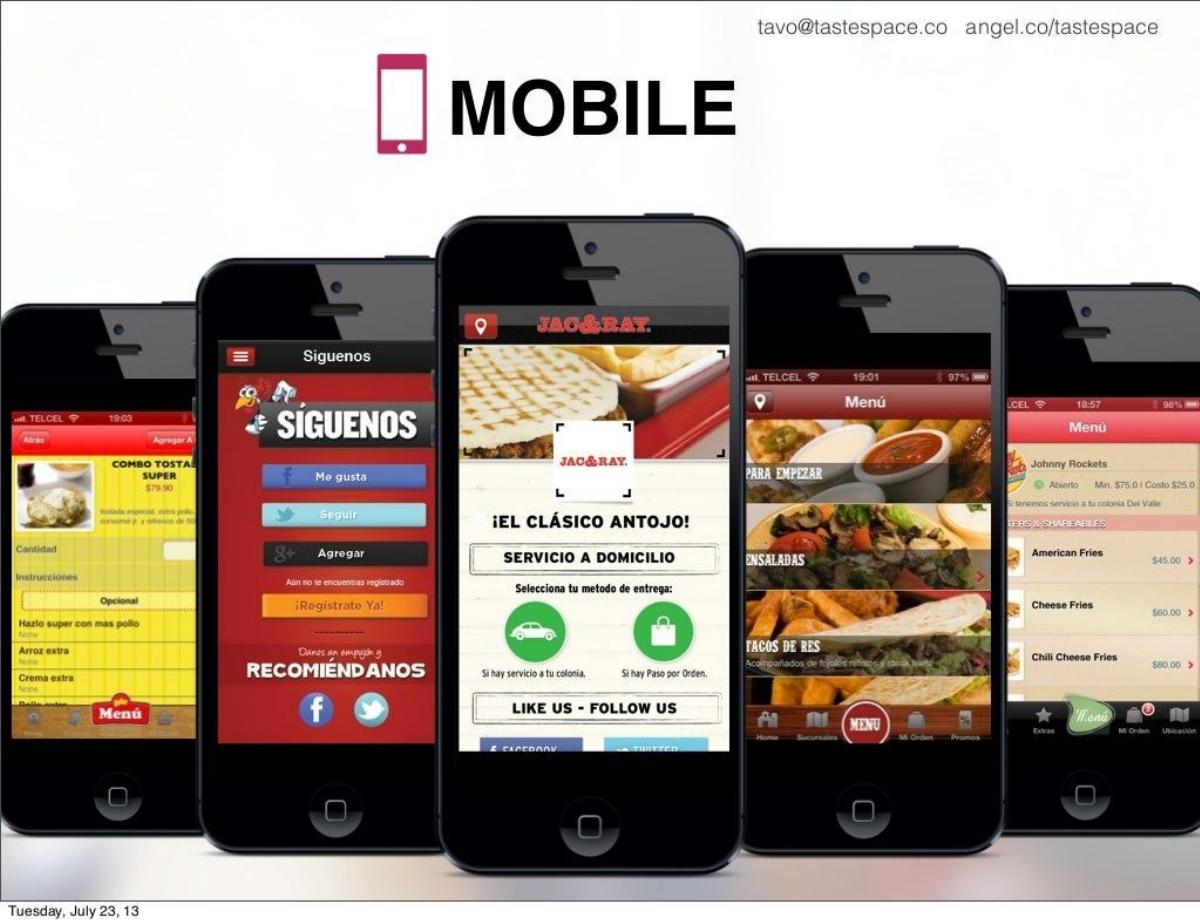
Slide 4 introduces the core product philosophy: a single platform to power sales across all channels. The following slides ( Slides 5, 6, 7, and 8 ) provide visual proof of the product's versatility, showing the interface on Web, Mobile, Facebook, and their own Marketplace. This multi-channel approach was sophisticated for 2013, recognizing that consumers were beginning to move away from desktop-only browsing. Slide 9 summarizes this by showing TasteSpace as the central hub connecting the restaurant to Facebook, Web, Mobile, and the Marketplace.
Slides 10-14: Proving Traction
The middle section of the deck is dedicated to hard metrics. Slide 10 claims the company has generated $2,000,000+ in revenue for restaurants across Argentina, Mexico, and Chile. This is a critical slide because it proves the business isn't just a theoretical tool; it is a revenue generator. Slide 11 shows a growth curve for online food orders, citing 120,000+ orders and 10% month-over-month growth. Slide 12 highlights user engagement, with 100,000+ unique visitors in May and 25% month-over-month growth in active users. Slide 13 adds a layer of social proof, claiming the #1 App spot in the Food & Beverages category in Mexico. Slide 14 displays logos of major clients like Applebee's, Subway, Domino's, and KFC, proving that the platform scales from local eateries to global franchises.
Slides 15-17: Market Opportunity and Regional Dynamics
Slide 15 highlights a strategic partnership with CANIRAC (National Chamber of Restaurant Industry), giving them a pipeline to 10,000+ restaurants in Mexico. Slide 16 defines the Total Addressable Market (TAM) as a $70 billion industry with 4,000,000+ restaurants in LATAM—noting this is four times the number of restaurants in the USA. Slide 17 provides a nuanced look at regional growth, stating that 28% of restaurants in LATAM have delivery compared to only 14% in the USA, suggesting a higher cultural propensity for the service TasteSpace enables.
Slides 18-21: Business Model, Team, and The Ask
Slide 18 outlines the revenue model: a hybrid of an annual subscription ($300 - $1,000) and a transaction fee (5-10% per order). This model provides both predictable SaaS-like revenue and upside from transaction volume. Slide 19 shows recent financial performance, with $16,000+ in revenue generated in the last month and 18% growth over five months. Slide 20 introduces the team, which includes industrial engineers and computer scientists, but the real weight comes from the advisors, specifically Glenn Allen (Co-Founder of OpenTable). Finally, Slide 21 presents the ask: $750,000 for a Delaware-based company.
What Works in the TasteSpace Deck
The most effective element of this deck is the Problem-Solution alignment . By quantifying the problem (99% offline) and then immediately showing a solution that covers every possible digital touchpoint (Web, Mobile, Facebook), the founders make the product feel inevitable. The use of comparative market data on Slide 16 (LATAM vs. USA) is also a brilliant move for attracting international investors who might be more familiar with the US market but are looking for higher growth in emerging regions.
The traction slides are also exceptionally well-handled. Instead of just showing their own revenue, they lead with the revenue they generated for their customers ($2M+). In the B2B space, showing that you are a profit center rather than a cost center is the fastest way to build trust with both investors and potential clients.
What is Missing from the TasteSpace Deck
Despite its strengths, the deck has a few notable omissions. First, there is no explicit competition slide . While they mention they are the #1 app, they don't address how they differ from local competitors or global giants that might enter the region. Second, the unit economics are vague. While we see the subscription and transaction fees, we don't see the Customer Acquisition Cost (CAC) or the Lifetime Value (LTV), which are crucial for a seed round aiming to scale across multiple countries.
Additionally, the use of funds is not detailed. Slide 21 asks for $750,000 but doesn't explain how that money will be allocated—whether for engineering, sales expansion into new countries, or marketing. Investors generally want to see a roadmap of how the capital will reach the next milestone.
Founder Takeaways: What to Copy
Lead with a 'Shock' Statistic: The "99% offline" stat on Slide 2 is the hook that makes the rest of the deck worth reading. If your market has a massive, obvious gap, quantify it immediately. · Show the Ecosystem: If your product is a platform, don't just show one dashboard. Show how it lives across the devices and services your customers actually use (as seen in Slides 5-8). · Leverage Strategic Partnerships: The CANIRAC partnership on Slide 15 is a massive credibility booster. It shows the company has a 'moat' or at least a significant head start in customer acquisition. · Focus on Customer Success: Highlighting the $2M+ generated for restaurants (Slide 10) is more persuasive than simply showing the startup's own modest revenue. It proves the value proposition is being realized. · Recruit Industry Titans as Advisors: Having the co-founder of the most successful US equivalent (OpenTable) as an advisor (Slide 20) provides an enormous amount of 'borrowed' credibility for a regional play.
Frequently asked questions
- What was the core problem TasteSpace aimed to solve?
- TasteSpace targeted the massive digital divide in the Latin American restaurant industry. According to slide 2, 99% of restaurants in the region did not sell online. Furthermore, slide 3 noted that even for those with a digital presence, only 1% of traffic converted into sales. TasteSpace aimed to bridge this gap by providing a single platform to manage online ordering across all digital channels.
- How did TasteSpace demonstrate product-market fit?
- The deck relies heavily on transaction and user growth data. Slide 10 shows they generated over $2,000,000 in revenue for their restaurant partners. Slide 11 highlights 120,000+ total orders with 10% month-over-month growth, and slide 12 shows 100,000+ unique visitors in a single month. This volume of activity across multiple countries (Mexico, Argentina, Chile) proved the regional demand for their solution.
- What was the competitive advantage mentioned in the deck?
- TasteSpace positioned itself as a 'unified platform' (Slide 9). Instead of a restaurant managing separate vendors for their website, mobile app, and Facebook page, TasteSpace controlled the 'whole online presence' from one place. They also secured a strategic partnership with CANIRAC, the national chamber of the restaurant industry in Mexico, providing access to 10,000+ restaurants (Slide 15).
- What was the revenue model for TasteSpace?
- The company utilized a two-pronged monetization strategy as detailed on slide 18. They charged restaurants an annual platform subscription fee ranging from $300 to $1,000. In addition to this recurring revenue, they took a transaction fee of 5-10% on every online order processed through their system, aligning their success with the restaurant's sales growth.
- Who were the key people involved in the startup?
- The founding team included Tavo Zambrano (Industrial Engineer), Olga Zambrano (Industrial Designer), and Harish Malik (Computer Science). They were supported by a robust advisory board, most notably Glenn Allen, a co-founder of OpenTable, and Mario Valle, the Director of Emerging Markets at EA, providing deep expertise in both restaurant tech and regional scaling (Slide 20).