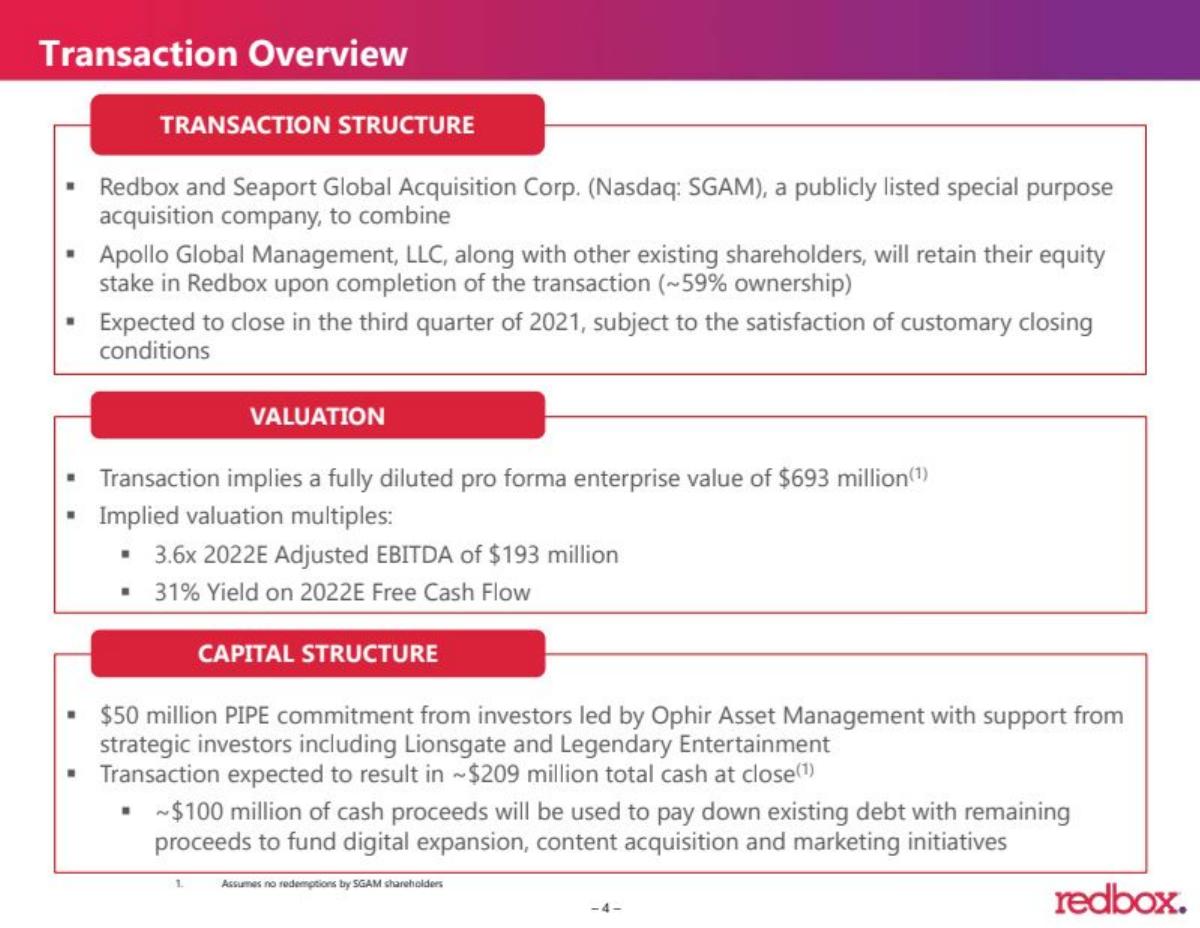
The Redbox SPAC deck is a masterclass in 'bridge' storytelling—attempting to convince investors that a declining legacy business is actually a launchpad for a high-growth digital future. By highlighting 40 million customers and 39 million loyalty members, Redbox argues that its physical kiosks are low-cost acquisition funnels for its new AVOD and SVOD services. The deck leans heavily on 'multi-product' economics, showing that customers using both physical and digital services generate 5x higher ARPU. While the financial projections were aggressive, predicting a return to $237M Adjusted EBITDA…
Key takeaways
- Redbox operates over 40,000 kiosks and has rented more than 6 billion discs to date (Slide 7).
- The company identifies 70% of its customer base as 'late adopters of new technology,' positioning itself as a unique bridge to digital for this demographic (Slide 9).
- Multi-product customers who use physical rentals, Redbox On Demand, and Perks generate up to 5x higher ARPU than kiosk-only users (Slide 17).
- The digital transformation thesis is supported by a 2.25x digital growth rate in 2020 (Slide 13).
- Redbox Entertainment has released 16 original titles to date, with a target of 36+ releases per year to improve margins (Slide 21).
- Adjusted EBITDA is projected to grow from a 2021 estimate of $101M to $237M by 2023 (Slide 23).
- The company faces a significant 'content gap' due to COVID-19, with theatrical titles dropping from 140 in 2019 to a projected low in early 2021 (Slide 33).
- Redbox claims an 81.5% Free Cash Flow conversion rate from its legacy business to fund digital expansion (Slide 13).
Executive Summary and Presenters
Slide 1: Title Slide
The presentation begins with a standard corporate title slide for the Redbox Investor Presentation, dated May 2021. It identifies the SPAC partner as Seaport Global Acquisition Corp. The branding is clean, utilizing the signature Redbox red and white color scheme.
Slide 3: Today’s Presenters
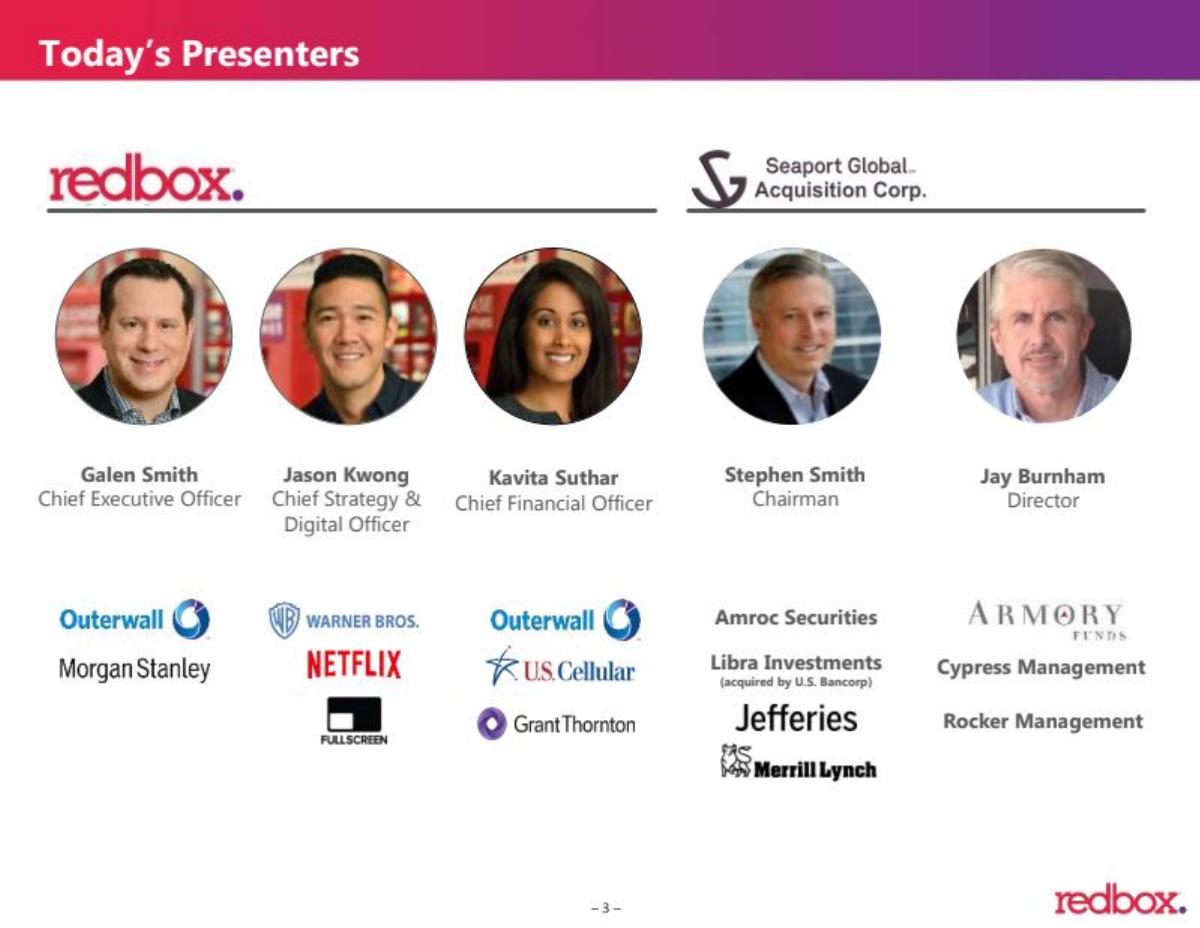
This slide introduces the leadership from both Redbox and Seaport Global. Key figures include Galen Smith (CEO), Jason Kwong (Chief Strategy & Digital Officer), and Kavita Suthar (CFO). The slide emphasizes institutional pedigree, listing former employers such as Morgan Stanley, Outerwall, Warner Bros., Netflix, and Grant Thornton . This is a standard credibility-building slide designed to reassure institutional investors of the team's ability to manage a public transition.
The Investment Opportunity
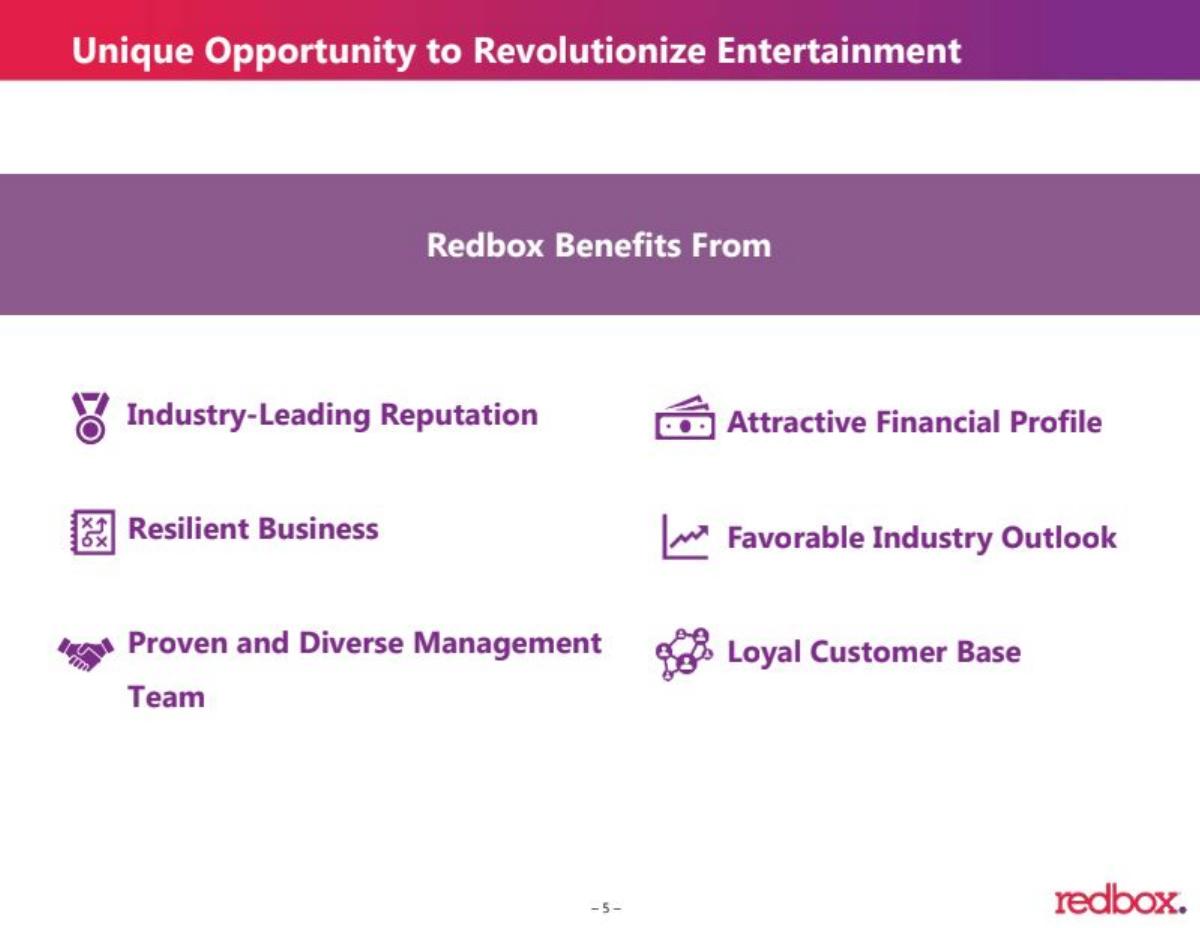
Slide 5: Unique Opportunity to Revolutionize Entertainment
Redbox outlines six core pillars of its value proposition: an industry-leading reputation, a resilient business, a proven management team, an attractive financial profile, a favorable industry outlook, and a loyal customer base. This slide serves as the high-level 'Why Now?' for the investment, though it lacks specific data points, which are reserved for later slides.
Slide 7: Redbox is a Leader in the Entertainment Ecosystem
This is the 'Scale' slide. Redbox highlights its massive physical footprint: 40,000+ kiosks, 150+ retail partners, and 40 million customers . The most striking figure is the 6 billion+ discs rented to date . By visualizing the kiosk network across a map of the United States, Redbox reinforces its dominance in 'middle America' and its role as a destination for affordable new releases.
Slide 9: Differentiated and Underserved Customer Base
Redbox defines its audience as 'Value Conscious Movie Lovers.' Key stats include: 71% of customers identify as 'Deal Hunters' and 58% are heavily engaged in loyalty programs . Crucially, the slide notes that 70% of customers are late adopters of new technology . This is a strategic positioning: Redbox isn't fighting Netflix for the early adopter; it is capturing the massive tail of the market that is just now moving toward digital services.
Slide 11: Redbox Perks Loyalty Program
The loyalty program is presented as the 'center' of the business. With 39 million total members and 13 million active members , Redbox claims that >50% of total rents come from this group. The slide argues that this data-rich environment allows for high-precision content marketing and personalization, which is essential for the digital pivot.
The Digital Transformation Thesis
Slide 13: Digital Transformation Investment Thesis
This slide summarizes the bull case in six points. It highlights 2.25x digital growth in 2020 and a $44 billion TAM for AVOD and SVOD by 2022. It also introduces a key financial efficiency metric: 81.5% Free Cash Flow (FCF) Conversion from the legacy business, which is intended to fund the digital expansion without requiring massive external capital raises.
Slide 15: Cord Cutting Creates an Opportunity
Redbox uses third-party data from SNL Kagan to show the decline of Pay TV (from 70% penetration in 2019 to a projected 48.6% in 2024). The company argues that this 'fragmented billing' and 'content discovery' nightmare for consumers creates a need for an aggregator. Redbox positions its digital platform as the solution for consumers looking for a simplified, aggregated experience.
Slide 17: Multi-Product Consumers Drive Enterprise Value
This is perhaps the most important slide for unit economics. It shows that a 'Physical Rents Only' customer has an annual ARPU of $22 . However, a customer who uses physical rents, Redbox Perks, and On Demand services has an ARPU of $103 . This 4-5x increase in transaction value is the core justification for the digital pivot: the kiosk is a low-cost acquisition tool for a high-value digital relationship. It also notes an 11 percentage point reduction in churn for multi-product users.
Slide 19: AVOD and FLTV Growing Rapidly
Redbox provides evidence of its digital traction. It reports 8 million+ unique devices in the last 12 months and 1 million+ Monthly Active Users (MAU) . The growth metrics are aggressive: 735% annual growth in ad-supported hours and a 19% compound monthly growth rate . This slide aims to prove that Redbox is already a viable player in the streaming space, not just a DVD company with a plan.
Slide 21: Redbox Entertainment Originals
To improve margins and ensure content availability, Redbox has moved into original production. The slide shows 16 titles released to date and 24 more committed , with a target of 36+ releases per year . By owning the content (e.g., 'Shadow in the Cloud', 'Capone'), Redbox can capture more of the value chain and reduce its reliance on major studio release schedules.
Financials and Benchmarking
Slide 23: Financial Snapshot
The financial projections show a 'V-shaped' recovery. Adjusted EBITDA is shown dropping from $196M in 2019 to $114M in 2020 (due to COVID), then projected to hit a low of $101M in 2021 before rebounding to $237M in 2023 . Free Cash Flow follows a similar trajectory, projected to reach $222M by 2023 . These projections rely on the assumption that theatrical content returns to normal levels and digital adoption continues at its current pace.
Slide 25: Appendix Divider
A visual transition slide featuring movie posters for titles like 'Wonder Woman 1984' and 'Tenet,' signaling the move into detailed supporting data.
Slide 27: Public Peer Overview
Redbox positions itself in the center of a Venn diagram. On one side are 'Digital Platform Peers' (Netflix, Roku, Spotify) which have high growth but often lower cash flow. On the other are 'Legacy Platform Peers' (AT&T, Comcast, Disney) which have high cash flow but are losing share. Redbox claims to offer the best of both: the cash flow of a legacy giant with the growth profile of a digital disruptor.
Slide 29: Operational Benchmarking
This slide compares Redbox to its peers on two metrics: 2021-2022E Revenue Growth and LTM Gross Margins. Redbox projects 59% revenue growth , which is higher than the median for both digital (36%) and legacy (5%) peers. Its 60% gross margin is also shown to be superior to the digital peer median of 39% and the legacy peer median of 49%.
Team and Risk Factors
Slide 31: Extraordinary Management Team
A more detailed look at the team. It highlights Mike Chamberlain (COO, formerly of Coinstar), Mike Feldner (CMO, formerly of Walgreens), and Lori Flynn (Content, formerly of Blockbuster). The inclusion of a former Blockbuster executive is a strategic nod to deep industry experience in the rental space.
Slide 33: Lack of Content Impacts Results
This slide is a defensive necessity. It explains why 2020 and 2021 numbers look weak. Theatrical title counts dropped from 140 in 2019 to a significantly lower number in 2020. The bar chart shows that Q1 2021 had only 9 titles compared to 39 in Q1 2019. This 'content gap' is blamed entirely on COVID-19 theatrical delays, framing the current financial state as an anomaly rather than a secular decline.
Slide 35: Non-GAAP Reconciliations
This slide provides the bridge from Net Loss to Adjusted EBITDA. It shows a Net Loss of $90M in 2020 and a projected Net Loss of $113M in 2021 . The adjustments include heavy depreciation ($65M) and interest expenses ($34M), which are typical for a capital-intensive business with debt. It provides the transparency required for a public listing.
Slide 37: Risk Factors
A dense, standard legal disclosure slide. It lists risks including competitive pressure, the secular decline of the physical rental market, inability to obtain digital licenses, and debt obligations. This is a mandatory component of a SPAC deck to protect the company from future litigation.
What Works / What is Missing / What to Copy
What Works
The 'Bridge' Strategy: Redbox does an excellent job of explaining how a 20-year-old kiosk business is actually a competitive advantage for a digital future. By framing the kiosks as a low-cost customer acquisition funnel for 'late adopters,' they create a unique niche that Netflix cannot easily enter. The use of the 'Multi-Product ARPU' slide (Slide 17) is the strongest part of the deck, providing a clear mathematical reason why the digital pivot will be profitable.
What is Missing
Churn Data for Digital: While the deck mentions an 11pp reduction in churn for multi-product users, it does not provide the baseline churn rates for its new AVOD or SVOD services. For a digital transformation story, investors typically want to see cohort analysis or monthly churn figures to judge the 'stickiness' of the new platform. Additionally, the deck lacks a detailed breakdown of the 'Digital' revenue line—it groups AVOD, SVOD, and TVOD together, making it hard to see which specific digital model is driving the most value.
What a Founder Should Copy
The 'Content Gap' Defense: If your business has been negatively impacted by a macro event (like COVID-19), use a slide like Slide 33. By quantifying the external factor (the number of theatrical releases) and showing its direct correlation to your volume, you can argue that your business is fundamentally sound but temporarily suppressed. Also, the 'Public Peer Overview' (Slide 27) is a great way to position a company that doesn't fit neatly into one category; it allows you to claim the valuation multiples of high-growth companies while touting the stability of legacy ones.
Frequently asked questions
- What was the primary goal of the Redbox SPAC deck?
- The primary goal was to facilitate a merger with Seaport Global Acquisition Corp to take Redbox public. The deck aimed to rebrand Redbox from a declining physical DVD rental company into a 'digital transformation' story. It emphasized using the cash flow from 40,000 kiosks to fund the expansion into ad-supported (AVOD) and subscription (SVOD) streaming services, targeting a $44 billion TAM.
- How does Redbox justify its digital pivot given its 'late adopter' customer base?
- Redbox turns a potential weakness into a strength by arguing that 70% of its customers are late adopters. This makes Redbox the 'exclusive' gateway for these users as they finally transition from physical media to streaming. By owning the relationship with 39 million loyalty members, Redbox claims it can migrate these users to digital more efficiently than pure-play streaming competitors.
- What are the key financial metrics highlighted in the presentation?
- The deck focuses on Adjusted EBITDA and Free Cash Flow (FCF). It projects Adjusted EBITDA to rise from $101M in 2021 to $237M in 2023, representing a 28% CAGR. It also highlights an 81.5% FCF conversion rate. Notably, it shows that multi-product customers have an ARPU of $103 compared to just $22 for kiosk-only customers, a 4-5x increase.
- How did COVID-19 impact the Redbox business model according to the deck?
- COVID-19 caused a 'lack of content' because Hollywood studios delayed theatrical releases. Slide 33 shows that theatrical titles dropped from 39 in Q1 2019 to just 5 in Q4 2020. Since Redbox relies on new releases to drive kiosk traffic, this led to a temporary dip in revenue and EBITDA, which the deck argues will reverse as the theatrical slate normalizes in 2022.
- Who are Redbox's primary competitors according to their benchmarking?
- Redbox bifurcates its competition into 'Digital Platform Peers' and 'Legacy Platform Peers.' Digital peers include Roku, Netflix, and CuriosityStream, where Redbox competes on revenue growth. Legacy peers include Comcast, AT&T, and Disney, where Redbox competes on free cash flow generation. The deck positions Redbox as a unique 'hybrid' sitting between these two groups.