LendSquare’s 18-slide deck is a masterclass in visual storytelling and clear value propositioning. By positioning themselves against predatory interest rates—specifically citing competitors like OnDeck and merchant cash advances—they create an immediate 'hero' narrative for the small business owner. The deck highlights a significant market gap ($120B in small business loans) and demonstrates early traction with 45% month-over-month growth in loan requests. While the deck is light on specific revenue models and long-term unit economics, it excels at explaining a complex peer-to-peer lending me…
Key takeaways
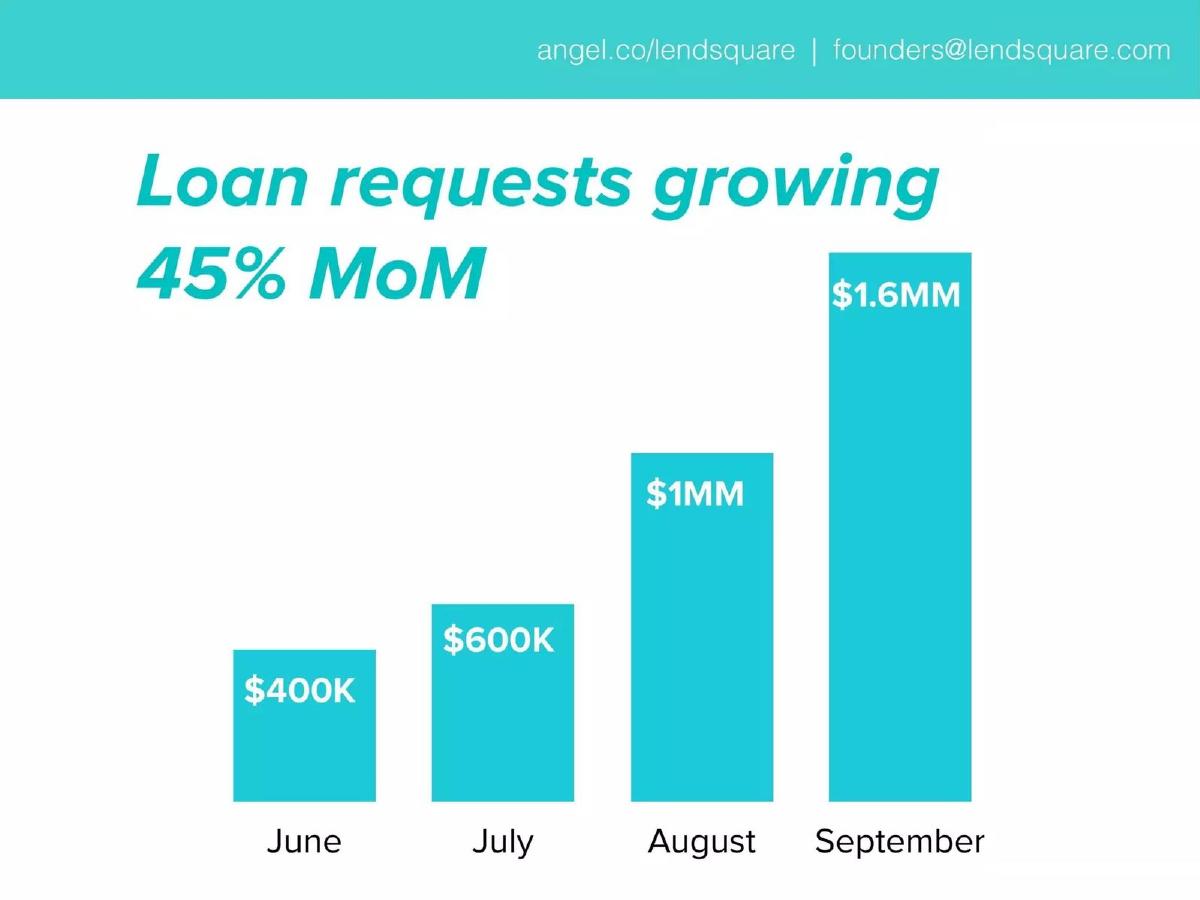
- The deck leads with a strong growth metric, showing loan requests increasing from $400K in June to $1.6MM in September (Slide 2).
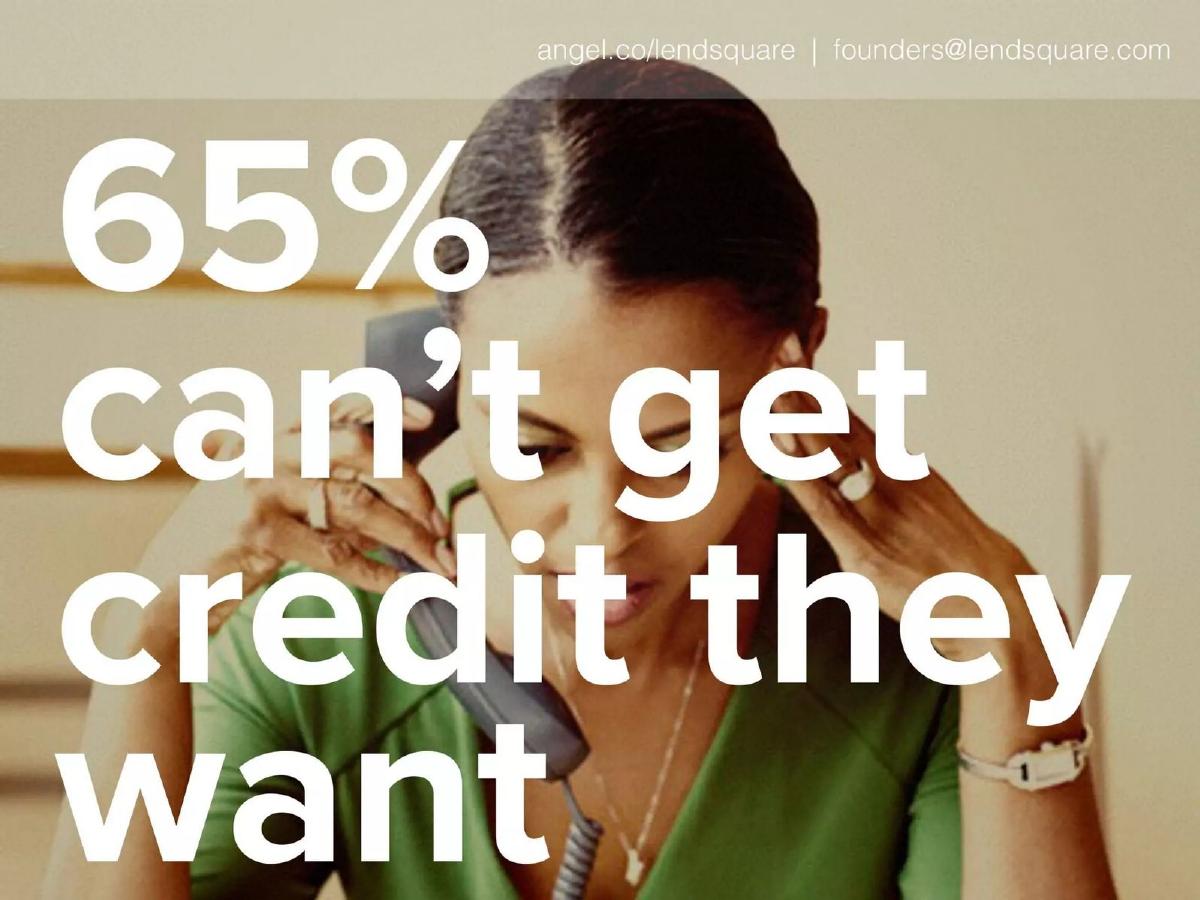
- LendSquare identifies a massive underserved market, stating that 65% of small businesses cannot get the credit they want (Slide 3).
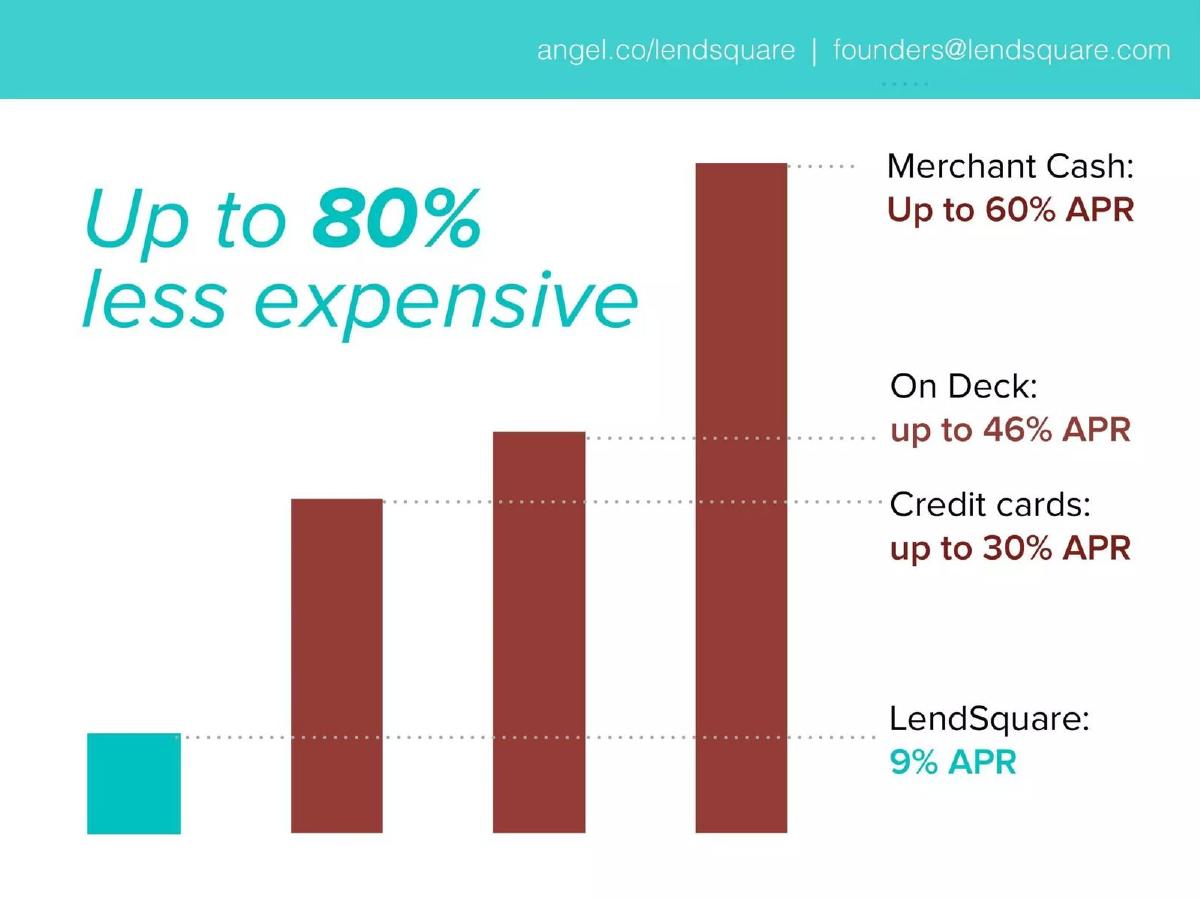
- The competitive landscape is framed entirely around APR, comparing LendSquare's 9% rate to Merchant Cash at 60% and OnDeck at 46% (Slide 6).
- The product is positioned as a community tool, using a case study of 'Max's Take Out' raising $15,000 from 14 backers (Slide 8).
- Viral growth is baked into the product, with the company claiming 7 leads are generated for every loan put on the site (Slide 14).
- The team slide leverages logos from Groupon, Bayer, and the University of Chicago to establish credibility (Slide 16).
- Regulatory and credit risks are addressed proactively by listing partners like Equifax and legal/accounting firms (Slide 17).
- The deck lacks a formal 'Ask' slide, omitting the specific funding amount, valuation, or use of funds (General).
The Vision: Community-Sourced Capital
LendSquare entered the market in 2011 with a simple but radical premise: small businesses should borrow from the people who want them to succeed most—their customers. This teardown examines the 18-slide deck that helped them navigate the seed stage, focusing on how they framed a $120 billion problem as a community opportunity.
Slides 1-2: The Hook and Immediate Traction
Slide 1 is a minimalist title slide. It features the logo and a one-sentence value proposition: "Small businesses borrow money from their customers." This is an excellent example of a 'clear over clever' headline. It tells the investor exactly what the business does before they even see the second slide.
Slide 2 moves straight into traction, which is a bold move for a seed deck. It shows a bar chart of "Loan requests growing 45% MoM." The figures are specific: $400K in June, $600K in July, $1MM in August, and $1.6MM in September. By leading with demand, LendSquare validates that small businesses are desperate for this product before they even explain the mechanics of how it works.
Slides 3-6: Defining the Pain Point and the Price Gap
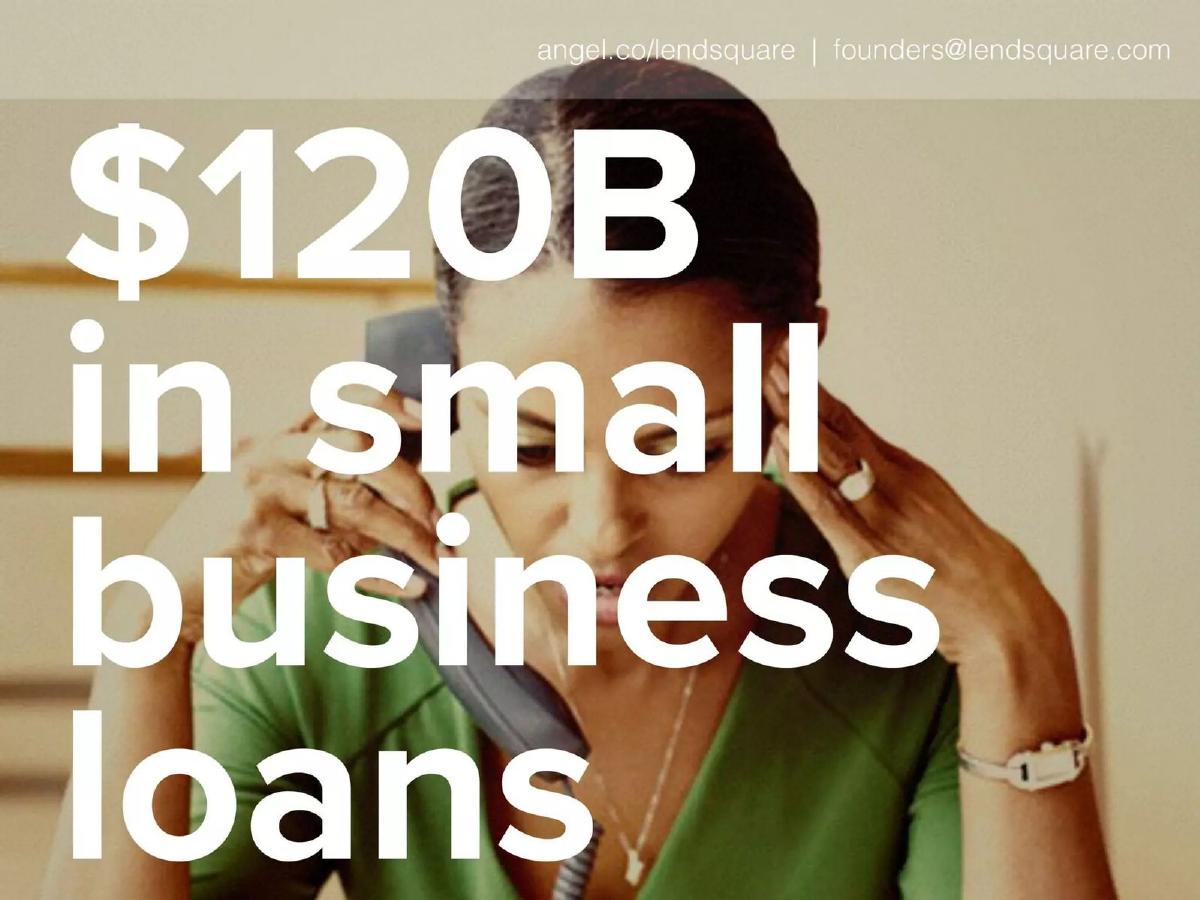
Slide 3 and Slide 4 use high-impact photography and large typography to define the market. Slide 3 claims "65% can't get credit they want," and Slide 4 quantifies the total addressable market at "$120B in small business loans." The use of a frustrated business owner on the phone creates an emotional connection to the data.
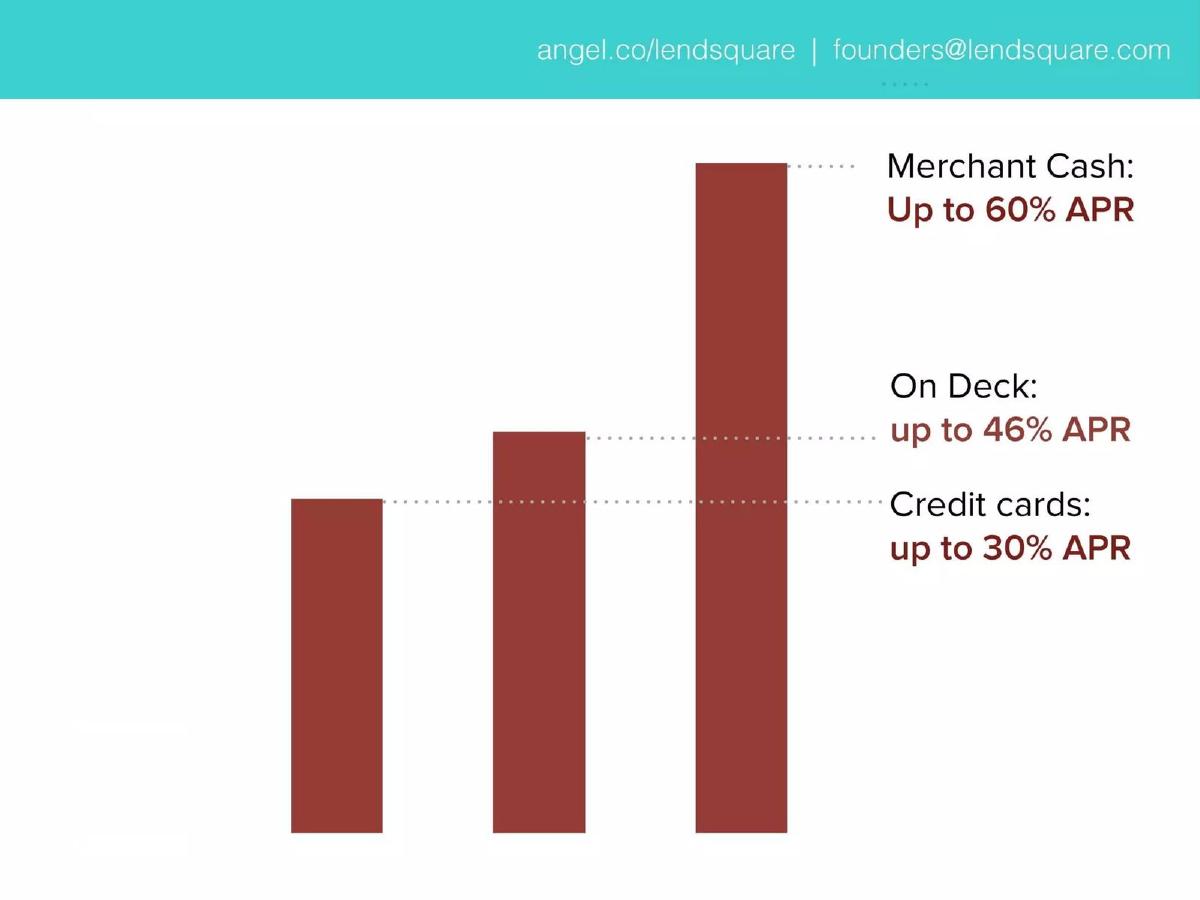
Slide 5 and Slide 6 are the 'villain' slides. They illustrate the current alternatives for small businesses. Slide 5 shows the high APRs of Merchant Cash (60%), OnDeck (46%), and Credit Cards (30%). Slide 6 then introduces the 'hero' metric: LendSquare at a 9% APR. This "Up to 80% less expensive" claim is the core economic driver of the pitch. It suggests that LendSquare isn't just a 'nice' community idea, but a mathematically superior financial product for the borrower.
Slides 7-11: Product Mechanics and User Experience
Slide 7 is a transition slide showing a bustling cafe, setting the scene for the product demo. Slide 8 provides a mockup of a campaign for "Max's Take Out." It shows a $15,000 goal, 102% funding, and 14 backers. This slide is crucial because it proves the concept: a local hot dog stand can successfully raise five figures from a small group of neighbors.
Slide 9 and Slide 10 walk through the lender's perspective. Slide 10 shows a UI for "Let's get started," noting that making a loan takes only a minute or two. It also mentions an "auction" mechanism for interest rates, which is a sophisticated fintech detail hidden in a simple interface. Slide 11 returns to the cafe image, now overlaid with dollar signs, visually representing the flow of community capital back into the business.
Slides 12-15: The Marketing and Growth Engine
Slide 12 focuses on the secondary benefits for the business owner: "Customers engaged for years," "Higher Yelp scores," and "Social media buzz." This argues that a LendSquare loan is also a marketing campaign. Slide 13 shows an iPad at a point-of-sale terminal with a Facebook post, illustrating how the business recruits its own lenders.
Slide 14 provides a key growth metric: "7 leads for every loan we put on the site." This suggests a viral coefficient that would excite any venture investor. If every successful loan brings in seven new potential borrowers, the cost of customer acquisition (CAC) should theoretically trend toward zero. Slide 15 reinforces this with icons for email, likes, and Twitter, emphasizing the "built-in sharing" mentioned later in the deck.
Slides 16-18: Team, Risk, and Conclusion
Slide 16 introduces the team: Sebastian (Product), Jose (Sales), Roy (Engineering), Bryce (Community), and Gina (Design). Rather than long bios, they use logos from previous affiliations: Groupon, Bayer, The University of Chicago, and ZS. This is a standard but effective way to borrow credibility from established brands.
Slide 17 is perhaps the most important slide for a fintech company: Risk. By categorizing "Regulatory Risk" and "Credit Risk" and listing partners like Equifax and the State of Illinois seal, they signal to investors that they are not ignoring the legal complexities of lending. They list professional service firms like Much Shelist and ORBA to show they have 'adults in the room' advising them.
Slide 18 concludes with the tagline: "Loans that pay for themselves. With built-in sharing." It’s a punchy summary of the marketing-plus-finance hybrid model they’ve presented.
What Works in This Deck
The APR Comparison: Slide 6 is the strongest slide in the deck. In fintech, price is often the ultimate disruptor. Showing a 9% rate next to a 60% rate makes the business's success seem inevitable. · Traction First: By putting the $1.6MM in loan requests on Slide 2, they prevent the investor from dismissing the idea as a 'small' or 'lifestyle' business. · Visual Simplicity: The deck uses very little text. It relies on large numbers and clear UI mockups, which makes it easy to digest in a 3-minute first pass. · Proactive Risk Management: Addressing the SEC/regulatory hurdles and credit scoring upfront (Slide 17) builds trust.
What Is Missing
The Revenue Model: The deck never explains how LendSquare makes money. Do they take an origination fee from the business? A spread on the interest? A service fee from the lenders? This is a significant omission for a seed-stage pitch. · The Ask: There is no slide stating how much money they are raising, what the valuation is, or what the specific milestones are for the next round of funding. · Unit Economics: While they mention "7 leads per loan," they don't provide the actual cost to acquire a business or the lifetime value of that customer. · Default Rates: For a lending platform, the most critical metric is the default rate. While they were likely too early to have significant data, a slide on their underwriting criteria or expected loss ratios would have added weight to the credit risk section.
What a Founder Should Copy
The "Villain" Slide: Identify the high-cost, low-efficiency incumbent in your industry and put their metrics (like the 60% APR on Slide 5) in a stark bar chart next to your own. · The Viral Loop Metric: If your product has a built-in growth mechanism, quantify it as simply as LendSquare did on Slide 14 ("7 leads for every loan"). · Contextual UI Mockups: Instead of just showing a screenshot of the app, show the app in the context of the user's life (like the iPad at the cash register on Slide 13). This helps investors visualize the 'how' and 'where' of the product's usage. · Logo Credibility: If you don't have a long track record, use the logos of the universities and companies your team has touched to provide a visual shorthand for talent.
Frequently asked questions
- What was LendSquare's core value proposition?
- LendSquare allowed small businesses to bypass traditional banks and high-interest alternative lenders by borrowing directly from their own customers. This lowered the cost of capital for the business (9% APR vs. 30-60% elsewhere) while providing customers with a way to invest in local businesses they already supported.
- How did the deck demonstrate market demand?
- The deck used two primary data points: a macro statistic stating that 65% of small businesses are denied the credit they seek, and a micro traction metric showing their own platform's loan requests grew 45% month-over-month, reaching $1.6 million in a single month.
- Who were the primary competitors mentioned?
- The deck specifically named OnDeck (up to 46% APR), traditional credit cards (up to 30% APR), and Merchant Cash Advance providers (up to 60% APR). By highlighting these high rates, LendSquare positioned its 9% APR as a disruptive and ethical alternative.
- What was missing from the LendSquare pitch deck?
- The deck is notably missing a financial slide detailing the business's revenue model (how LendSquare makes money from these loans) and a clear 'Ask' slide. There is no mention of how much capital they were raising in 2011 or what the specific milestones for the next 18 months would be.
- How did LendSquare handle the issue of lending risk?
- On Slide 17, they explicitly addressed 'Regulatory Risk' and 'Credit Risk.' They showcased partnerships or service providers like Equifax for credit scoring and various legal/accounting firms to manage the complex regulatory landscape of peer-to-peer lending and community investment.