StackShare’s seed deck is a study in brevity and traction. With only 10 slides, the company avoids the traditional 'problem/solution' narrative in favor of showing a product that is already deeply integrated into the developer ecosystem. The deck relies heavily on social proof, showcasing logos of high-profile users like Airbnb and Dropbox, and backing it up with a 7% week-over-week growth rate in registered engineers. Most impressively, it presents specific B2B conversion data—citing rates as high as 10.71%—to prove the platform's value to SaaS vendors. While it lacks a formal team slide or…
Key takeaways
- The deck uses a minimalist 10-slide structure that focuses almost entirely on traction and product utility.
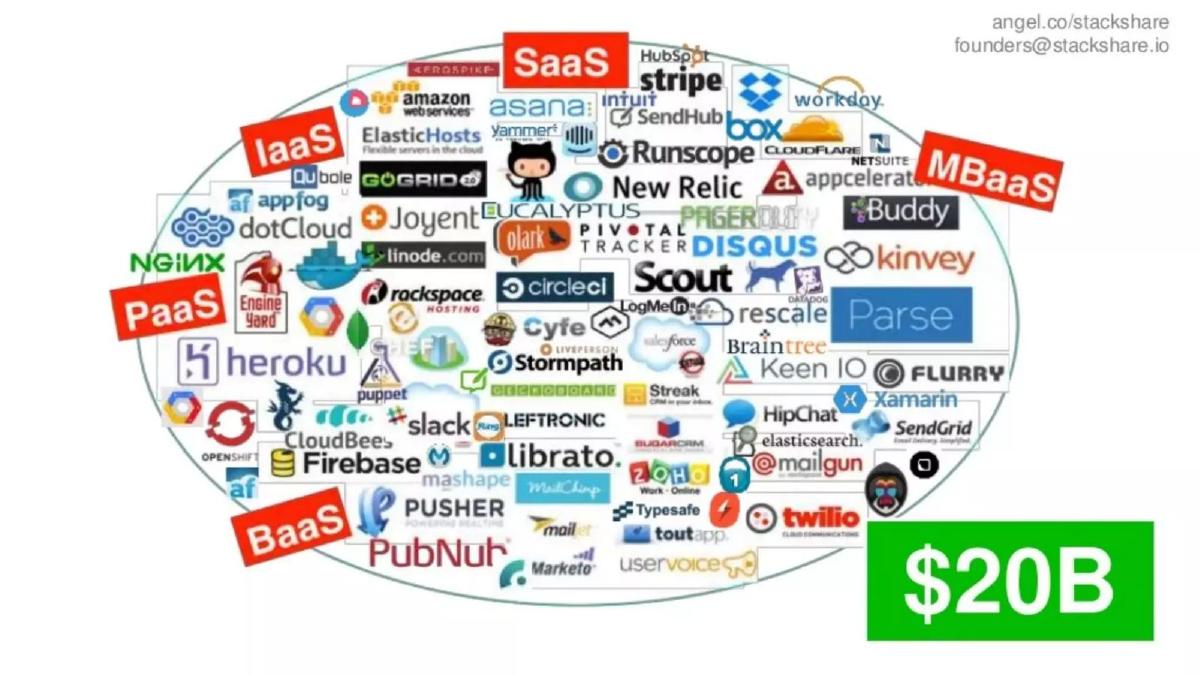
- Slide 3 identifies a $20B market opportunity by visualizing the overwhelming density of the SaaS, IaaS, and PaaS landscape.
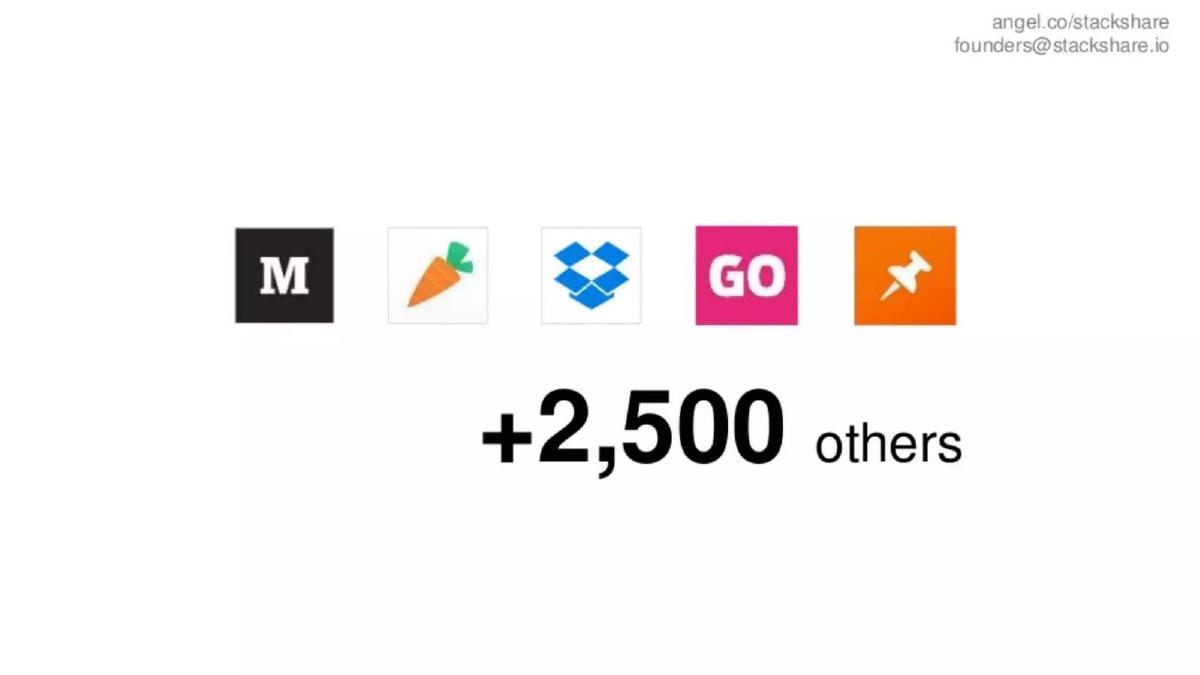
- Social proof is a core pillar, with Slide 5 highlighting over 2,500 companies including Medium, Instacart, and Dropbox.
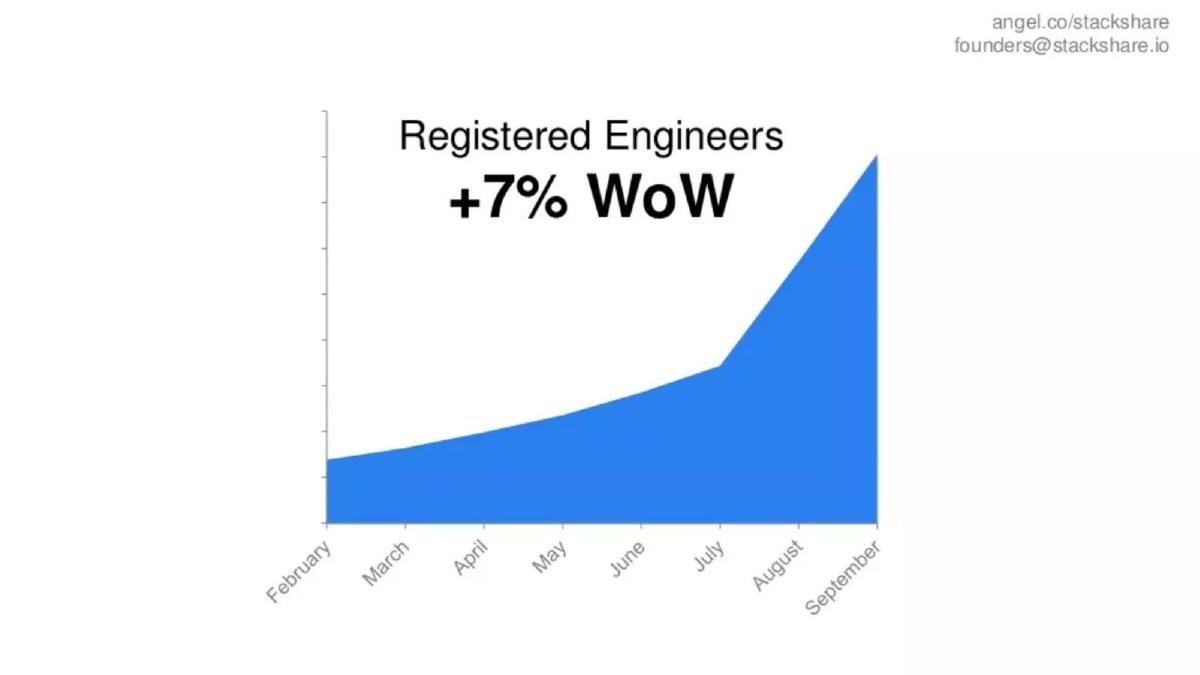
- Growth is quantified on Slide 6 as a consistent +7% week-over-week increase in registered engineers from February to September.
- The platform's value to advertisers is proven on Slide 7 with conversion rates of 8%+ for Keen IO and 10.71% for Codeship.
- Search engine dominance is demonstrated on Slide 8, showing a #1 Google ranking for high-intent developer queries.
- The deck completely omits a team slide, a competition slide, and a specific funding 'ask' or use of proceeds.
- Slide 9 illustrates product virality by showing StackShare embeds on external sites like Glassdoor and LinkedIn profiles.
The Power of Minimalist Traction: The StackShare Seed Deck
StackShare’s 2014 seed deck is a fascinating example of how a startup can leverage community momentum to bypass traditional pitch deck tropes. At just 10 slides, it contains no formal problem statement, no competitive matrix, and no team bios. Instead, it presents a data-driven narrative of a platform that has already become the de facto standard for developer tool discovery. The deck was used to raise $7 million, a significant sum for a seed round at the time, proving that investors value demonstrated utility and growth over theoretical projections.
Introduction and Vision (Slides 1-2)
The deck opens with a clean title slide featuring the StackShare logo and contact information, including an AngelList link. Slide 2 immediately delivers the value proposition: "Discover the best SaaS tools based on who’s already using them and why." This is a concise summary of the platform's utility. It avoids jargon and focuses on the core user behavior—discovery through social proof. By emphasizing the "who" and the "why," StackShare positions itself as a qualitative data source, differentiating it from simple directory sites.
The Market Complexity and Opportunity (Slide 3)
Slide 3 is the only slide that touches on the 'Problem,' though it does so visually. It features a dense cloud of logos representing the SaaS, IaaS, PaaS, and BaaS sectors. Overlaid on this chaos is a large green box stating "$20B." This slide communicates two things simultaneously: the market is incredibly fragmented (making discovery difficult), and the total spend in this category is massive. It sets the stage for StackShare to act as the gatekeeper or the 'curator' of this $20 billion ecosystem.
Product and Social Proof (Slides 4-5)
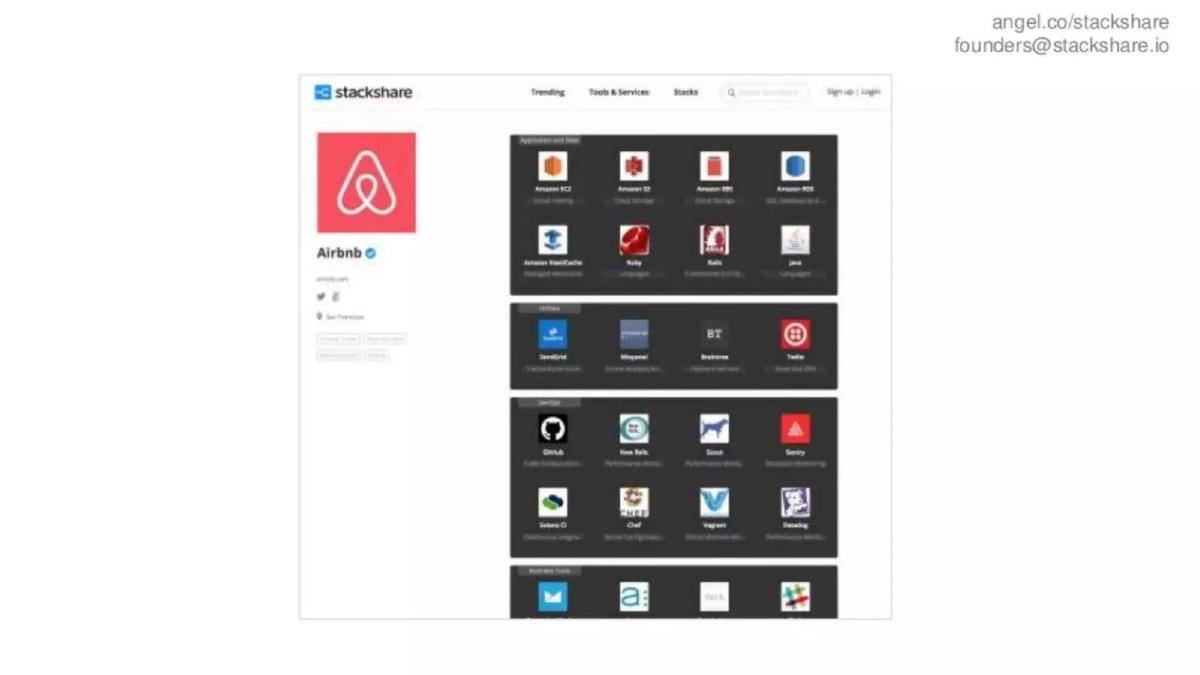
Slide 4 provides a screenshot of the product in action, specifically the Airbnb tech stack page. This is a strategic choice. Airbnb is a 'gold standard' engineering organization; showing their stack on the platform validates StackShare’s relevance to top-tier tech companies. Slide 5 doubles down on this social proof by displaying the logos of Medium, Instacart, Dropbox, GoCardless, and Pinterest, followed by the text "+2,500 others." This informs the investor that the platform isn't just a side project for a few hobbyists, but a tool used by thousands of professional engineering teams.
Growth and Engagement Metrics (Slide 6)
The core of the deck’s 'traction' argument is found on Slide 6. It features a simple area chart showing the growth of "Registered Engineers" from February to September. The headline metric is "+7% WoW" (Week-over-Week). In the world of venture capital, consistent week-over-week growth is the ultimate indicator of product-market fit. By showing a curve that accelerates toward the end of the period, StackShare demonstrates that they have found a repeatable way to acquire their most valuable users: the developers themselves.
Monetization Potential and Performance (Slide 7)
Slide 7 addresses the 'Business Model' without using a spreadsheet. It presents specific conversion data from two partners: "8%+ conversion rate" for Keen IO and "10.71% conversion rate" for Codeship. The slide concludes with a bold claim: "5X-10X better than Google AdWords." This is a powerful statement for an investor. It suggests that StackShare isn't just a community; it's a high-performance marketing engine. If they can convert users at 10% for these tools, their ability to monetize through lead generation or sponsored content is virtually guaranteed.
SEO and Distribution Strategy (Slides 8-9)
Slide 8 shows a Google search for "mailgun vs sendgrid," with the StackShare result highlighted in a red box at the #1 position. The text reads "#1 in Google search results." This proves that the company has a sustainable, organic acquisition channel. Because developers frequently search for tool comparisons, StackShare’s content naturally captures high-intent traffic. Slide 9 expands on this by showing how the product integrates into the broader web. It shows StackShare stacks embedded on Glassdoor and links in LinkedIn profiles. This demonstrates 'virality' and 'stickiness'—the platform is becoming a part of a developer's professional identity and a company's recruiting efforts.
Conclusion and Contact (Slide 10)
The deck ends as simply as it began, with a repeat of the contact information and the AngelList URL. There is no 'Ask' slide detailing how much they are raising or what the valuation is. This suggests that the deck was likely used as a teaser or as part of a process where the terms were already being discussed or were hosted on the AngelList platform mentioned on the slide.
What Works in This Deck
Focus on Traction: The deck is almost entirely composed of evidence. By Slide 7, an investor has seen the product, the users, the growth rate, and the conversion efficiency. This builds a logical momentum that is hard to argue with.
Social Proof: Using Airbnb, Dropbox, and Pinterest logos immediately elevates the perceived value of the platform. It answers the question "Does anyone actually care about this?" with a resounding yes.
Specific B2B Metrics: Most community-based startups struggle to explain how they will make money. By providing exact conversion percentages (10.71%), StackShare removes the guesswork from their revenue potential.
Visual Simplicity: There are very few words in this deck. It relies on screenshots and large-format numbers, which makes it easy to digest in a few minutes.
What is Missing from This Deck
Team Slide: This is the most glaring omission. Investors typically bet on the founders at the seed stage. The lack of a team slide suggests the founders were either already well-known to the target investors or were relying entirely on the strength of the data.
Competition: There is no mention of G2, Capterra, or even GitHub’s own features. A slide addressing why StackShare wins against these incumbents would have strengthened the 'Moat' argument.
Financials and Ask: There is no information on the current burn rate, projected revenue, or the specific amount of capital being sought. While this might be appropriate for a deck shared via a platform like AngelList, it leaves the 'business' side of the startup largely to the imagination.
Unit Economics: While conversion rates are high, the deck doesn't mention the Cost Per Acquisition (CPA) or the Lifetime Value (LTV) of a user, which are critical for scaling a $7 million investment.
What a Founder Should Copy
The 'Comparison' Slide: Slide 7, which compares StackShare’s performance to Google AdWords, is brilliant. If your product performs a function better than a well-known industry standard, quantify that difference and put it in a box. It is the most effective way to communicate value.
The SEO Proof: If your growth is organic, show the Google search results. It is much more convincing to see a screenshot of a #1 ranking than to read a bullet point saying "We have good SEO."
The Growth Curve: Slide 6 is a perfect example of how to present a growth chart. It uses a clear time frame (February to September) and a single, powerful headline metric (+7% WoW). Don't clutter your growth slide with multiple lines; pick the one that matters most and make it the hero.
The Embed Strategy: Showing how your product lives outside of your own URL (Slide 9) is a great way to demonstrate a 'network effect.' If other platforms are using your data or your widgets, it proves that you are becoming infrastructure, not just a destination.
Frequently asked questions
- Why did StackShare omit a team slide in this deck?
- While unusual for a seed round, the omission suggests the founders believed the product's organic traction and community adoption were the primary selling points. In 2014, StackShare was already a known entity in the developer community. By focusing on the +7% week-over-week growth and high conversion rates, they shifted the investor's focus from 'who is building this' to 'look at how fast this is growing.'
- How does the deck justify the $20B market size mentioned on Slide 3?
- The deck uses a visual 'logo cloud' to represent the fragmented SaaS, IaaS, and PaaS markets. The $20B figure is presented as a total addressable market for these services. The implication is that as the number of tools grows, the need for a discovery and comparison platform like StackShare becomes a multi-billion dollar necessity for the vendors trying to reach those developers.
- What is the significance of the conversion rates on Slide 7?
- These metrics are the 'smoking gun' for StackShare's business model. By showing that they achieve 5X-10X better conversion than Google AdWords, they prove to investors that they aren't just a community site, but a high-intent marketing channel. A 10.71% conversion rate for a technical product like Codeship is exceptionally high, signaling massive potential for lead generation revenue.
- How does Slide 9 demonstrate the 'network effect' of the product?
- Slide 9 shows StackShare widgets and links embedded on Glassdoor company pages and individual LinkedIn profiles. This demonstrates that the 'stack' has become a professional standard for developers. When a company displays its stack on a recruiting site, it drives free traffic back to StackShare, creating a low-cost acquisition loop that investors find highly attractive.
- Is a 10-slide deck enough to raise $7 million?
- In this case, yes. The deck follows the 'show, don't tell' rule. Instead of explaining why developers need help, it shows the #1 Google search results and the 2,500+ companies already using it. When traction is this clear and growth is consistent (7% WoW), founders can afford to be brief because the data answers the most difficult questions regarding product-market fit.