Statsbot’s 2015 seed deck is a quintessential example of 'traction speaks louder than words.' Raising $1.9 million, the company capitalized on the early Slack ecosystem boom by offering a natural language interface for business data. The deck is remarkably light on text, relying instead on clear visualizations of the problem—data fragmentation—and the solution—a centralized chat bot. By the time the investor reaches the team slide, they have already seen a 10x growth in active companies and a 60x growth in active users over a ten-month period. While it lacks a formal 'Ask' slide or detailed f…
Key takeaways
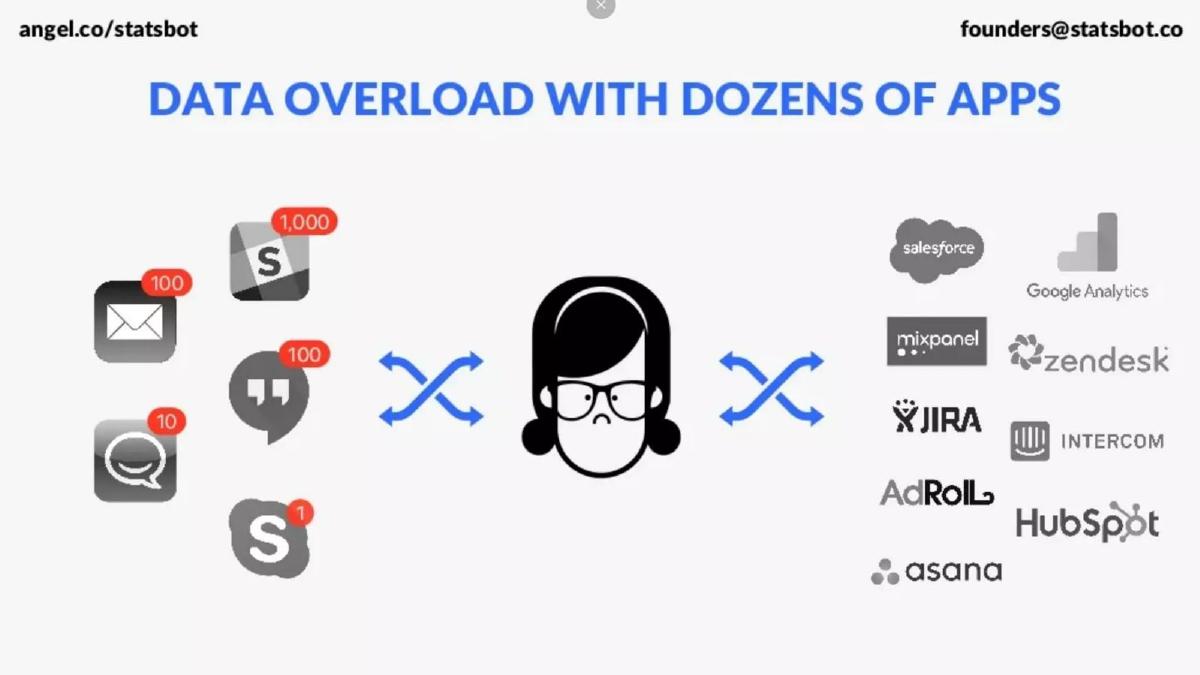
- The deck identifies a specific pain point: 'Data overload with dozens of apps' on slide 2.
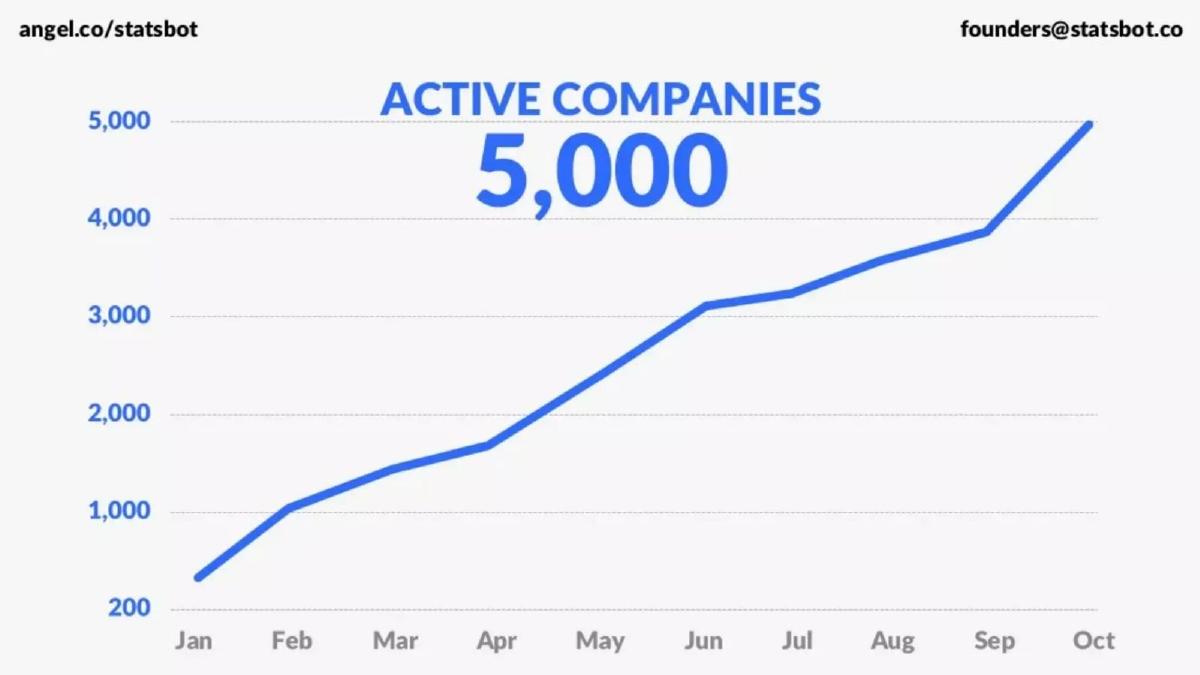
- Traction is the core of the pitch, showing a jump from 200 to 5,000 active companies between January and October on slide 6.
- User growth is even more aggressive, scaling from 300 to 25,000 active users in the same ten-month window as shown on slide 7.
- Revenue is addressed via a simple bar chart showing ARR reaching $60k by October on slide 8.
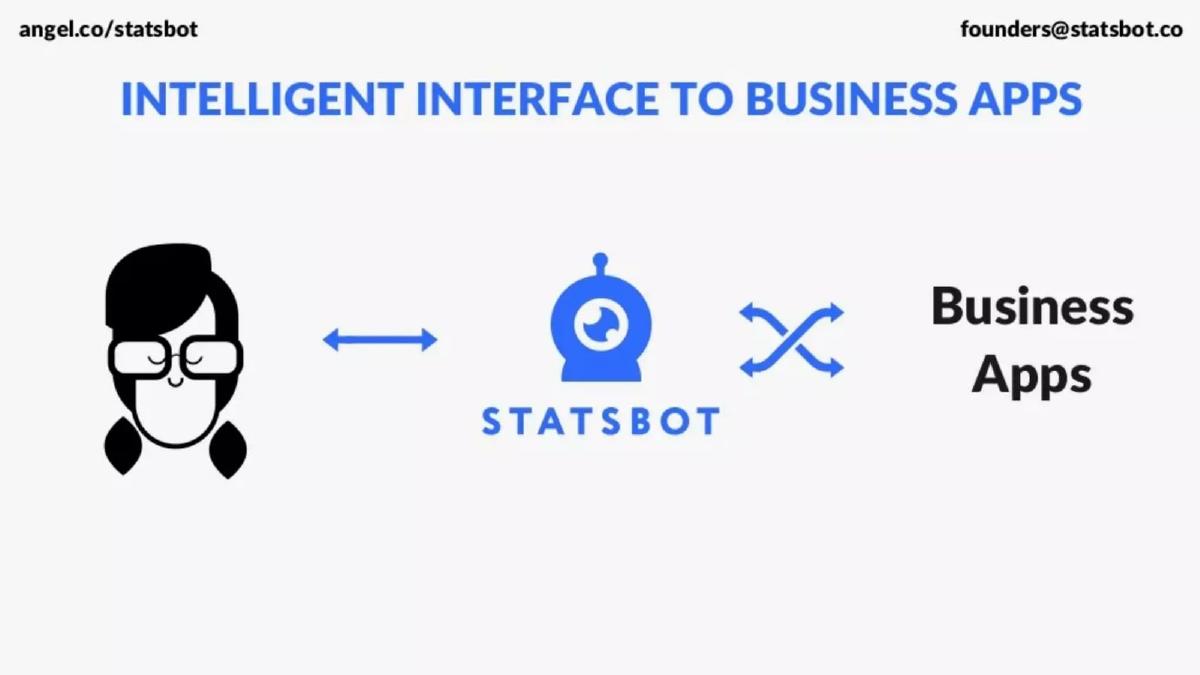
- The product is positioned as an 'Intelligent Interface' that sits between the user and existing business apps on slide 3.
- The deck highlights a deep integration strategy, listing 10 major platforms including Salesforce, Google Analytics, and Mixpanel on slide 9.
- Social proof is established through a 'Selected Customers' slide featuring brands like TED and Fast Company on slide 10.
- The founders emphasize their long-term working relationship of 10 years and shared educational background on slide 11.
The Statsbot Seed Deck: Dominating the Slack Ecosystem
Statsbot’s 2015 seed deck is a lean, 12-slide presentation that helped the company raise $1.9 million. At the time, Slack was the fastest-growing enterprise software in history, and Statsbot positioned itself as the premier data layer for that ecosystem. The deck is a masterclass in visual storytelling, using minimal text to convey a massive amount of growth momentum. It bypasses traditional market sizing and competitive analysis to focus entirely on the fact that users were flocking to the platform at an exponential rate.
The Hook: Problem and Solution (Slides 1-3)
Slide 1: Title The deck opens with the Statsbot logo and a background of faint technical sketches (charts, clipboards, rulers). It includes contact information and a link to their AngelList profile in the corners, a common practice for decks distributed through investor networks.
Slide 2: Data Overload with Dozens of Apps This is the problem slide. It uses a central 'sad' avatar surrounded by two groups of icons. On the left are communication tools like Slack, Skype, and Email, showing high notification counts (e.g., 1,000 on Slack). On the right are data silos: Salesforce, Google Analytics, Mixpanel, Zendesk, JIRA, Intercom, AdRoll, HubSpot, and Asana. The visual message is clear: the user is overwhelmed by the friction of switching between these apps to find data.
Slide 3: Intelligent Interface to Business Apps The solution is presented as a simplification. The 'sad' avatar is now 'happy,' and the chaotic web of apps is replaced by a single blue arrow pointing to the Statsbot logo. Statsbot acts as the intermediary, or the 'Intelligent Interface,' that talks to the business apps so the user doesn't have to.
Product in Action (Slides 4-5)
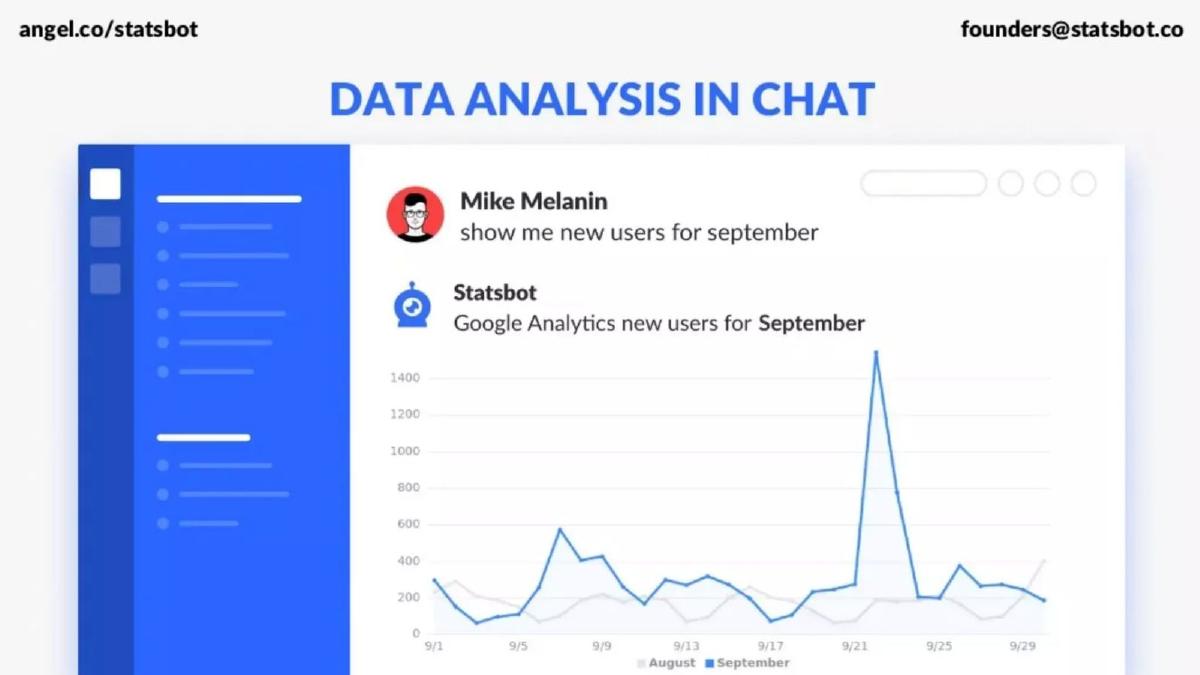
Slide 4: Data Analysis in Chat This slide provides a high-fidelity mockup of the product. A user named 'Mike Melanin' asks a natural language question: 'show me new users for september.' Statsbot responds instantly with a Google Analytics chart comparing August and September data. This demonstrates the core value proposition: natural language processing (NLP) applied to business intelligence.
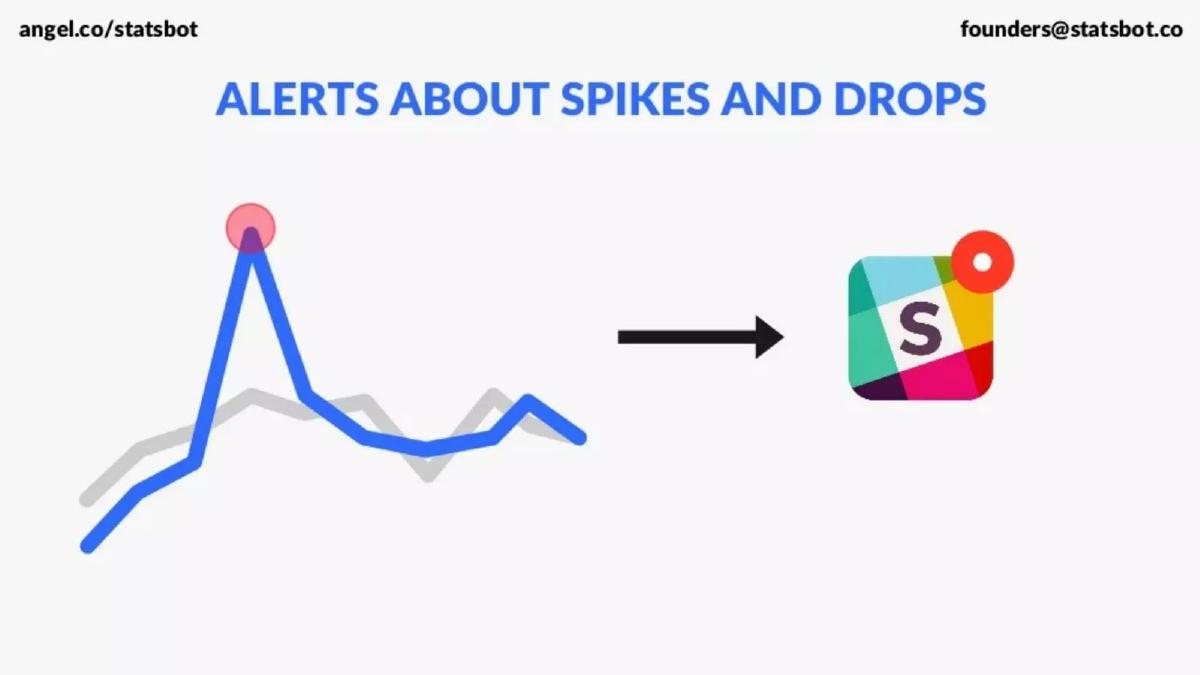
Slide 5: Alerts About Spikes and Drops Beyond reactive queries, the deck shows proactive utility. A chart with a red highlighted spike leads to a Slack notification icon. This illustrates the 'push' side of the product—automated anomaly detection that keeps teams informed without them having to ask.
The Traction Engine (Slides 6-8)
Slide 6: Active Companies (5,000) This is the first of three heavy-hitting traction slides. It shows a line graph starting at 200 companies in January and climbing steadily to 5,000 by October. The growth is consistent and shows no signs of plateauing.
Slide 7: Active Users (25,000) The user growth chart is even more aggressive than the company growth chart. Starting at 300 users in January, it hits 25,000 by October. The curve shows an upward inflection point around June/July, suggesting that the product hit a viral loop or benefited from a specific platform feature release on Slack.
Slide 8: ARR ($60k) Revenue is the final piece of the traction puzzle. The deck shows a bar chart for August, September, and October. In just three months, the Annual Recurring Revenue (ARR) grew from approximately $18k to $60k. This proves that not only are people using the bot, but they are also willing to pay for it.
Ecosystem and Social Proof (Slides 9-10)
Slide 9: Integrations & Partners To show the breadth of the platform, Statsbot lists its integrations. Google Analytics, Mixpanel, and Salesforce are shown as live, while Bitly, Chartbeat, Keen IO, AppsFlyer, Facebook Insights, Intercom, and New Relic are marked as 'beta.' The slide concludes with a note about 'Opening API for data providers,' signaling a move toward becoming a platform rather than just a tool.
Slide 10: Selected Customers The company displays logos of recognizable brands to build trust. These include Fast Company, Galvanize, Circle, TED, Compose, Owler, Daniel Wellington, and Koreaboo. For a seed-stage startup, having TED and Fast Company as users is a significant validation of the product's utility in professional environments.
The Team and The Close (Slides 11-12)
Slide 11: Team The team slide features three founders: Artyom (CEO), Pavel (CTO / PhD CS), and Mike (CPO). Two key bullets are used to establish their 'founder-market fit': they have been working together for 10 years and are all alumni of Bauman Technical University. This highlights technical depth and long-term stability.
Slide 12: Summary The final slide serves as a punchy executive summary. It reiterates three core facts: '#1 enterprise bot in Slack,' '25,000 WAU' (Weekly Active Users), and '20% weekly MRR growth.' It also displays logos for 500 Startups, Betaworks, and The Cherning Group, indicating existing institutional backing or participation in prestigious accelerators.
What Works in the Statsbot Deck
The primary strength of this deck is its unwavering focus on traction . By dedicating three consecutive slides (6, 7, and 8) to growth metrics, the founders make it very difficult for an investor to argue with the product's necessity. The charts are clean, the numbers are large, and the timeframes are recent.
The visual simplicity is also a major asset. In 2015, the concept of a 'bot' was still relatively new to many investors. Instead of explaining the underlying NLP architecture or database connectors, Statsbot showed a 'sad' person becoming 'happy' by using a chat interface. This high-level abstraction allows the investor to focus on the business results rather than getting bogged down in technical implementation details.
Finally, the platform alignment is brilliant. By explicitly stating they are the '#1 enterprise bot in Slack' (Slide 12), they hitched their wagon to the fastest-growing enterprise platform of the decade. Investors looking for 'the next big thing' in the Slack ecosystem would have seen Statsbot as the clear leader in the analytics category.
What is Missing from the Statsbot Deck
The Ask: There is no slide detailing how much money they are raising, what the valuation expectations are, or how the funds will be allocated. While this information is often shared in a follow-up email or a separate document, its absence in the main deck leaves the narrative unfinished.
Unit Economics: While the deck shows $60k ARR, it says nothing about Customer Acquisition Cost (CAC) or Lifetime Value (LTV). Given that they were growing on the Slack App Directory, one could assume CAC was low, but investors usually want to see the math behind the growth sustainability.
Market Size (TAM): The deck assumes the investor already understands that 'data analytics' is a massive market. There is no attempt to quantify the total addressable market or explain how Statsbot might expand beyond the Slack ecosystem into other chat platforms like Microsoft Teams or Telegram.
Competitive Landscape: Statsbot ignores competitors entirely. In 2015, there were other bots and traditional BI tools (like Looker or Tableau) that could be seen as threats. A 'Why We Win' slide would have strengthened the case for their long-term defensibility.
What a Founder Should Copy
Use 'Traction Slides' as the Heart of the Deck: If your growth looks like Slides 6 and 7, make them the centerpiece. Don't hide your best metrics at the end of the deck. Statsbot puts their growth charts right in the middle to build momentum before the final close.
Simplify the Problem/Solution: Avoid 'wall of text' slides. Slide 2 and 3 of this deck are perfect examples of how to communicate a complex pain point (app fragmentation) and a simple solution (a unified interface) using only icons and basic illustrations.
Highlight Team Longevity: If you have worked with your co-founders for a long time, say so. The 'Working together 10 years' bullet on Slide 11 is a powerful signal to investors that the team won't implode under the stress of scaling.
Leverage Platform Dominance: If you are building on top of a platform (Slack, Shopify, Salesforce), find a way to claim a '#1' position in a specific niche. It creates a 'winner-take-all' narrative that is very attractive to venture capitalists.
Frequently asked questions
- What was the primary goal of the Statsbot pitch deck?
- The primary goal was to demonstrate rapid adoption within the Slack ecosystem to secure seed funding. By showing a 25,000-user base and $60k ARR within less than a year of operation, the deck aimed to prove product-market fit and the scalability of a bot-based interface for data analytics.
- How does the deck handle the 'Problem' and 'Solution' sections?
- Statsbot uses a visual approach rather than text-heavy slides. Slide 2 uses icons of common apps (Salesforce, Zendesk, etc.) and a 'sad' user avatar to represent data overload. Slide 3 replaces the chaos with the Statsbot logo, positioning the bot as a single, intelligent gateway that simplifies the user's interaction with their data stack.
- What metrics are most prominent in this 2015 seed deck?
- The deck focuses on three main pillars of traction: Active Companies (5,000), Active Users (25,000), and Annual Recurring Revenue ($60,000). Notably, slide 12 highlights a '20% weekly MRR growth' rate, which is an exceptionally high velocity designed to create a sense of urgency for investors.
- Is there a competitive analysis or market size slide?
- No. The deck completely omits a traditional competitive landscape and TAM/SAM/SOM analysis. It relies on the assumption that the 'Business Apps' market is self-evidently large and that their unique 'chat interface' approach is a category-defining solution that doesn't require a direct comparison to legacy BI tools.
- Who were the key team members presented in the deck?
- The team consists of three founders: Artyom (CEO), Pavel (CTO / PhD CS), and Mike (CPO). The deck emphasizes their technical pedigree as Bauman Technical University alumni and their history of working together for 10 years, which mitigates 'founder conflict' risk for seed investors.