Mars Reel’s deck is a minimalist, high-impact presentation that prioritizes momentum over mechanics. With only 8 slides, the company successfully communicated a massive market opportunity by contrasting their young audience (ages 13-24) against legacy media giants like ESPN (ages 30-38). The deck leans heavily on a 'hockey stick' growth chart showing a jump from 500,000 to 18 million monthly views in just five months. While it lacks traditional sections like a business model, product roadmap, or a specific financial ask, the sheer weight of its social engagement metrics and the pedigree of it…
Key takeaways
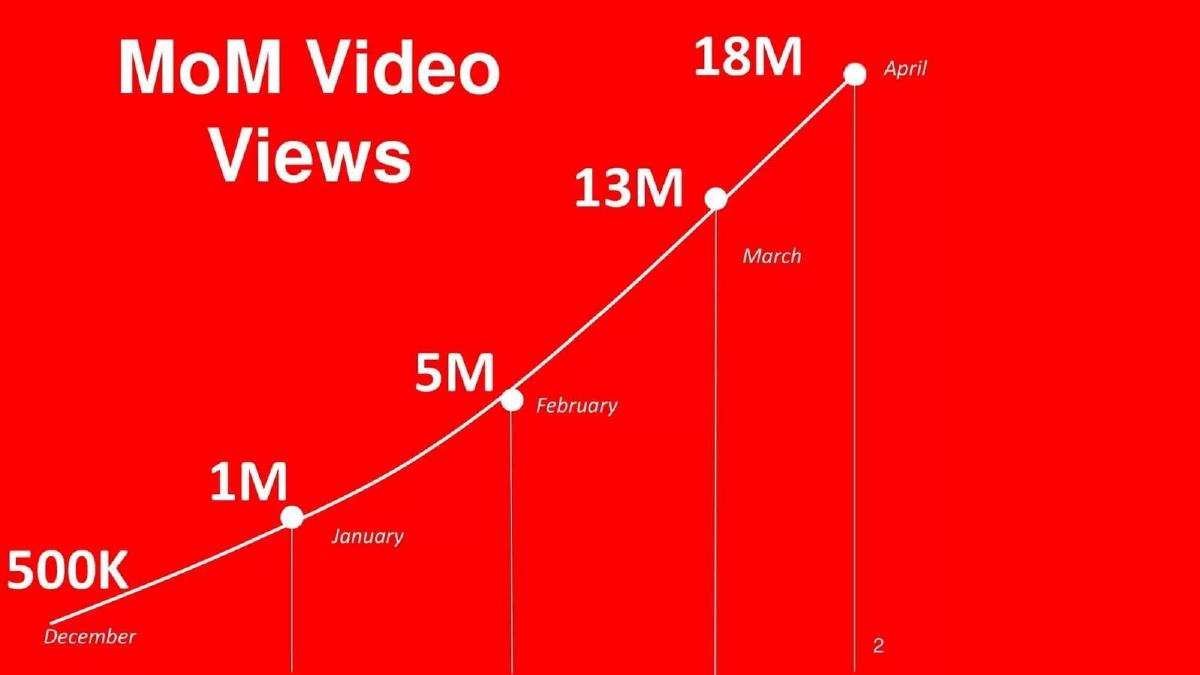
- The deck showcases a rapid growth trajectory from 500K views in December to 18M views in April (Slide 2).
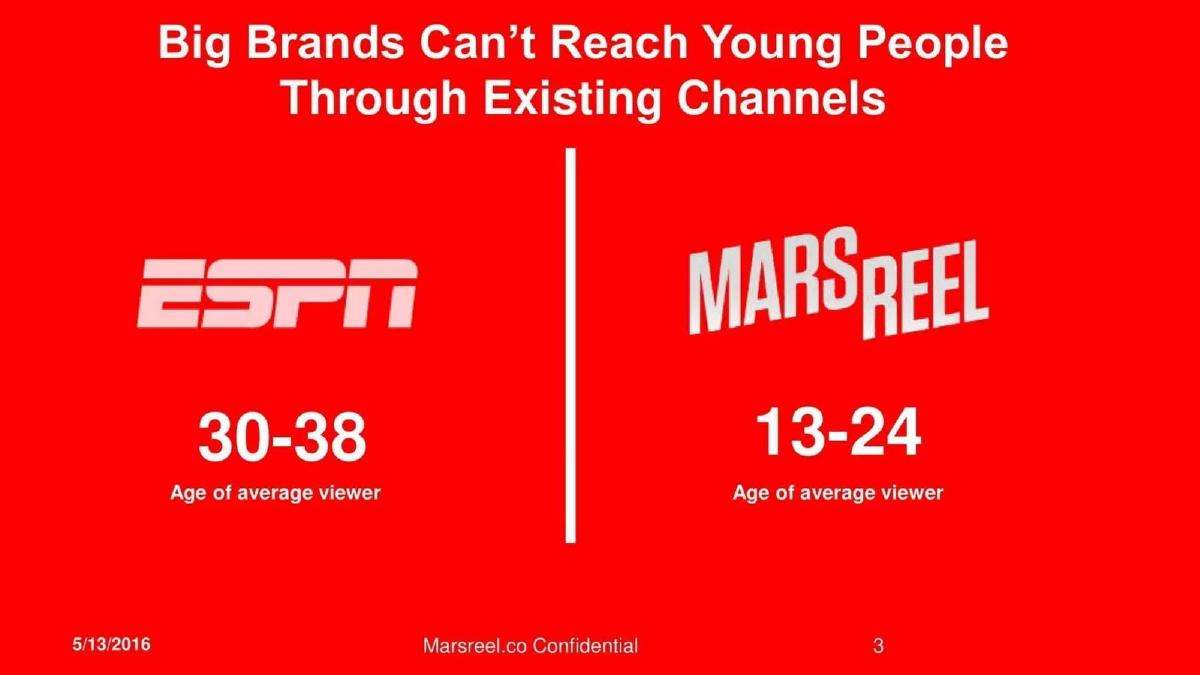
- Mars Reel positions itself as the solution for brands that cannot reach the 13-24 demographic through legacy channels like ESPN (Slide 3).
- Engagement depth is highlighted by a metric showing users spend 1:30 minutes watching a 40-second video (Slide 4).
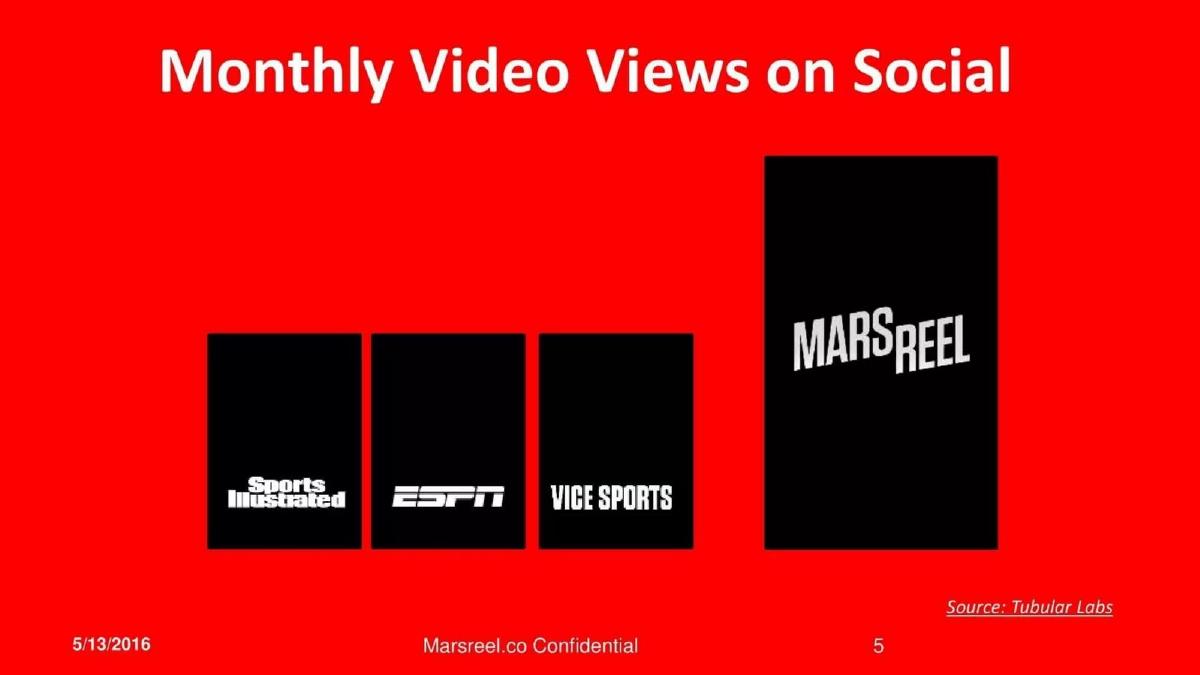
- The company claims higher monthly social video views than Sports Illustrated, ESPN, and Vice Sports (Slide 5).
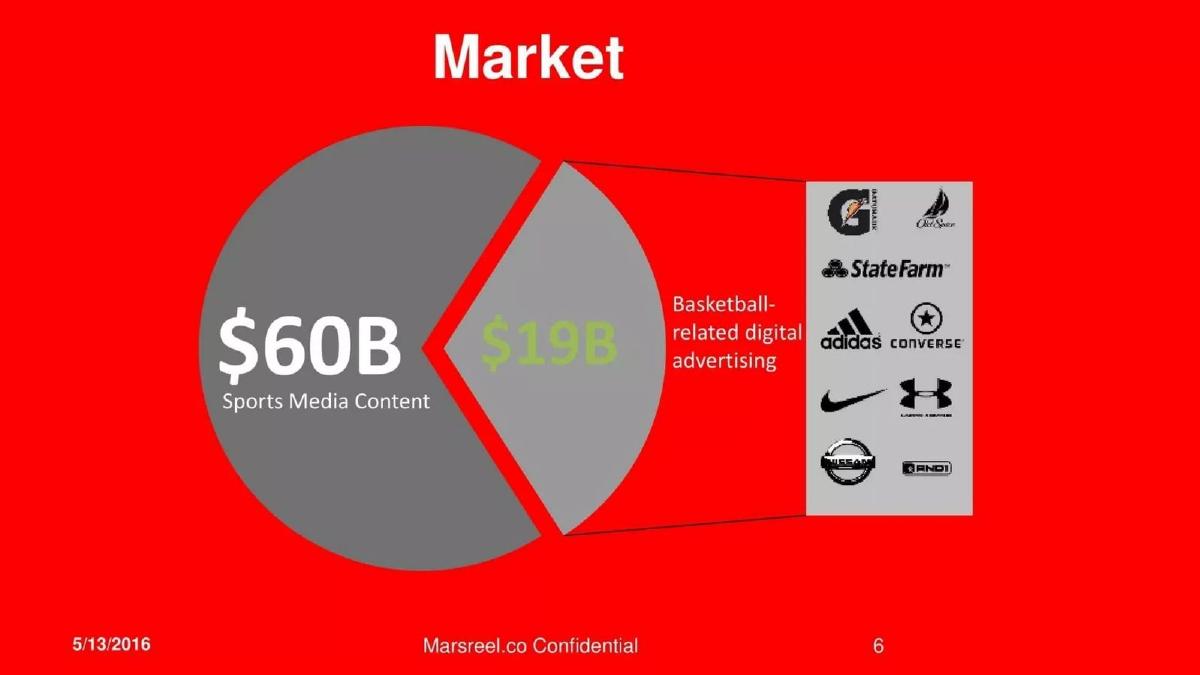
- The total addressable market for sports media content is valued at $60 billion, with $19 billion specifically in basketball-related digital advertising (Slide 6).
- The team and investor slide leverages logos from Ernst & Young, Intel, Akamai, NBA, and DraftKings for credibility (Slide 7).
- The deck completely omits a business model, revenue figures, or a specific funding ask.
- Visual identity is consistent, using a bold red and white color palette across all slides to mirror the brand's energy.
The Power of a Traction-First Narrative
The Mars Reel pitch deck is a fascinating example of how a startup can leverage explosive growth to bypass traditional deck requirements. At only 8 slides, it ignores the standard 'Problem/Solution/Product' framework in favor of a 'Traction/Demographic/Market' narrative. Founded in 2010, the company waited until it had a massive audience before presenting this specific deck in 2016. The result is a presentation that feels less like a plea for capital and more like an invitation to join a moving train.
Slides 1-2: The Hook and the Hockey Stick
Slide 1 is a standard title slide, but it establishes the brand's visual identity immediately. The tagline 'Sports Network for the Mobile Generation' is a precise positioning statement. It tells the investor exactly what the company is (a network) and who it is for (mobile users), immediately differentiating it from traditional cable television.
Slide 2 is the most important slide in the deck. It displays 'MoM Video Views' with a clear, upward-sloping line. The numbers are staggering: starting at 500K in December and reaching 18M by April. This is the 'hockey stick' growth every VC looks for. By placing this as the second slide, Mars Reel eliminates the need to explain why their content is good; the numbers prove that the market has already decided it is.
Slides 3-5: The Competitive Edge and Engagement
Slide 3 addresses the 'Why Now?' and the competitive landscape. By pitting themselves directly against ESPN, they frame the opportunity as a generational shift. The data point is simple: ESPN's average viewer is 30-38, while Mars Reel's is 13-24. This slide identifies a massive gap in the market—legacy media is aging out, and Mars Reel is capturing the replacement demographic.
Slide 4 moves from reach to depth. It claims that users spend an average of 1:30 watching a 40-second video. This is a critical distinction in the world of social media metrics. Total views can be 'vanity metrics,' but a 225% watch-time-to-video-length ratio suggests that the content is being rewatched or shared intensely. It proves the audience isn't just seeing the content; they are obsessed with it.
Slide 5 uses a bar chart to show 'Monthly Video Views on Social.' It places Mars Reel next to Sports Illustrated, ESPN, and Vice Sports. According to the chart, Mars Reel's bar is significantly taller than all three competitors. While the slide cites 'Tubular Labs' as the source, it doesn't provide the exact numbers for the competitors, relying instead on the visual impact of the larger bar to convey dominance.
Slides 6-8: Market Size and Social Proof
Slide 6 defines the market. It uses a pie chart to show a $60B Sports Media Content market, with a $19B slice dedicated to 'Basketball-related digital advertising.' To the right, it lists logos of potential or current partners, including Nike, Adidas, Under Armour, and Gatorade. This slide transitions the deck from 'we have views' to 'we have a multi-billion dollar opportunity.'
Slide 7 covers the Team and Investors. Interestingly, there are no bullet points about past exits or degrees. Instead, the slide relies on headshots and high-authority logos. The team is associated with EY, Intel, and Akamai. The investor section is even more impressive, featuring the NBA and DraftKings logos. This is a 'trust' slide designed to lower the perceived risk for new investors.
Slide 8 is a simple photo of the two founders, Brandon and Bradley Deyo, standing in front of a 500 Startups (500.co) backdrop. This serves as a final piece of social proof, confirming their participation in a world-renowned accelerator program and putting faces to the names behind the metrics.
What Works in the Mars Reel Deck
The primary strength of this deck is its brevity and focus . The founders knew their strongest asset was their growth rate, and they didn't clutter the deck with unnecessary details that might distract from that. The red-and-white color scheme is aggressive and energetic, matching the 'high-intensity' nature of high school sports highlights. By focusing on the 13-24 age demographic, they created a 'must-buy' scenario for investors who are worried about the decline of traditional cable sports viewership.
What is Missing
The omissions in this deck are significant and would likely be a red flag for a less 'hot' startup. There is no business model slide . While the market slide hints at advertising, the deck never explains how Mars Reel actually makes money. Is it through pre-roll ads? Branded content? Licensing? The catalogue listing mentions an apparel brand, 'The Future is on Mars®,' but that is nowhere to be found in these slides. Furthermore, there is no 'Ask' slide . We know from the catalogue that they raised $4.8M, but the deck doesn't specify how much they were looking for or how they intended to spend the capital. Finally, there is a total lack of unit economics —we don't know what it costs them to acquire a viewer or produce a minute of content.
What a Founder Should Copy
Founders should emulate the comparative positioning found on Slide 3. Instead of listing fifty features, Mars Reel chose one metric (age) that their biggest competitor couldn't easily change. This makes the 'Problem' feel urgent and the 'Solution' feel inevitable. Additionally, the use of third-party validation (Tubular Labs on Slide 5) is a great way to make bold claims feel objective. If you have a 'hockey stick' growth chart like the one on Slide 2, lead with it. In fundraising, momentum is often more persuasive than a detailed five-year financial projection.
Final Analysis
Mars Reel’s deck is a 'momentum play.' It is designed for a specific moment in time when social video was exploding and traditional media was scrambling to reach Gen Z. While it lacks the structural rigor of a traditional Series A deck, its 8 slides successfully communicate three vital things: we are growing at light speed, we own the demographic you can't reach, and the biggest names in sports already trust us. For a Seed round, that is often enough.
Frequently asked questions
- How did Mars Reel raise $4.8M with only 8 slides?
- Mars Reel focused on the one metric that matters most to media investors: attention. By showing an 18x growth in monthly video views over five months and proving they owned a demographic (13-24) that ESPN was losing, they made a compelling case for market dominance. The brevity of the deck suggests it was used as a teaser or a high-level presentation for investors who were already familiar with the founders or the space.
- What is the most significant omission in this deck?
- The deck lacks a business model or any mention of revenue. It assumes that if you aggregate enough 'eyeballs' in a valuable demographic, monetization is a solved problem. While Slide 6 mentions a $19B digital advertising market, it doesn't explain how Mars Reel specifically captures that value—whether through programmatic ads, branded content, or the apparel mentioned in their catalogue listing.
- Why compare the average viewer age to ESPN?
- This is a classic 'David vs. Goliath' positioning. By stating ESPN's average viewer is 30-38 while Mars Reel's is 13-24, the founders are telling investors that they own the future. Advertisers pay a premium for youth audiences because their brand loyalties are still being formed. This slide justifies why a brand would shift budget from a giant like ESPN to a startup like Mars Reel.
- Is the engagement metric on Slide 4 realistic?
- Slide 4 claims users spend 1:30 watching a 40-second video. This implies high replayability or 'looping,' which was a hallmark of short-form video success in the mid-2010s. For an investor, this metric is even more important than total views because it indicates the content is 'sticky' and that the audience is highly engaged rather than just passively scrolling past.
- What role does social proof play in this deck?
- Social proof is the backbone of this fundraise. Slide 7 features logos from the NBA, DraftKings, and Intel. Even without a detailed team biography, these logos signal to new investors that the 'smart money' has already vetted the founders. The final slide, showing the founders at 500 Startups, reinforces their status as part of a top-tier accelerator ecosystem.