Mashvisor’s 8-slide seed deck is a masterclass in brevity and product-centric storytelling. Raising $1.1M in 2015, the company targeted the friction in real estate investment research. The deck relies heavily on high-fidelity product screenshots to demonstrate how it aggregates data from sources like Zillow and Airbnb to provide instant metrics like Cap Rate and Cash on Cash Return. While it lacks a dedicated team slide, competition matrix, or detailed financial projections, it compensates with strong traction data—showing 30% month-over-month growth and a clear LTV/CAC ratio. The narrative i…
Key takeaways
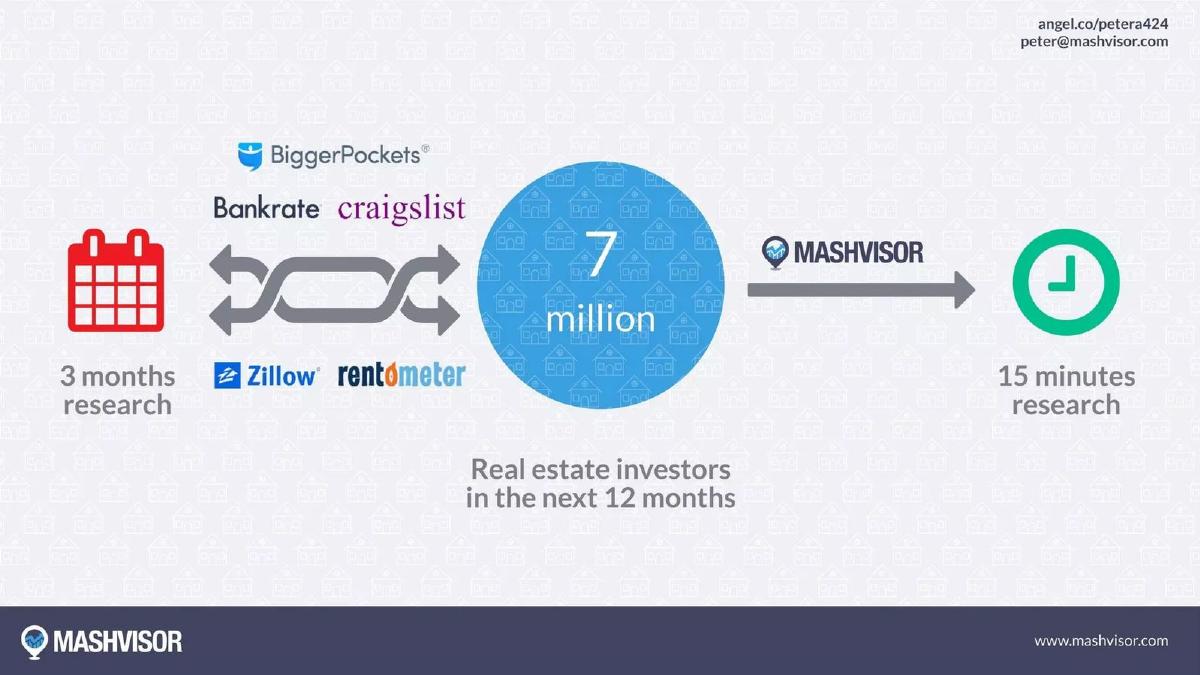
- The deck claims to reduce real estate research time from 3 months to 15 minutes (Slide 3).
- Mashvisor identifies a market of 7 million real estate investors active in the next 12 months (Slide 3).
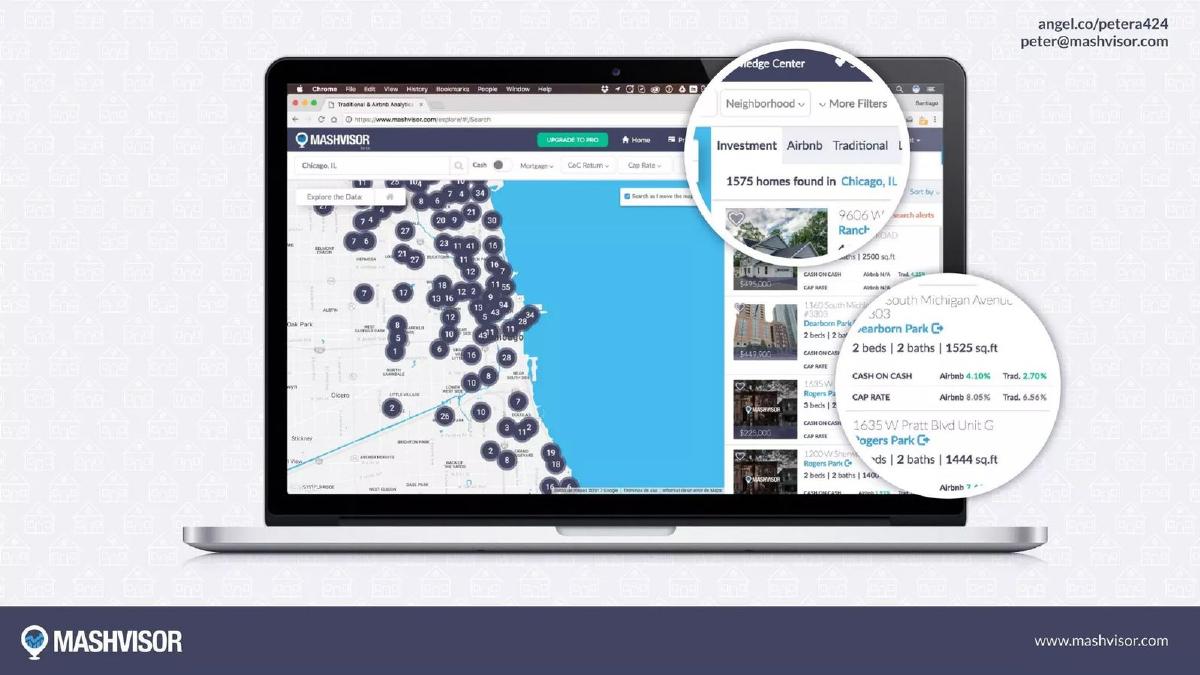
- Product screenshots on Slide 4 and 5 highlight specific financial metrics including Cash on Cash Return and Cap Rate for both Airbnb and traditional rentals.
- The company reported a consistent 30% month-over-month growth rate leading into early 2017 (Slide 7).
- Unit economics are explicitly stated as a $70 CAC against a $250 LTV (Slide 7).
- The platform reached approximately $12,000 in Monthly Recurring Revenue (MRR) by January 2017 (Slide 7).
- The deck completely omits a team slide, providing only the CEO's contact information on the cover and closing slides.
- There is no formal 'Ask' slide detailing the amount of capital being raised or the intended use of funds within the 8 slides provided.
The 8-Slide Efficiency Play
Mashvisor’s pitch deck is an exercise in minimalism. In an industry—real estate tech—often bogged down by complex regulatory talk and macroeconomic forecasting, Mashvisor focuses on the individual user's pain point: time. The deck is built around the transition from manual, multi-source research to a centralized, automated dashboard. While it breaks several 'rules' of pitching (such as omitting a team slide), the clarity of the product's value proposition and the transparency of its unit economics make it a compelling case for a seed-stage investment.
The Hook and the Problem (Slides 1-2)
Slide 1: Cover The cover slide establishes the brand immediately with a high-resolution image of a residential property and a laptop displaying the Mashvisor interface. The tagline is functional: "We help real estate investors find traditional and Airbnb investment properties." It identifies the two-pronged approach (long-term and short-term rentals) that differentiates the platform from standard residential search engines like Zillow.
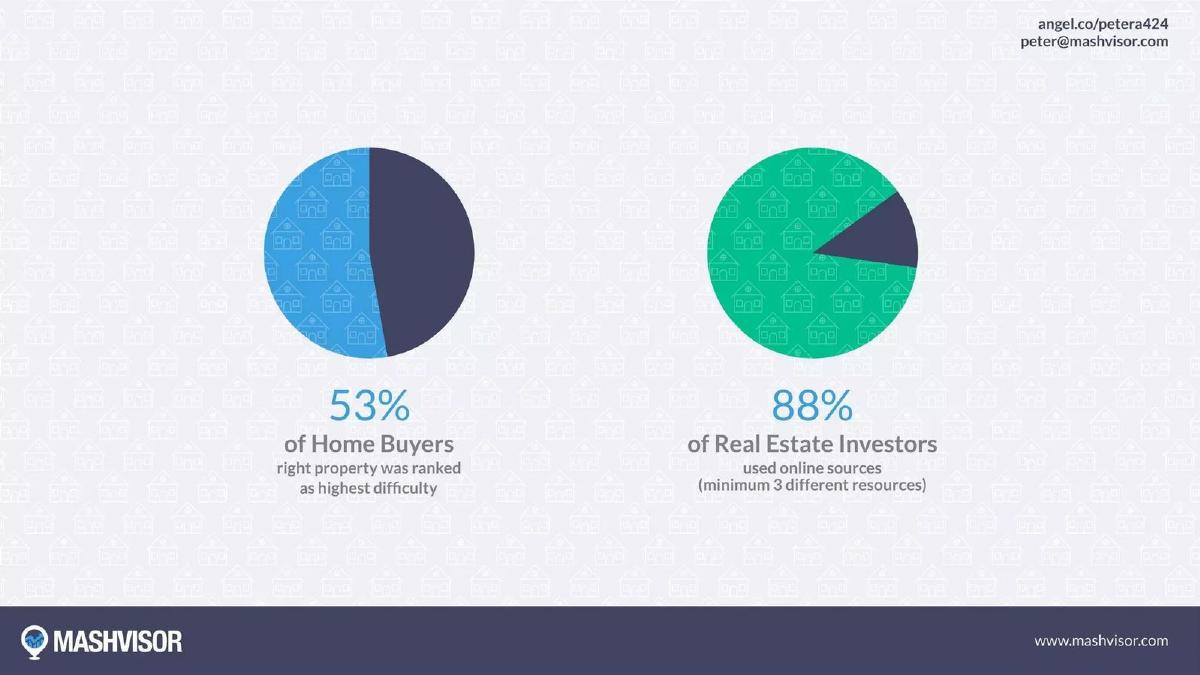
Slide 2: Market Friction Mashvisor uses two data points to establish the problem. First, 53% of home buyers rank finding the right property as their highest difficulty. Second, and more importantly for the business model, 88% of real estate investors use online sources, with a minimum of three different resources. This slide sets up the 'fragmentation' problem without needing a wall of text. It suggests that investors are already online but are forced to work across multiple tabs and tools.
The Solution and Value Proposition (Slide 3)
Slide 3: The Efficiency Gap This is the most critical slide in the deck. It visualizes the 'Before and After' state of a Mashvisor user. On the left, it shows a 3-month research cycle involving a chaotic mix of BiggerPockets, Bankrate, Craigslist, Zillow, and Rentometer. In the center, it identifies a target market of 7 million real estate investors active in the next 12 months. On the right, it shows the Mashvisor logo leading to a "15 minutes research" outcome. By quantifying the time saved—moving from months to minutes—Mashvisor moves the conversation from 'nice-to-have data' to 'essential productivity tool.'
Product Walkthrough (Slides 4-6)
Slide 4: Search and Discovery Instead of listing features, Mashvisor uses a series of three slides to show the product in action. Slide 4 shows a map-based search of Chicago. Call-outs highlight the ability to toggle between Airbnb and Traditional investment types. It also shows the immediate availability of "Cash on Cash" and "Cap Rate" metrics for individual listings, demonstrating that the heavy lifting of financial modeling is done automatically.
Slide 5: Deep-Dive Analytics This slide focuses on the valuation analysis. It shows a detailed breakdown of rental strategy, comparing Airbnb vs. Traditional side-by-side. It includes granular data points like monthly expenses, cash flow, and occupancy rates. A call-out also shows a mortgage/financing calculator, proving the platform handles the entire investment thesis, not just the search phase. This slide effectively addresses the 'how' of the 15-minute research claim.
Slide 6: Market Comparison The final product slide shows a "Top Cities" view, featuring Miami, New York, San Francisco, and others. This demonstrates the platform's scale. It isn't a local tool; it is a national data aggregator. By showing median property prices and Cash on Cash returns across different geographies, it positions Mashvisor as a tool for the 'remote investor'—a growing demographic in 2015-2017.
Traction and Unit Economics (Slide 7)
Slide 7: Growth Metrics Mashvisor presents a very healthy traction profile. The slide highlights a 30% Month-over-Month (MoM) growth rate. The MRR chart shows a steady climb from June 2016 (approx. $2,000) to January 2017 (approx. $12,000). Crucially, the slide includes unit economics: a $70 Customer Acquisition Cost (CAC) and a $250 Lifetime Value (LTV). An LTV/CAC ratio of ~3.5x at this early stage is a strong signal of a sustainable and scalable marketing engine.
The Summary (Slide 8)
Slide 8: Closing The final slide reiterates the three strongest pillars of the pitch: 30% M/M growth, the 3-month to 15-minute efficiency gain, and the 28 million real estate investor market (notably, this number is higher than the 7 million cited on Slide 3, likely referring to the total addressable market vs. the immediate 12-month active market). It provides the CEO's direct contact information but, again, omits any mention of the rest of the team or the specific funding ask.
What Works in the Mashvisor Deck
The Efficiency Narrative: The "3 months to 15 minutes" claim is a powerful, sticky metric that investors can easily grasp and validate. · Side-by-Side Comparison: By showing Airbnb and Traditional data together, Mashvisor captures the zeitgeist of the mid-2010s rental market shift. · Unit Economics Transparency: Including CAC and LTV on the traction slide shows that the founders are thinking about the business as a machine, not just a product. · Visual Evidence: The high-fidelity screenshots reduce the 'imagination gap.' Investors don't have to wonder if the tech exists; they can see the UI is polished and functional.
What is Missing from the Mashvisor Deck
The Team Slide: This is a glaring omission. Investors at the Seed stage are primarily investing in the founders' ability to execute. Without bios or logos of previous companies/universities, the 'why us' remains unanswered. · The Ask: The deck doesn't state how much money is being raised or what the milestones for the next 18 months are. This makes it feel more like a company profile than a fundraising document. · Competitive Landscape: While Slide 3 mentions other tools, it doesn't explain why Mashvisor's data is more accurate or how they protect their margins against incumbents like Zillow or new entrants in the AirDNA space. · Financial Projections: While the historical MRR is clear, there is no forward-looking projection of where the company intends to be in 1-3 years.
What a Founder Should Copy
The 15-Minute Rule: If your product saves time, quantify it exactly. Don't say "it's faster"; say "it turns X hours into Y minutes." · The Call-Out Technique: Using magnifying glass 'bubbles' to highlight specific data points within a complex screenshot (as seen on Slides 4 and 5) is an excellent way to show product depth without overwhelming the viewer. · Clean Traction Charts: Slide 7 is a model for how to present growth. It combines a visual trend line with the four most important SaaS metrics (Growth %, MRR, CAC, LTV) in a single, uncluttered view. · Focus on the User Journey: The deck follows the logical path of an investor: Problem -> Search -> Analysis -> Decision. Aligning your slides with the user's workflow makes the product's utility feel intuitive.
Frequently asked questions
- How much did Mashvisor raise with this deck?
- According to the catalogue data, Mashvisor raised $1,100,000 in 2015. However, the deck itself contains data points through January 2017, suggesting this version of the deck was likely used for follow-on seed funding or a bridge round after the initial 2015 raise.
- What is the core problem Mashvisor solves?
- The problem is the inefficiency of manual data collection. Slide 3 illustrates that investors currently juggle sources like Zillow, Craigslist, and BiggerPockets, taking three months to find a property. Mashvisor aggregates this into a single 15-minute workflow.
- Does the deck show any financial traction?
- Yes. Slide 7 provides a clear MRR growth chart starting from approximately $2,000 in June 2016 and scaling to $12,000 by January 2017. It also includes a 30% month-over-month growth metric.
- What is missing from the Mashvisor pitch deck?
- The deck is missing several standard components: a team slide (biographies/experience), a competition slide (direct rivals), a roadmap, and a specific 'Ask' slide. It relies almost entirely on the product's utility and recent growth trends.
- Who is the target audience for the platform?
- The deck targets individual real estate investors. Slide 2 notes that 88% of these investors use at least three different online resources, and Slide 3 identifies a pool of 7 million investors active annually.