StudySoup’s pitch deck is a minimalist outlier in the EdTech space, consisting of only seven slides. Rather than getting bogged down in pedagogical theory or complex competitive matrices, the deck focuses almost exclusively on a hockey-stick growth curve and the earning potential of its 'Elite Notetakers.' With 500,000 registered users by Q1 2016 and a claim of doubling revenue every quarter, the narrative is driven by market validation rather than product features. While it lacks a formal team slide with biographies or a specific 'ask' for the round, the deck successfully uses a 'Recap' slid…
Key takeaways
- The deck leads with growth, showing a jump from under 125k users in Q3 2015 to 500k in Q1 2016 (Slide 2).
- The problem is framed quantitatively as a time burden: 305 hours of reading and 180 hours of lectures (Slide 3).
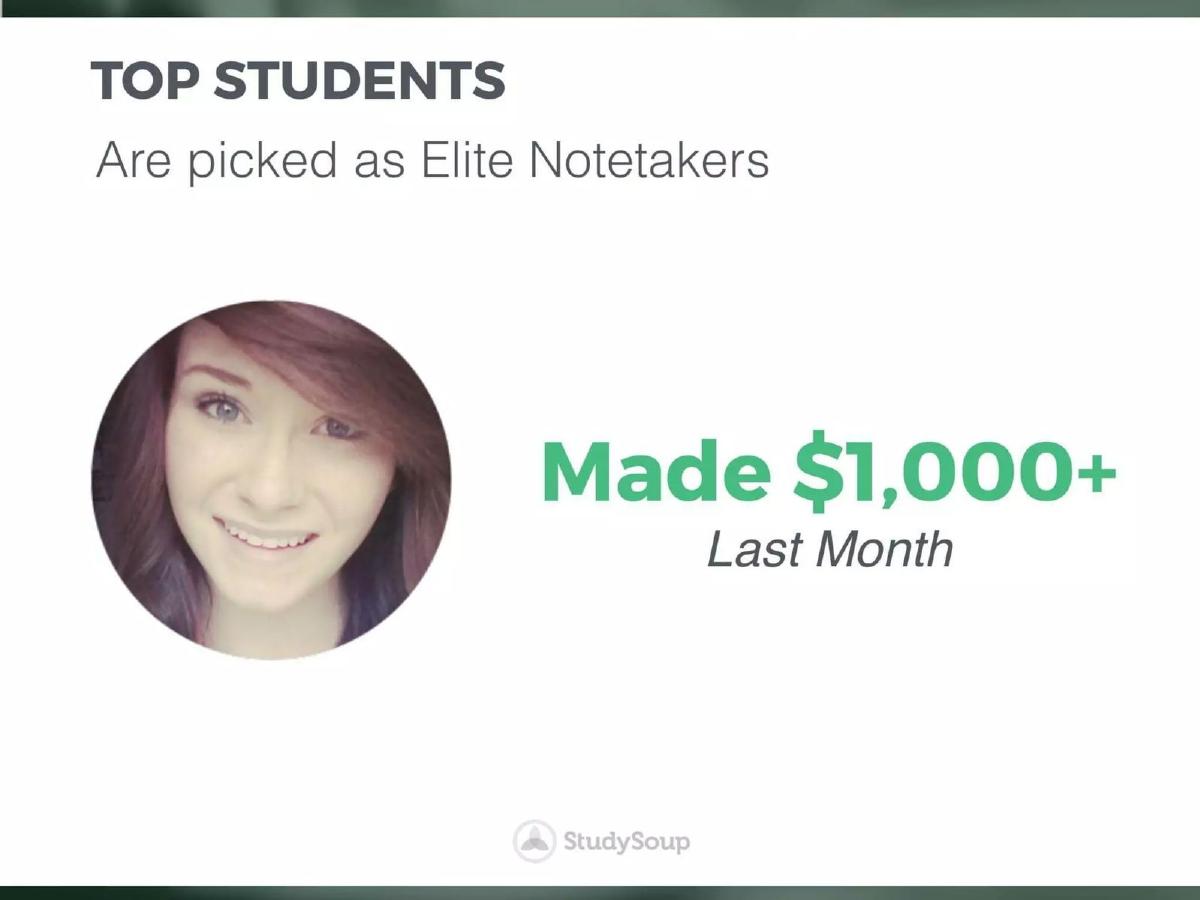
- The supply-side value proposition is validated by a single case study of a student making $1,000+ in one month (Slide 4).
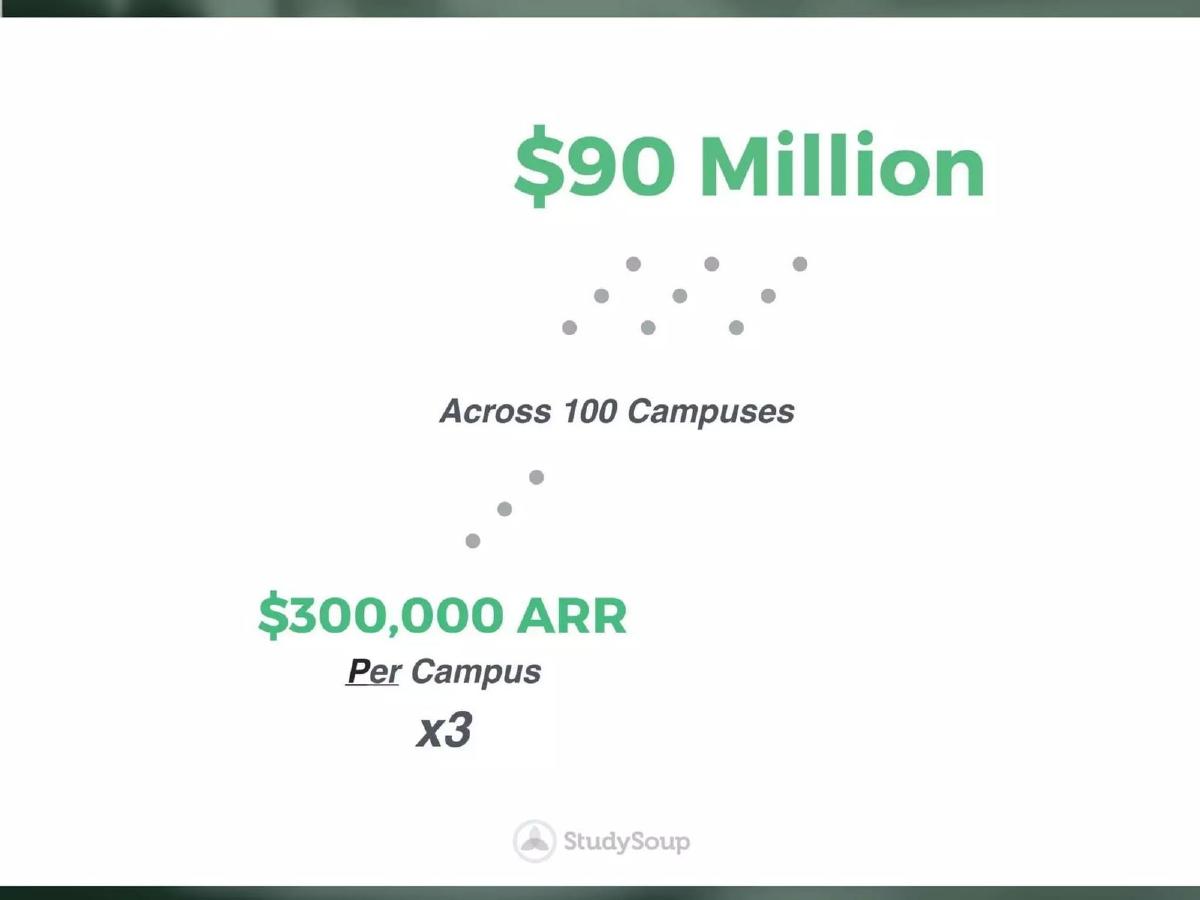
- Market potential is calculated using a bottom-up approach: $300,000 ARR per campus across 100 campuses to reach $90 million (Slide 5).
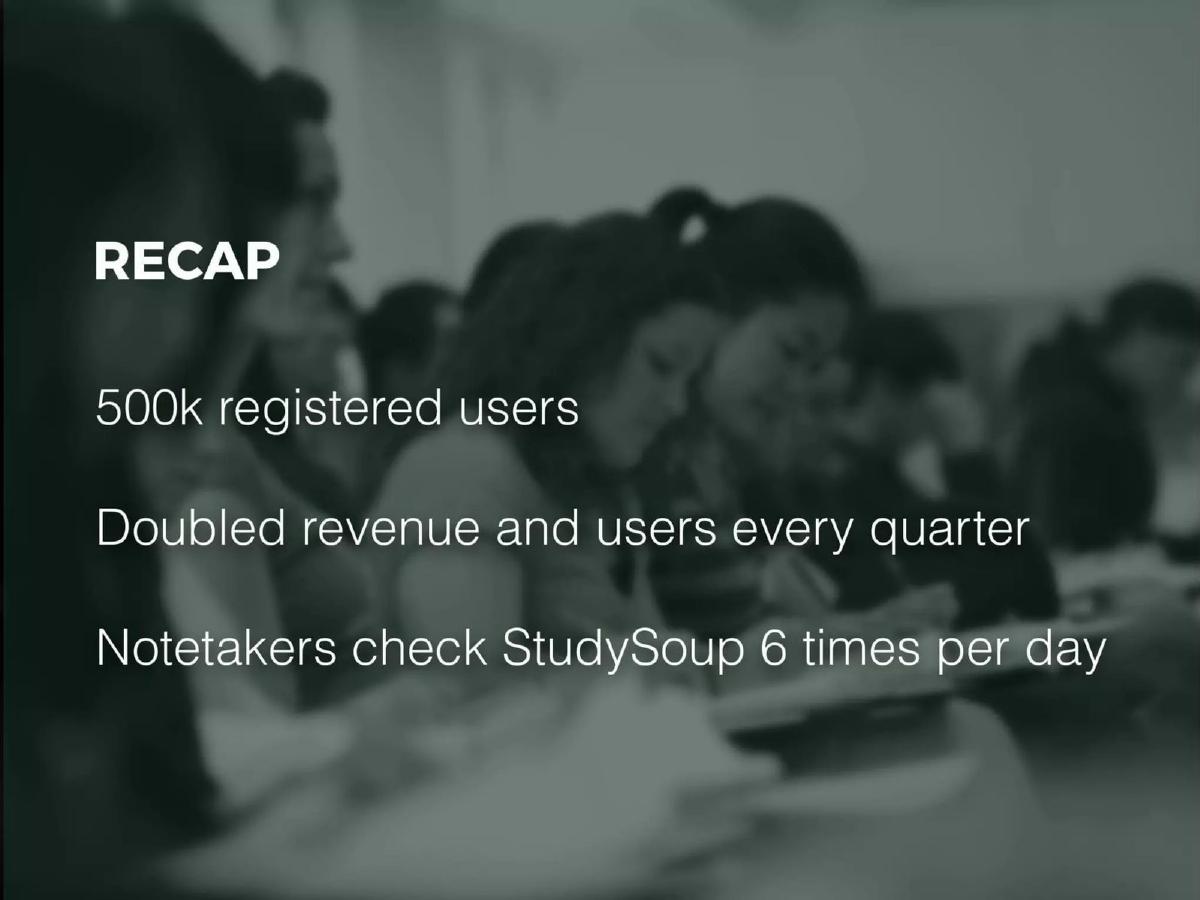
- Engagement is highlighted as a core metric, with notetakers checking the platform 6 times per day (Slide 6).
- The deck omits a traditional competitive landscape, detailed financial projections, and a specific funding ask.
- The 'Recap' slide serves as a final punchy summary of the company's three strongest data points (Slide 6).
- The team is presented visually via a photo on the final slide, but no names, titles, or backgrounds are provided (Slide 7).
The Power of Minimalist Traction
The StudySoup pitch deck is a study in brevity. At just seven slides, it ignores many of the 'rules' of pitch deck construction—there is no formal competitive analysis, no detailed roadmap, and no breakdown of how the $2.1 million will be spent. Instead, it focuses on a singular narrative: explosive growth in a massive, underserved market. By 2012, the peer-to-peer learning space was becoming crowded, but StudySoup’s deck (updated with 2016 data) shows a company that found a repeatable growth lever.
Slide 1: Title and Positioning
The deck opens with a clear, bold claim: "The Fastest Growing College Marketplace." The background image of students in a lecture hall immediately establishes the context. The branding is clean, and the subtitle sets a high bar for the data that follows. This isn't just a study tool; it's a marketplace, which implies a business model built on transactions and commissions.
Slide 2: The Traction Curve
Slide 2 is the most important slide in the deck. Titled "LAST 15 MONTHS," it displays a line graph of registered users. The growth is relatively flat from Q1 2015 to Q3 2015, but then it hits an inflection point. By Q1 2016, the company reached 500k Registered Users . This visual represents the 'hockey stick' growth that venture capitalists look for. It answers the question of market fit before the problem has even been fully described.
Slide 3: Quantifying the Academic Burden
Under the heading "SCHOOL IS..." , Slide 3 breaks down the 'Problem' into two specific numbers: 305 Hours of Reading and 180 Hours of Lectures . The use of stock photography showing stressed and sleeping students is a standard trope, but the specific hour counts provide a quantitative basis for why students need help. It frames the academic experience as a massive time-sink that requires external support to navigate efficiently.
Slide 4: The Supply-Side Incentive
A marketplace is only as good as its inventory. Slide 4 focuses on "TOP STUDENTS" who are "picked as Elite Notetakers." It features a testimonial-style photo and a striking figure: "Made $1,000+ Last Month." This slide is crucial because it demonstrates the 'earning' side of the marketplace. If a student can earn a significant portion of their living expenses by simply doing what they are already doing (taking notes), the platform's ability to attract high-quality content is validated.
Slide 5: The Path to $90 Million
Slide 5 provides a bottom-up market sizing. Instead of citing a multi-billion dollar global education market, StudySoup breaks it down by campus. They claim "$300,000 ARR Per Campus" and multiply that by "x3" (though the visual logic here is slightly obscured by the layout) to reach a goal of "$90 Million Across 100 Campuses." This suggests a highly scalable model where the company knows exactly what a 'win' looks like at a single university and simply needs to replicate that success 100 times.
Slide 6: The Recap and Engagement
The "RECAP" slide functions as the executive summary. It reiterates the 500k registered users and adds a new, powerful financial metric: "Doubled revenue and users every quarter." It also introduces an engagement metric: "Notetakers check StudySoup 6 times per day." This is a classic 'hook' for investors, showing that the platform has high retention and daily utility for its power users.
Slide 7: The Team and Contact
The final slide, "THANK YOU," shows a photo of the two founders wearing StudySoup t-shirts. Curiously, the slide does not list their names, their previous experience, or their specific roles. It provides a single email address: founders@studysoup.com . While this maintains the minimalist aesthetic of the deck, it is a missed opportunity to build 'founder-market fit' credibility.
What Works in This Deck
1. Data-Driven Narrative: The deck doesn't ask the investor to believe in a vision; it asks them to believe in the data. By leading with a 500k user milestone and a revenue doubling rate, the founders make the investment seem like a bet on a proven engine rather than a risky experiment.
2. Simple Unit Economics: The $300k ARR per campus figure is a brilliant way to simplify a complex business. It allows an investor to do 'back of the envelope' math on the company's valuation and potential exit size without needing a 20-tab spreadsheet.
3. Clear Value Prop for Supply: Many marketplaces fail because they can't get people to provide the service. Showing a student making $1,000 a month is a powerful proof of concept for the supply side of the business.
What Is Missing
1. Competitive Landscape: The EdTech space in 2012-2016 was crowded with players like Chegg, Course Hero, and Quizlet. This deck makes no mention of how StudySoup differentiates itself or protects its 'Elite Notetakers' from being poached by larger platforms.
2. The 'Ask': There is no mention of how much money is being raised or what the milestones for the next 18 months are. While this information is often shared in person, its absence in the deck makes the document feel more like a marketing brochure than a formal fundraising tool.
3. Team Pedigree: In early-stage investing, the 'who' is often as important as the 'what.' The lack of founder bios is a significant omission that forces the investor to do their own due diligence on the team's ability to execute.
What a Founder Should Copy
1. The Inflection Point Graph: If your startup has hit a point where growth is accelerating, make that the centerpiece of your deck. StudySoup’s Slide 2 is a perfect example of how to visualize momentum.
2. The 'Recap' Slide: Ending a presentation with a summary of your three strongest points ensures that those are the figures that stick in the investor's mind after the meeting ends.
3. Bottom-Up Market Sizing: Avoid the '1% of a $100 Billion Market' fallacy. Instead, follow StudySoup’s lead and show what a single unit of your business (a campus, a city, a store) is worth, and then show the path to 100 or 1,000 units.
Frequently asked questions
- Why is the StudySoup deck so short compared to other EdTech startups?
- StudySoup likely relied on the strength of its traction to do the heavy lifting. When a company can show it has reached 500,000 users and is doubling revenue every quarter, investors require less 'convincing' on the problem/solution fit. The brevity suggests this deck was used as a teaser or a presentation support rather than a standalone document meant to explain every detail of the business.
- How does StudySoup define its market opportunity in this deck?
- Instead of using a standard TAM/SAM/SOM slide with billions of dollars in vague figures, StudySoup uses a 'per campus' model. On Slide 5, they project $300,000 in ARR per campus. By multiplying this by 100 campuses, they arrive at a $90 million target. This makes the path to scale feel tangible and repeatable rather than theoretical.
- What is the significance of the 'Elite Notetakers' slide?
- Marketplaces live or die by their supply side. By showing that a top student can earn $1,000+ a month (Slide 4), StudySoup proves that the incentive for high-quality content creation is strong. This addresses the 'cold start' problem of marketplaces by showing that the platform provides significant financial value to its most important users.
- Is the lack of a team slide a mistake?
- While Slide 7 shows a photo of the founders, it lacks names and credentials. In a seed or 'Other' stage round, this is usually a major omission. However, if the founders had previous exits or the traction was undeniable, they may have chosen to let the numbers speak for themselves. For most founders, adding a proper team slide is highly recommended.
- What does the engagement metric '6 times per day' tell an investor?
- Slide 6 mentions that notetakers check the app 6 times daily. This is a 'stickiness' metric. It tells investors that StudySoup isn't just a utility used once a semester during finals; it is a daily habit for the supply side of the marketplace, which ensures the content remains fresh and the community remains active.