Susa Ventures IV presents a compelling case for a dual-fund structure, raising a $100M Seed Fund and a $200M Opportunity Fund simultaneously. The deck emphasizes a 'barbell approach' (Slide 6), where the firm sources seed deals and then uses the opportunity fund to lead or co-lead Series B rounds in its best-performing companies. With a portfolio that has created $19B+ in enterprise value (Slide 9) and includes notable names like Robinhood and Flexport, Susa demonstrates a high 'hit rate' (Slide 11). The deck effectively uses back-tested data to justify the opportunity fund, showing how a hyp…
Key takeaways
- The fund is raising two vehicles: a $100M seed fund and a $200M opportunity fund (Slide 5).
- Susa employs a 'barbell approach,' sourcing seed deals and leading Series B rounds in top performers (Slide 6).
- The portfolio has created over $19B in aggregate enterprise value across 115+ companies (Slide 9).
- Over 50% of Susa's seed companies have follow-on rounds led by top-tier firms like Sequoia and Founders Fund (Slide 10).
- A power-law analysis shows that 20% of Susa's seed investments drive 90% of the returns (Slide 12).
- The firm targets an average check size of $1.25M for the seed fund with a 1:1 reserve ratio for pro-rata (Slide 8).
- Susa maintains a high founder NPS of 96, emphasizing a 'family' culture and community events (Slide 4).
- The opportunity fund strategy is validated by back-testing against actual Series B rounds in Susa companies (Slide 13).
Susa Ventures IV: A Masterclass in Multi-Stage Fund Strategy
The Susa Ventures IV and Opportunities II deck is a sophisticated document designed for Limited Partners (LPs). Unlike typical startup pitches, this deck focuses on fund mechanics, portfolio construction, and the 'alpha' generated by early access. The narrative is built around the transition from a pure-play seed firm to a multi-stage powerhouse that captures the full value of its winners.
The Genesis and Culture of Susa
Slide 1: Title Slide The deck opens with the branding for Susa Ventures IV and Susa Opportunities II, dated Q1 2021. The background imagery of a lush, misty forest sets a tone of growth and long-term perspective.
Slide 2: The Susa Family The firm establishes its identity by explaining its name, derived from a mountain gorilla family in Rwanda. The slide emphasizes that gorillas were among the first species to organize into 'strong family groups.' This 'family' metaphor is a recurring theme throughout the deck, used to describe their relationship with founders.
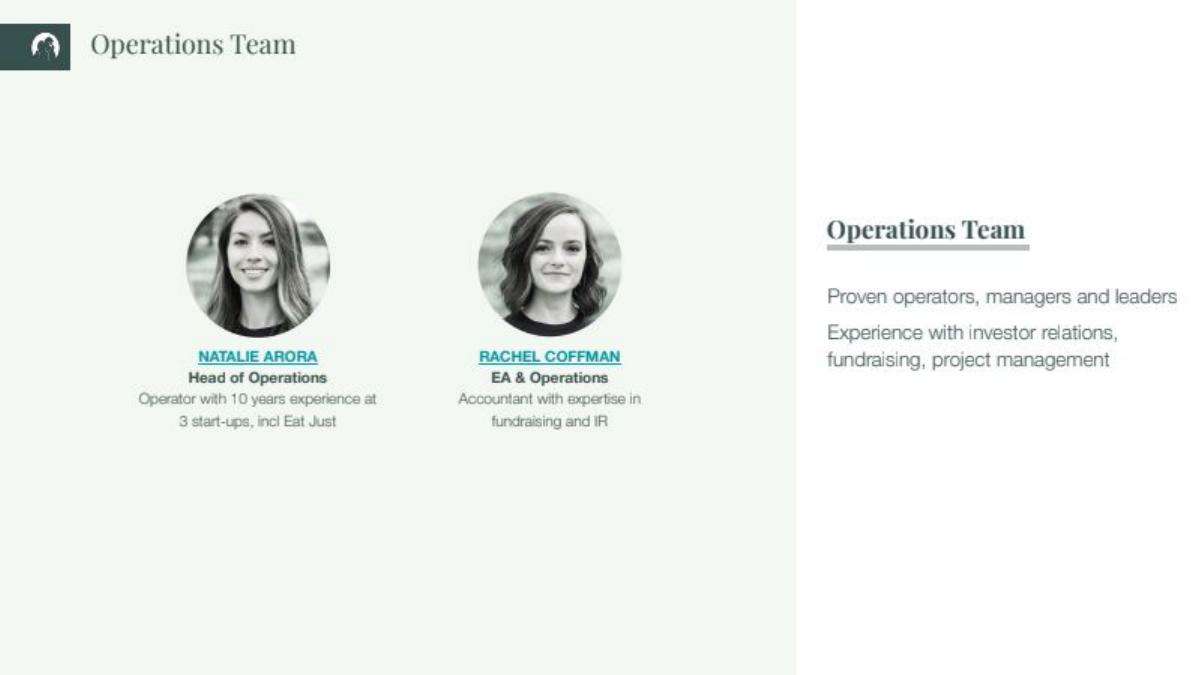
Slide 3: Operations Team This slide introduces Natalie Arora (Head of Operations) and Rachel Coffman (EA & Operations). It highlights their experience in investor relations, fundraising, and project management. Notably, this slide focuses on the support structure rather than the GPs, who appear later.
Slide 4: The Susa Founder Experience Susa quantifies its qualitative support with a '96 Founder NPS' . The slide uses a collage of photos to show 'Onboarding swag,' 'Susa Bootcamps,' 'Family Dinners,' and the 'Mountain Tech Summit.' This is designed to prove that Susa is a 'value-add' investor that founders actively want on their cap table.
The Dual-Fund Strategy
Slide 5: The Ask The core of the fundraise is presented clearly: a $100M seed fund and a $200M opportunity fund . This 1:2 ratio between seed and growth capital is the central pillar of their new strategy.
Slide 6: The Barbell Approach This is the most important strategic slide in the deck. It visualizes the 'barbell' strategy: Susa IV handles the 'Seed' end (sourcing and winning deals), while Susa Opp II handles the 'Series B' end (leading or co-leading rounds in winners). The 'Series A' middle is described as doing pro-rata alongside top-tier funds. This demonstrates a clear plan to avoid the 'Series A crunch' while doubling down on proven winners.
Portfolio Performance and Validation
Slide 7: Susa II Performance This slide provides a snapshot of their 2016 vintage $50M fund. While specific dollar amounts are redacted in this version (marked as $#. #M), it lists high-potential companies like Stord, Viz.ai, Stedi, Sundae, Newfront, Pex, and Workramp . It notes that the fund has '5+ high potential companies that can be fund-returners.'
Slide 8: Susa IV Strategy The deck details the mechanics for the new $100M seed fund: 40 target investments , an average check size of $1.25M , and a 1:1 reserve ratio for pro-rata. This is a standard, disciplined seed fund model.
Slide 9: Aggregate Value Susa presents its 'Susa Family' metrics: 115+ backed companies , $19B+ in aggregate value , $5B+ capital raised , and 7k employees . Logos for Expanse, Fast, Flexport, Robinhood, and Stord are used to anchor these large numbers in recognizable success stories.
Slide 10: Follow-on Signaling To prove they pick the right companies, Susa shows that 'Over 50% of Series A rounds' are led by top-tier firms. The slide lists a 'who's who' of VC, including Founders Fund, Sequoia, NEA, Kleiner Perkins, and Andreessen Horowitz, mapped to specific Susa portfolio companies.
The Logic of the Opportunity Fund
Slide 11: The Hit Rate A timeline from 2013 to 2020 shows the 'hit rate' of their seed investments. Companies are color-coded: green stars for $500M+ valuations and yellow stars for $150M+ valuations . This visual density of successful companies (Robinhood, Flexport, Andela, Policygenius) builds confidence in their ability to select winners early.
Slide 12: Drivers of Return Susa provides an honest look at venture returns, stating that '20% of Susa seed investments drive 90% of returns.' A bar chart of Susa Ventures II illustrates this power law, showing a few massive winners and a long tail of smaller outcomes. This slide serves as the 'Problem' slide for the Opportunity Fund—without it, Susa is leaving too much money on the table by not investing more in that top 20%.
Slide 13: The Back-Test To prove the Opportunity Fund isn't just a theory, Susa back-tested the strategy. They modeled what would have happened if they had an opportunity fund for their previous seed winners. The chart shows a massive jump from 'Invested Capital' to 'FMV of Positions,' with Robinhood and Flexport as the primary drivers. This is a highly effective use of data to justify a larger fund size.
Slide 14: Access and Allocation A transition slide emphasizing that they have proven access to 'great mid-stage deals.' This addresses the potential LP concern that a seed firm might not be able to elbow its way into a competitive Series B.
Slide 15: Opportunity Fund I Track Record Susa shows the deployment of their first $50M Opportunity Fund from 2019. It lists investments in Stord, Sundae, Viz.ai, Newfront, Expanse, Human Interest, Policygenius, Whoop, Omio, Nova Credit, Fast, Stedi, and Mux . This proves they can successfully execute the 'barbell' strategy they proposed earlier.
Terms and Team
Slide 16: Summary Terms The final business slide lists the target sizes ($100M and $200M), the 1:2 ratio requirement for commitments, and a 10-year term with two one-year extensions. It provides contact emails for the three GPs: Seth Berman, Chad Byers, and Leo Polovets.
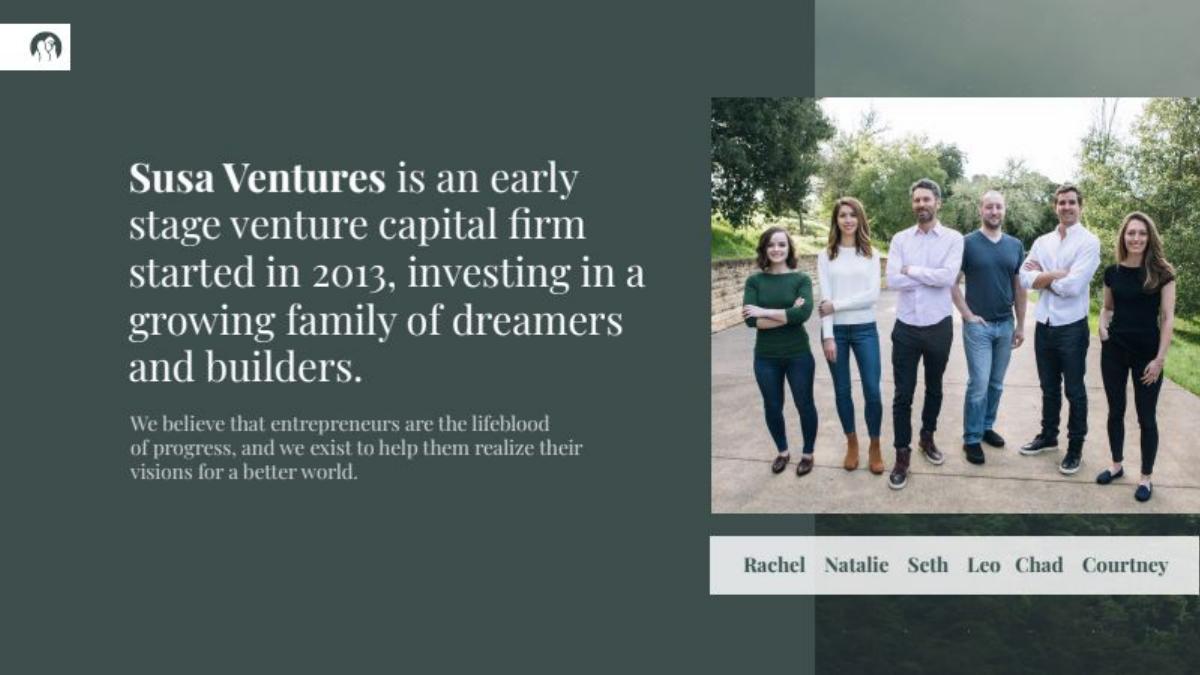
Slide 17: The Team The deck concludes with a group photo of the six-person team, reinforcing the 'family' culture mentioned at the start.
What Works in This Deck
The Barbell Visualization: Slide 6 is a perfect example of how to communicate a complex investment strategy in a single, intuitive graphic. · Data-Driven Justification: The use of back-testing (Slide 13) and power-law analysis (Slide 12) makes the move into later-stage investing feel like a logical necessity rather than a 'strategy creep.' · Social Proof via Co-investors: By listing the top-tier firms that lead their follow-on rounds (Slide 10), Susa uses the reputation of Sequoia and Andreessen Horowitz to validate their own picking ability. · Founder NPS: Including a specific metric for founder satisfaction (Slide 4) is a strong way to differentiate in a crowded seed market.
What Is Missing
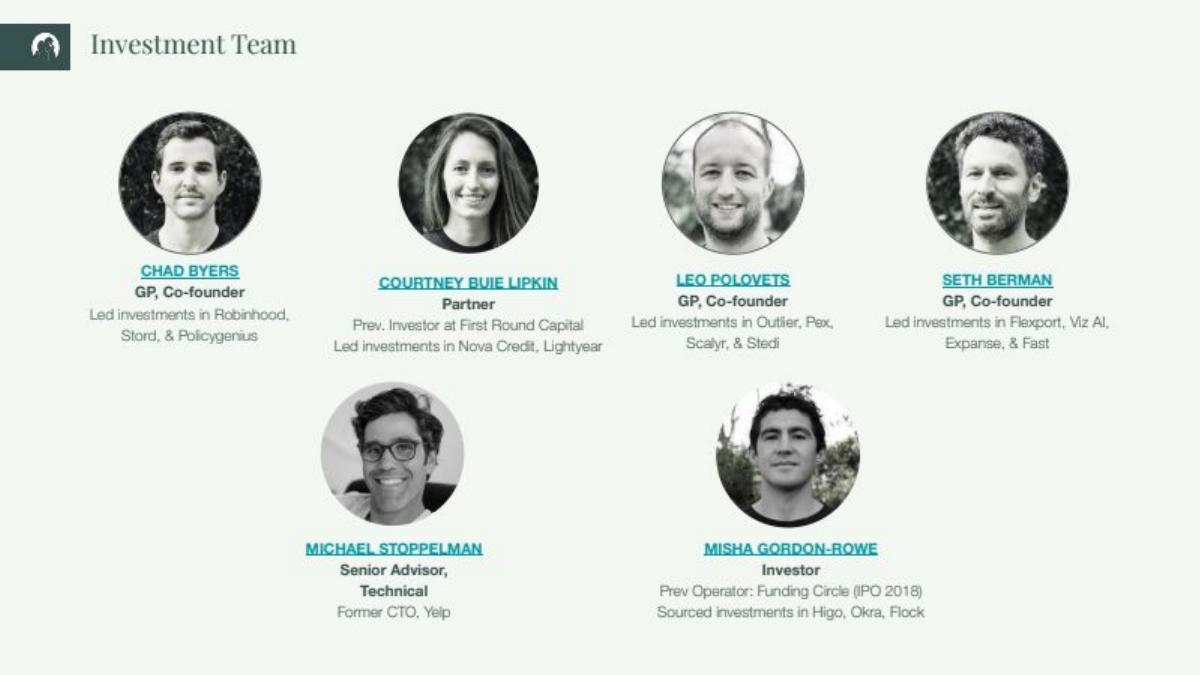
Individual GP Track Records: While the fund performance is shown, the specific backgrounds and past 'wins' of the individual GPs (Leo, Chad, Seth) before Susa are not detailed in these slides. · Sector Deep Dives: The deck mentions investing in data and network effects, but it doesn't provide a deep dive into specific sectors like Fintech or Healthcare, despite the catalogue tags. · Exit Data: The deck focuses heavily on 'Enterprise Value' and 'FMV' (Fair Market Value), which are often unrealized. There is limited information on actual DPI (Distributed to Paid-In capital) or realized exits, other than the mention of Robinhood.
Founder Takeaways
Quantify Your 'Soft' Value: If you claim to be 'founder-friendly,' don't just say it—measure it. Susa's use of a 96 NPS score is much more convincing than a list of generic services. · Back-Test Your Assumptions: If you are proposing a new business model or strategy, use your historical data to show what would have happened if you had implemented it sooner. · Leverage the 'Halo Effect': If you have worked with or been funded by reputable names, make that a central part of your story. Susa's Slide 10 is essentially a 'Halo Effect' slide that borrows credibility from the world's best VCs. · Address Strategy Creep Head-On: When moving from one product (Seed) to another (Opportunity Fund), explain exactly how they interact. The 'barbell' concept prevents the new fund from looking like a distraction.
Frequently asked questions
- What is the specific fundraising goal for Susa Ventures in this deck?
- Susa Ventures is raising two separate but linked funds: Susa Ventures IV, a $100M seed fund, and Susa Opportunities II, a $200M opportunity fund. According to Slide 16, the firm requires simultaneous commitments to both funds at a 1:2 ratio, meaning for every dollar committed to the seed fund, two dollars must be committed to the opportunity fund.
- How does Susa Ventures define its 'barbell approach'?
- As detailed on Slide 6, the barbell approach involves two distinct activities. On one end, they source and win the 'best seed stage deals' through Susa IV. On the other end, they use Susa Opportunities II to lead or co-lead Series B rounds in their best-performing companies. In the middle (Series A), they maintain their position by doing pro-rata alongside top-tier Series A funds.
- What evidence does the deck provide regarding the quality of Susa's portfolio?
- Slide 9 states that the 'Susa Family' has created $19B+ in enterprise value across 115+ companies, which have raised a combined $5B+ in capital. Slide 10 further validates this by showing that over 50% of their follow-on rounds are led by top-tier firms, listing logos such as Sequoia, Founders Fund, Kleiner Perkins, and Andreessen Horowitz.
- What are the core investment parameters for the Susa IV seed fund?
- Slide 8 outlines the strategy for Susa IV: a $100M total fund size targeting 40 investments. The average initial check size is $1.25M. The fund also maintains a 1:1 reserve ratio, specifically designated for maintaining pro-rata rights in their best-performing companies as they scale.
- How does Susa justify the need for a larger Opportunity Fund?
- Susa uses back-testing and power-law analysis to justify the $200M Opportunity Fund. Slide 12 shows that 20% of their seed investments drive 90% of returns. Slide 13 presents a 'Hypothetical Opportunity Fund' model, back-testing the strategy against every Series B round in a Susa company where a top firm led the Series A, demonstrating significant unrealized gains.