The InstaGIS pitch deck is a concise 13-slide presentation that leans heavily on social proof and clear value propositions. By leading with high-profile logos like Walmart and Unilever, the company establishes immediate credibility in the retail and marketing space. The deck focuses on the 'where' of consumer behavior, promising to increase retail operating margins by 60% through data-driven location intelligence. While the deck is light on detailed financial projections and competitive analysis, it compensates with strong traction—reporting $160,000 in revenue within just eight months. The a…
Key takeaways
- The company secured early traction with major global brands including Unilever, Walmart, and Kimberly-Clark (Slide 1, 5).
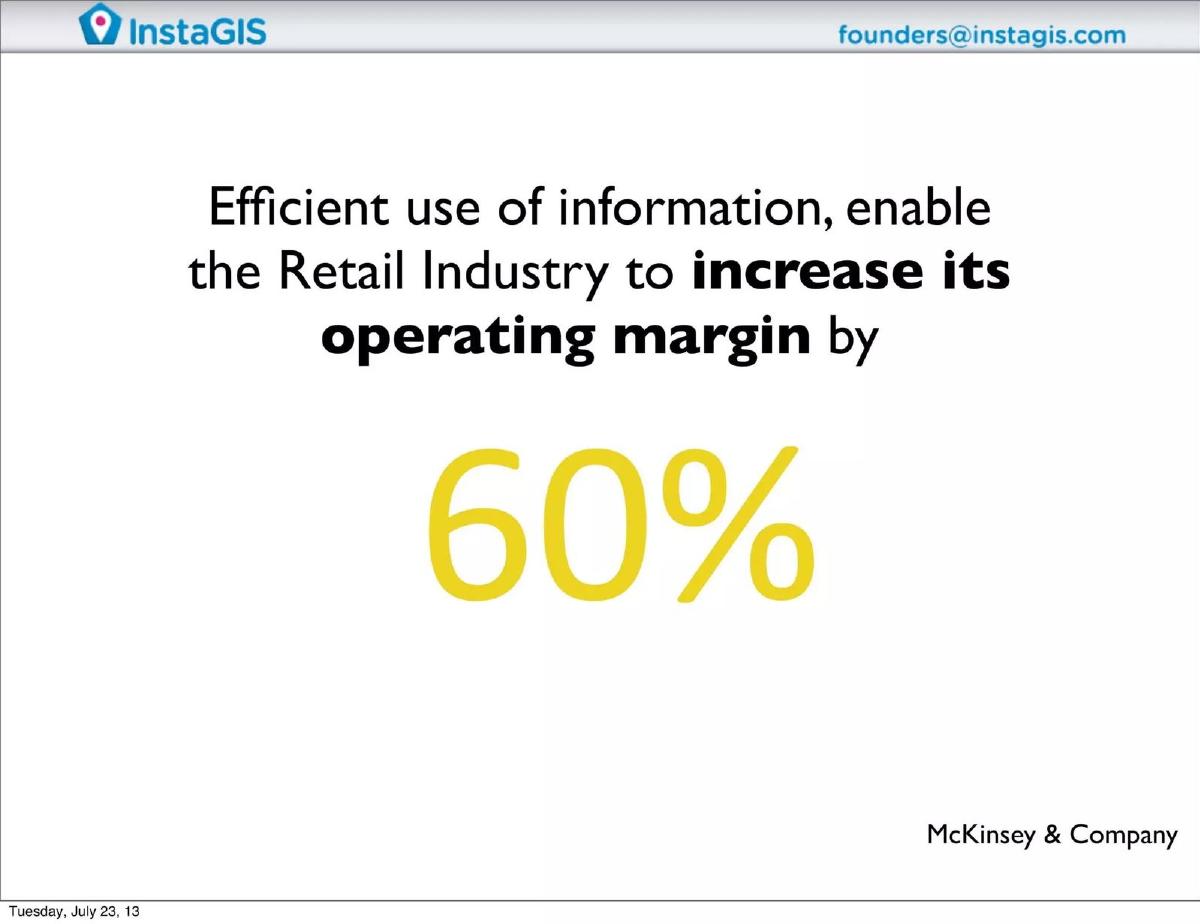
- InstaGIS claims that efficient use of information can increase retail operating margins by 60%, citing McKinsey & Company (Slide 4).
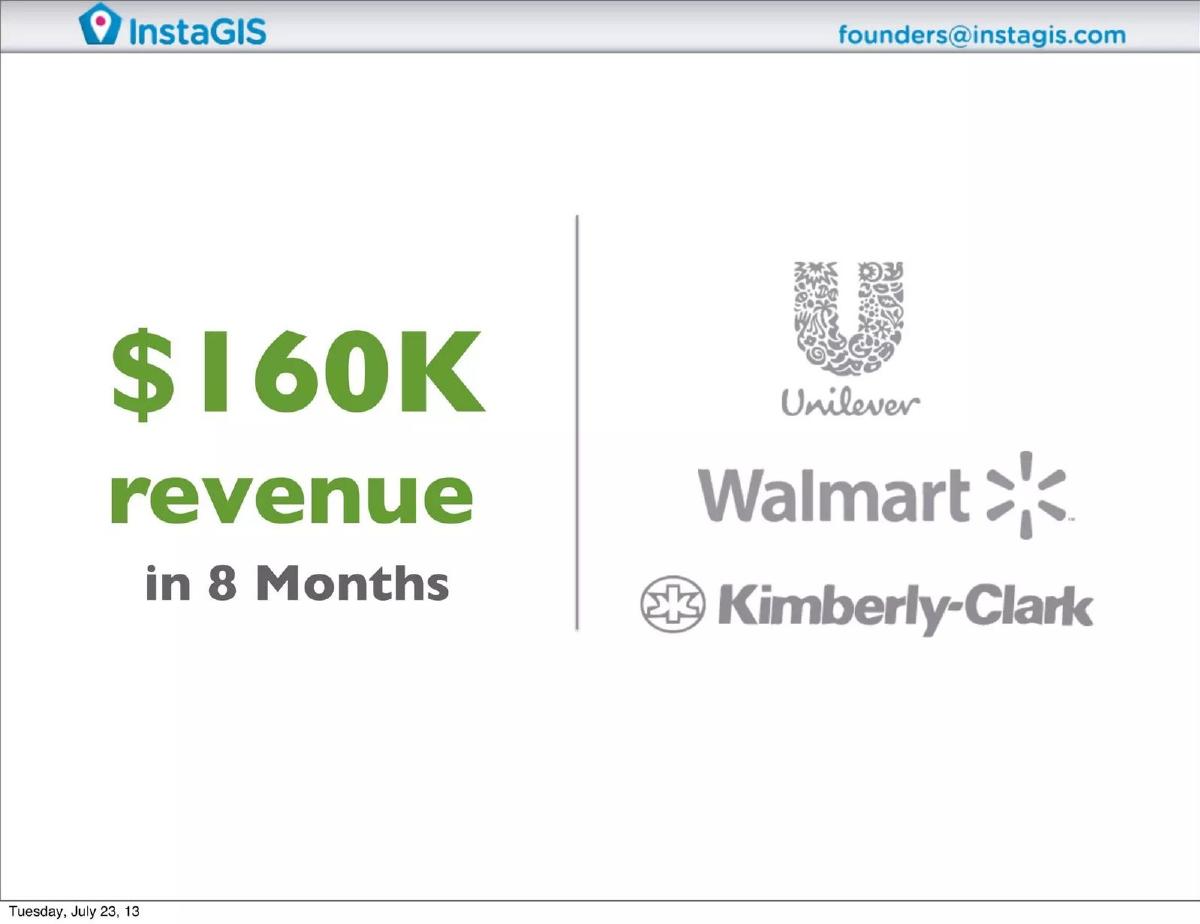
- The startup generated $160,000 in revenue within its first eight months of operation (Slide 5).
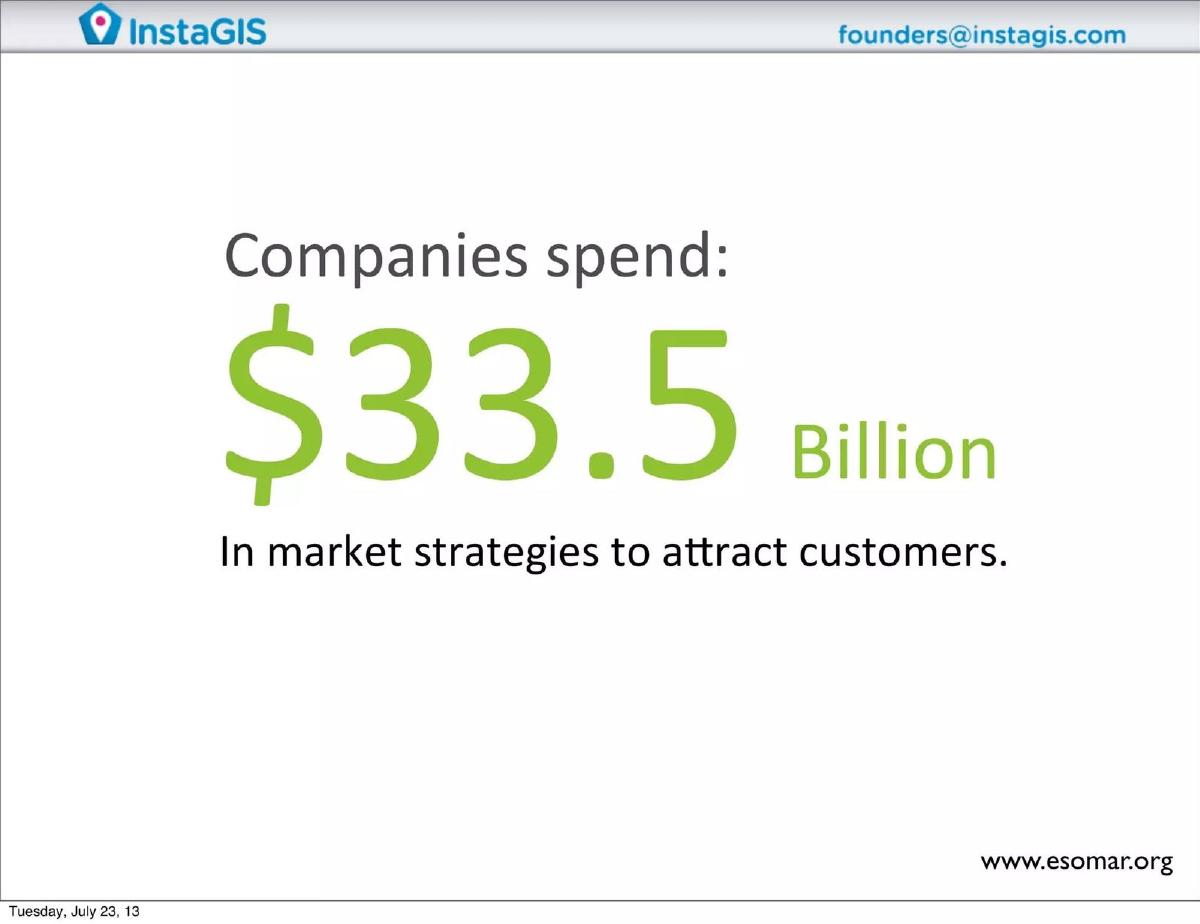
- The total addressable market for market strategies to attract customers is valued at $33.5 billion (Slide 6).
- The technology indexes data from government sources (Census), social networks (Facebook, Twitter, Instagram), and private sources like Gnip and Factual (Slide 9).
- The business operates on a SaaS revenue model with monthly subscription fees targeting both SMBs and large corporations (Slide 10).
- The founding team includes the founder of Loginsa and an expert with 8 years of experience as a GIS Market Research CEO (Slide 11).
- The funding ask is $800,000, following a previous raise of $440,000 (Slide 12).
The InstaGIS Pitch Deck: A Masterclass in Social Proof
InstaGIS, which later evolved into Civic Brain, presents a 13-slide deck that is remarkably focused on the retail and marketing sectors. In 2012, the intersection of 'Big Data' and 'Geographic Information Systems' (GIS) was a burgeoning field. This deck attempts to bridge the gap between complex data science and actionable marketing insights. By focusing on the 'where' of consumer behavior, InstaGIS positions itself as an essential tool for any brand looking to optimize its physical and digital footprint.
Slides 1-3: The Hook and the Problem
Slide 1: Title Slide The deck opens with a clean logo and a tagline: "We know the what about the who... Everywhere." Crucially, the bottom of the slide features the logos of Unilever, Walmart, and Kimberly-Clark. This is a high-conviction move; by placing these logos on the very first slide, the founders are telling investors that their solution is already being used or vetted by the world's largest retailers.
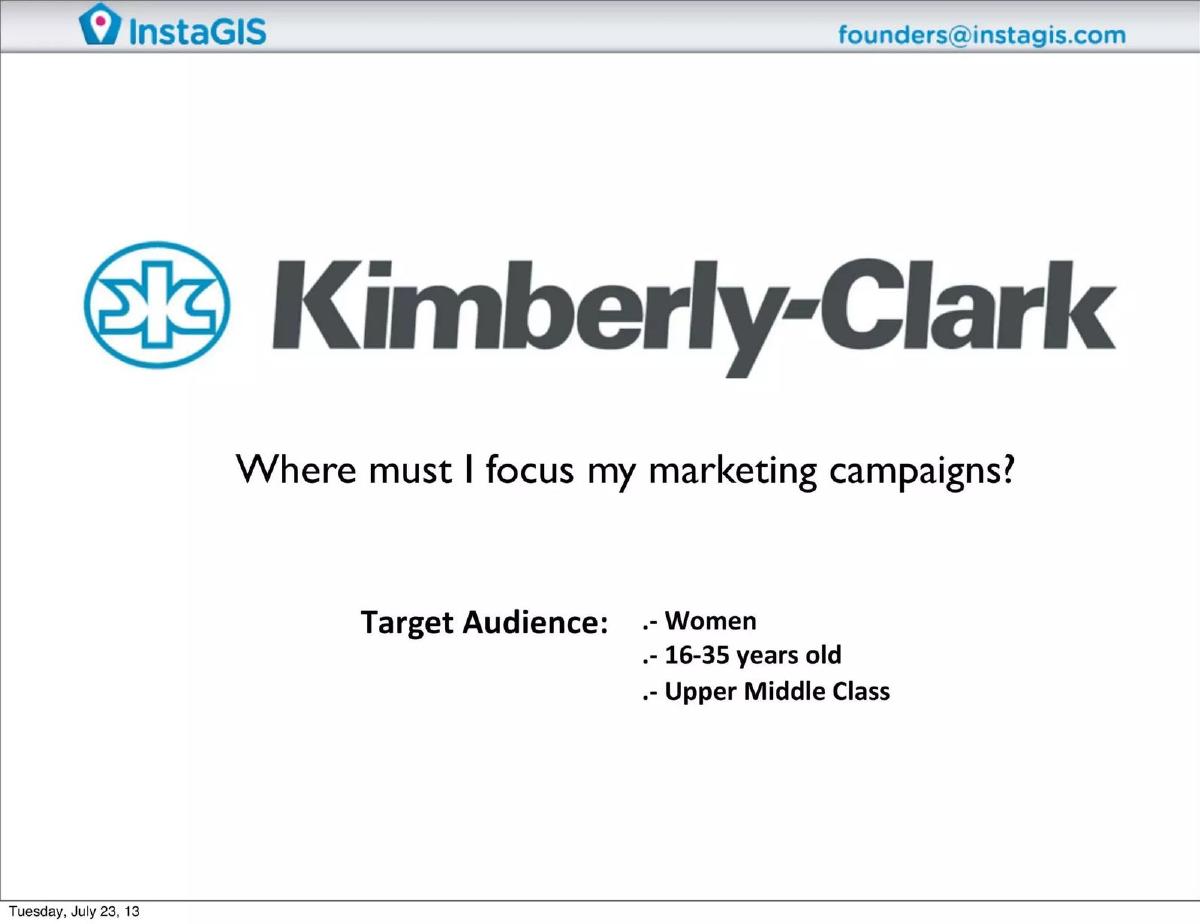
Slide 2: The Kimberly-Clark Use Case Instead of a generic problem statement, Slide 2 uses a specific example. It poses the question for Kimberly-Clark: "Where must I focus my marketing campaigns?" It defines a target audience: Women, 16-35 years old, Upper Middle Class. This makes the abstract concept of 'geographic intelligence' immediately tangible.
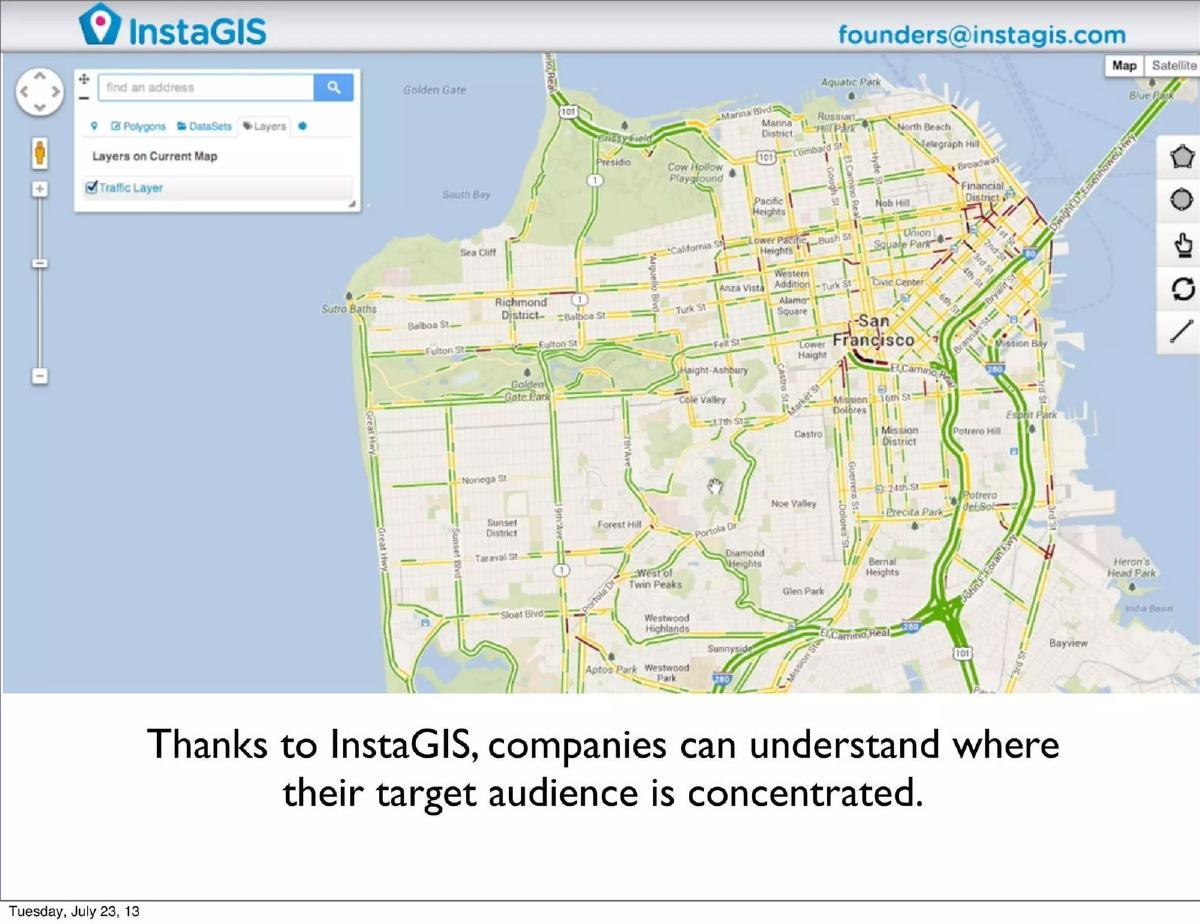
Slide 3: The Solution Visualization Slide 3 shows a map of San Francisco with a traffic layer. The text states, "Thanks to InstaGIS, companies can understand where their target audience is concentrated." This is the 'Aha!' moment of the deck, showing the product's ability to visualize demographic data on a map.
Slides 4-6: Market Opportunity and Traction
Slide 4: The Value Proposition InstaGIS cites McKinsey & Company to claim that efficient use of information can enable the retail industry to increase its operating margin by 60% . This is a bold claim, and by anchoring it to a reputable consulting firm, they add a layer of professional validation to their pitch.
Slide 5: Revenue and Traction This is arguably the strongest slide in the deck. It displays $160K revenue in 8 Months in large green text. To the right, it repeats the logos of Unilever, Walmart, and Kimberly-Clark. For a seed-stage company in 2012, $20k MRR (average) with these specific logos is an exceptional indicator of product-market fit.
Slide 6: Market Size The deck cites esomar.org to state that companies spend $33.5 Billion in market strategies to attract customers. While this is a large number, the slide is a bit vague on how much of that is the specific Serviceable Addressable Market (SAM) for GIS software, focusing instead on the broad category of marketing spend.
Slides 7-9: Product and Data Sources
Slide 7: Use Cases This slide breaks down the utility of the platform into three icons: Evaluate locations, Find new markets, and Optimize Customer Outreach. It clarifies that the data is available at the neighborhood, city, state, and world levels.
Slide 8: Heat Mapping Slide 8 provides a full-page visualization of a heat map over San Francisco. It reinforces the tagline from the cover: "We know the what about the who... everywhere." The visual suggests a high density of data points, though it doesn't specify exactly what the 'heat' represents in this specific view.
Slide 9: The Data Engine This slide explains the 'how.' InstaGIS indexes data from:
Government: US Census, Dept. of Justice, and Chilean government data. · Social Networks: Facebook, Foursquare, Instagram, and Twitter. · Private Sources: Gnip, Topsy, Factual, and the client's own CRM data.
This illustrates a sophisticated backend capable of merging public demographic data with real-time social sentiment.
Slides 10-13: Business Model, Team, and Ask
Slide 10: Revenue Model The company confirms a SaaS model with a monthly subscription fee. They specify a focus on both SMB and Big Companies, which suggests a scalable pricing tier, though specific price points are omitted.
Slide 11: The Team The team slide is strong on industry experience:
Fernando Ovalle: Founder of Loginsa, described as the biggest logistics company in Chile. · Ignacio Canals: Expert in Enterprise SaaS. · Julian Garcia: 8 years as CEO of a GIS Market Research Company.
The advisors include Gary Iwatani (Co-founder of Topsy) and Stew Langille (Co-founder of Visual.ly and former VP Marketing at Mint), providing significant Silicon Valley pedigree.
Slide 12: The Ask The company is seeking $800,000 . They note they have previously raised $440,000 . The funds are earmarked for "Customer acquisition and Worldwide data sets integration."
Slide 13: Closing The deck ends with a repeat of the cover slide, reinforcing the branding and the core tagline.
What Works in This Deck
Immediate Credibility: By leading with enterprise logos and revenue figures, InstaGIS bypasses the skepticism often faced by early-stage startups. They prove that their 'science project' has real commercial value.
Specific Use Cases: The Kimberly-Clark example in Slide 2 is excellent. It moves the conversation from "we have a map tool" to "we help you find 25-year-old wealthy women to buy your products."
Data Transparency: Slide 9 is vital. In the world of 'Big Data,' investors want to know where the data comes from. Listing specific APIs and sources like Gnip and the Census Bureau builds technical trust.
What is Missing
Competitive Analysis: There is no mention of competitors. In 2012, companies like Esri were dominant, and social listening tools were proliferating. InstaGIS doesn't explicitly state why their 'indexing' is superior to existing GIS solutions.
Unit Economics: While they show $160k in revenue, they don't show the cost to acquire those customers (CAC) or the churn rate. For a SaaS pitch, these metrics are usually expected to justify an $800k round for 'customer acquisition.'
Product Depth: The deck shows maps but doesn't show the actual user interface or the 'Civic Brain' dashboard. Investors are left to wonder if the product is a finished platform or a manual consultancy service using internal tools.
What a Founder Should Copy
The 'Logo First' Strategy: If you have blue-chip customers, do not hide them on slide 10. Put them on the cover. It changes the entire tone of the meeting from 'pitching' to 'explaining a success story.'
The McKinsey Anchor: Using a third-party stat (Slide 4) to quantify the potential ROI for a customer is a powerful way to justify high contract values. It shifts the product from a 'nice-to-have' to a 'margin-builder.'
Simple Ask: Slide 12 is a model of clarity. It states the amount, the history, and the two primary goals for the capital. It avoids the 'use of funds' pie chart which is often ignored by investors in favor of high-level strategic goals.
Frequently asked questions
- What is the primary problem InstaGIS solves?
- InstaGIS addresses the difficulty companies face in identifying exactly where their target audiences are located. By using geographic intelligence, they help brands like Kimberly-Clark determine where to focus marketing campaigns to reach specific demographics, such as women aged 16-35 in the upper middle class, thereby reducing wasted ad spend and increasing engagement.
- How does InstaGIS source its data?
- The platform aggregates data from three primary pillars: Government (US Census, Department of Justice, and international data), Social Networks (Facebook, Foursquare, Instagram, Twitter), and Private Sources (Gnip, Topsy, Factual, and the client's own CRM data). This multi-source approach allows for a comprehensive 'heat map' of consumer activity and sentiment.
- What is the company's business model?
- InstaGIS utilizes a standard Software-as-a-Service (SaaS) model. They charge a monthly subscription fee and target a wide range of clients, from Small and Medium Businesses (SMBs) to large 'Big Company' enterprises, specifically within the retail and marketing sectors.
- What traction did the company show at the time of the deck?
- The company demonstrated significant early-stage traction, reporting $160,000 in revenue earned over an eight-month period. Additionally, they listed high-tier enterprise clients and partners, which serves as a powerful validation of their product-market fit in the competitive retail analytics space.
- What are the main omissions in this pitch deck?
- The deck lacks a formal competitive landscape slide, failing to show how they differ from established GIS players like Esri or newer social analytics tools. It also omits detailed financial forecasts, unit economics (LTV/CAC), and a specific roadmap for the 'Worldwide data sets integration' mentioned in the funding ask.