iON's 12-slide deck, assembled with pdftk and dated 8 October 2018, pitches hosted phone systems and SMB back-office software sold through a channel of Local Computer Companies. It carries something almost no seed deck carries: 25 consecutive months of actual invoiced revenue and actual cost of sales, summing to roughly $50,525 against $13,805, which verifies the claimed 72% gross margin and a positive $13,200 of operating income. None of it is converted into an investment case. There is no ask — no amount, no instrument, no valuation, no use of funds and no close date. The business model sli…
Key takeaways
- iON's 12-slide October 2018 deck contains something almost no seed deck does — 25 consecutive months of actual invoiced revenue and actual cost of sales, summing to roughly $50,525 against $13,805, which confirms the claimed 72% gross margin to within a percentage point.
- Despite that evidence, the deck has no ask of any kind: no amount, no instrument, no valuation, no use of funds and no close date. It ends on slide 12 with 'Thank You' and a phone number.
- The business model slide is headed 'How our partners (LCC) profit' and explains only the reseller's economics — 30% upfront per phone and $1.00 per phone per month for 24 months — while never stating what iON charges an SMB or keeps per seat.
- The market slide states that SaaS grew from $35bn in 2016 to $43bn in 2017 and calls it 28.6% growth; the correct figure is 22.9%, an error visible in four seconds on a slide made entirely of numbers.
- The financial comparison table places iON's $30,000 of revenue beside Vonage's $1,002,286 in identical formatting, with the disclaimer that competitor figures are in thousands and iON's are actual dollars set in the smallest type on the page.
- The five-year forecast reads 'our predicted five year Share of Market (SOM) will reach around 2-10Million' — a revenue figure mislabelled as market share, expressed as a five-fold range, with no seats, ARPU, partner count or churn behind it.
- The competition pie chart's largest slice is 'Others' at 91%, and the incumbent iON actually displaces — legacy analogue phone service — does not appear on the chart at all.
- The deck's strongest strategic asset, co-founder Justin Dahlin's 18 years owning a Local Computer Company (the exact channel iON sells through), is presented as an italic caption on slide 9 of 12.
What this deck actually is
Twelve slides, 794 x 446 points — a widescreen ratio close to 16:9 — assembled and flattened with pdftk 1.44 and stamped 8 October 2018 . The file is 1.06 MB. It is a seed-stage investor deck for iON , a two-person Idaho software company selling hosted phone systems and back-office software to small and medium businesses through a reseller channel of Local Computer Companies.
The unusual thing about this deck is that it contains something almost no early-stage deck contains: 25 consecutive months of actual invoiced revenue and actual cost of sales, plotted month by month . Not a projection curve. Not a hockey stick. Real trailing numbers from a real operating business, and they add up — total invoiced across the 25 months is roughly $50,525 against $13,805 of cost of sales, which is a 72.7% gross margin and confirms the "Averaging 72% GPM" claim printed beside the chart. A founder who publishes his own cost line, unrounded, and lets it be checked is doing something rarer than most pitch coaches admit.
And then the deck spends its remaining eleven slides undermining that credibility. There is no ask. No amount, no instrument, no valuation, no use of funds, no close date, no runway. There is no customer count, no partner count, no churn, no ARPU, no pricing. The business model slide explains how the reseller makes money and never says how iON makes money. The market slide contains an arithmetic error. The financial slide places a $30,000 company in the same table as a $1 billion company using two different units, with the disclaimer set in the smallest type on the page.
Slide 12 says "Thank You" and gives a phone number. That is the close.
Slide-by-slide walkthrough
Slide 1 — Cover
A large iON wordmark, a blue orbital ellipse, and the tagline " Helping business grow ". Nothing else. No one-line description of what the company does, no date, no location, no "Seed round, October 2018", no contact.
"Helping business grow" is a category-free phrase — a bank, an accountant, a marketing agency or a cloud PBX could all print it. The cover of an investor deck has one job: make the reader able to describe the company to a colleague after three seconds. This one cannot be described at all, and the reader arrives on slide 2 with no frame to hang anything on. The singular "business" instead of "businesses" is also a typo that appears on the very first line of the document, which is where a careful reader calibrates how careful the rest will be.
Slide 2 — Company Purpose
One sentence: "To be the primary provider of software services for small to medium business (SMB), including time-clocks, phones, after hours scheduling, dictation, cellphone integration, and physical faxing ."
Six product lines, from a company with two people and roughly $30,000 of annual revenue. Each of those six is a real software market with real incumbents — time clocks compete with Deputy and When I Work, dictation with Dragon and Rev, faxing with eFax and SRFax, phones with everyone on slide 8. A two-person team cannot build, sell and support six categories, and no slide later in the deck says which one is the wedge.
The word "primary" compounds it. Primary provider of six software categories to the entire SMB market is an ambition roughly the size of Intuit's. An investor reading it alongside a $30,000 revenue line does not conclude that the founders are ambitious; they conclude the founders have not chosen. The deck's own financial chart shows a phone business. The purpose slide describes something else.
Slide 3 — Problem
"Many small / medium businesses have limited resources. We provide the extra services that most small businesses can't afford at an affordable price." The examples list then adds a seventh product line the purpose slide did not mention: burglar alarm systems .
The problem statement is really a pricing claim wearing a problem's clothes. It says SMBs cannot afford things and iON is affordable, which is a positioning sentence, not a diagnosis. The actual problem — legacy analogue phone systems are expensive to maintain, tie SMBs to long carrier contracts, and cannot do the things a modern owner expects — is visible in the deck's later slides but never stated here.
What is missing is any evidence that the problem exists at the scale claimed. No customer quote. No survey. No dollar figure for what an SMB currently overpays. No number of businesses affected. "Many" and "most" are doing all the quantitative work on a slide whose entire purpose is to be quantitative. iON has had paying customers for 25 months; the deck could have said "our average customer was paying $X and now pays $Y" and it does not.
Slide 4 — Business Model
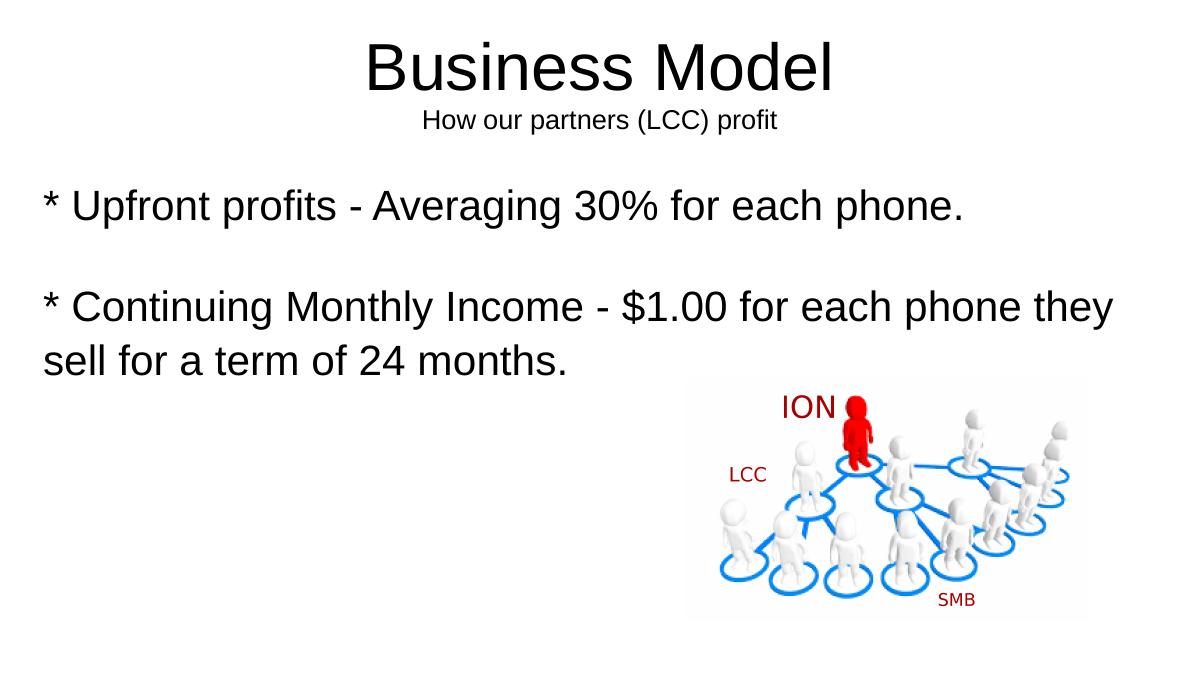
This is the slide with the deepest structural problem in the deck, and it is not obvious at first glance because the slide is well organised and clearly drawn. The header underneath the title reads:
Upfront profits — averaging 30% for each phone . · Continuing monthly income — $1.00 for each phone they sell for a term of 24 months .
The business model slide describes the reseller's business model, not iON's. After reading it, an investor knows precisely what a Local Computer Company earns and still has no idea what iON charges an SMB per seat, what iON keeps after paying the 30%, what a phone costs iON to source, what the hosting cost per seat is, or how long a customer stays. Every number an investor needs to value the company is absent; every number a channel partner needs to sign up is present.
That tells you what this deck actually was before it became a pitch deck. It reads as a partner recruitment deck lightly repurposed for investors — which explains the reseller-centric model slide, the endorsement framing on slide 5, and the absence of an ask. It is a common and expensive mistake: the sales deck already exists, it already works on the audience it was built for, and converting it feels cheaper than writing a new one. It is not.
The $1.00 per phone per month residual is also worth pausing on. A dollar a month for 24 months is $24 of lifetime channel cost per phone . If iON's own revenue per phone is in the $20–30 per month range typical of hosted VoIP in 2018, the residual is roughly 3–5% of revenue — cheap. But the 30% upfront on hardware is not cheap, and the deck never nets the two together. A reader cannot compute channel-adjusted gross margin from this slide, and channel-adjusted gross margin is the entire question in a reseller-led business.
Slide 5 — Solution
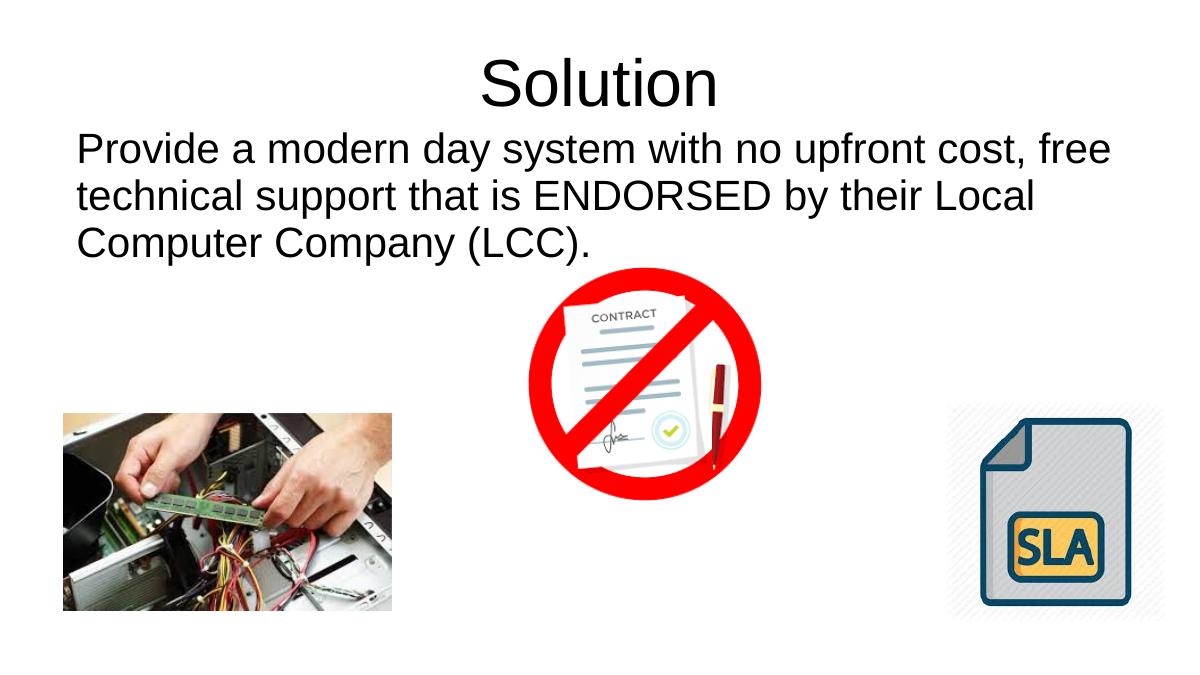
"Provide a modern day system with no upfront cost , free technical support that is ENDORSED by their Local Computer Company (LCC)." Beside it: a photograph of hands installing RAM in a motherboard, a document marked CONTRACT with a red prohibition sign over it, and a file icon labelled SLA.
The three icons make three commercial promises — no upfront cost, no contract, and a service-level agreement — and two of them contradict other slides.
First, "no upfront cost" sits one slide after the partner earns "upfront profits — averaging 30% for each phone". Someone is paying for that phone upfront, and if it is not the customer then it is iON, financing hardware off a $30,000 revenue base. That is a working-capital problem large enough to be the reason for the round, and the deck neither acknowledges it nor uses it. A single line — "each deployed seat costs us $X in hardware we recover over Y months, which is what this raise funds" — would have converted a contradiction into the strongest argument in the file.
Second, the crossed-out CONTRACT is at odds with the "term of 24 months" on the partner residual. If there is no customer contract, the 24-month residual is an assumption about retention, not a term — and a churn rate the deck does not disclose is therefore load-bearing for the only lifetime-value number in the document.
Third, "free technical support" is stated as a feature with no cost attached. Free support in a two-person company is the founders' nights. It does not scale, and the deck's own $600–800 monthly fixed expense line proves nothing has been budgeted for it.
The word "ENDORSED", capitalised, is the genuinely good idea on this slide and the deck does not defend it. Buying a phone system from a stranger is a risk an SMB owner cannot evaluate; buying it because the computer guy who has fixed your servers for nine years vouches for it removes that risk entirely. That is a real distribution insight. It needs a number beside it — how many LCCs have signed, what the average close rate is with an endorsement versus without, how long the sales cycle is. It gets none.
Slide 6 — Why Now
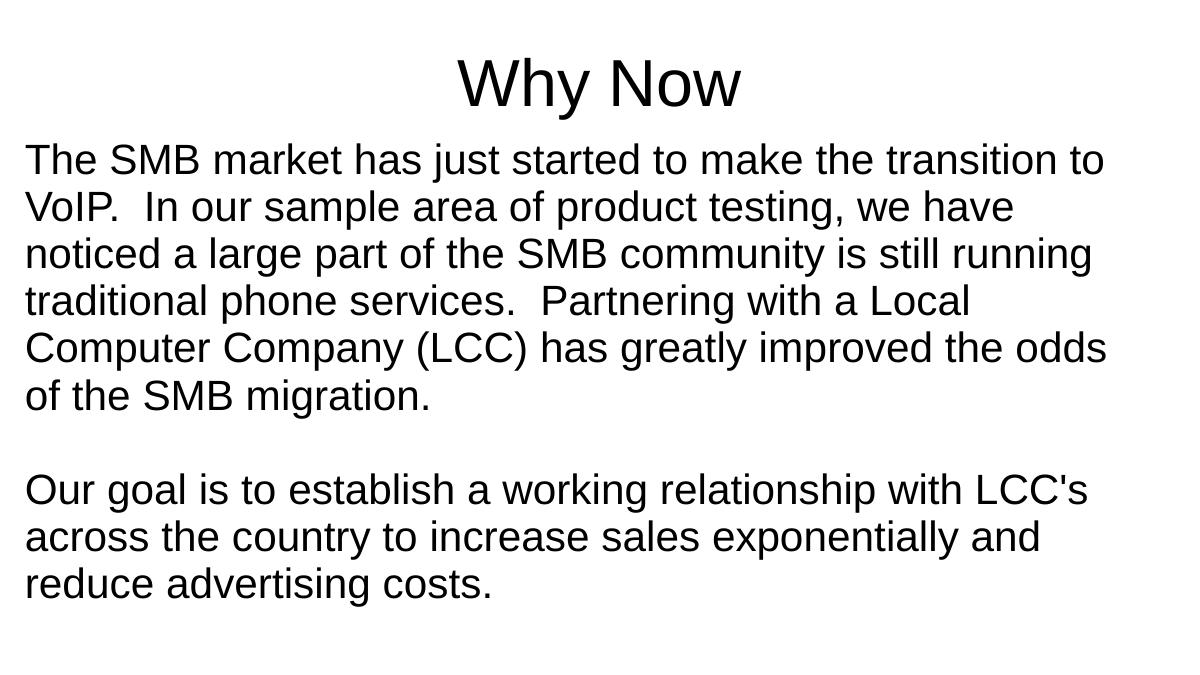
"The SMB market has just started to make the transition to VoIP. In our sample area of product testing, we have noticed a large part of the SMB community is still running traditional phone services."
The timing claim is weak on the facts. By late 2018 the SMB VoIP transition was not starting; it was well advanced. RingCentral had been public for five years, 8x8 for longer, and hosted PBX was a mature category. Telling investors in 2018 that this shift has "just started" invites them to conclude the founders are describing their own county rather than the market. Which, per the next sentence, they are.
"In our sample area of product testing" is the most honest phrase in the deck and it is used in the worst possible place. It concedes that the evidence base is one local geography, on the slide whose job is to argue national timing. And it is entirely unquantified — how many businesses in the sample, what share still on analogue, over what period. iON has 25 months of real field data and reports it as "we have noticed".
The strategic sentence is the second paragraph: partnering with LCCs "has greatly improved the odds of the SMB migration" and the goal is to establish relationships with LCCs across the country to "increase sales exponentially and reduce advertising costs". This is the closest the deck comes to a growth plan. It has no numbers in it at all — no LCC count today, no target count, no cost per LCC recruited, no revenue per LCC, no CAC comparison between channel and direct despite explicitly claiming reduced advertising costs.
Slide 7 — Market Size
The VoIP figure — "Current market size is at 27Billion with an expected growth of 10% annually", attributed to IBISWorld — is at least sourced to a named research house, which puts it ahead of most seed decks.
The SaaS figures are not. "Market 2016 Revenue $35Billion / Market 2017 Revenue $43Billion / 28.6% growth ", attributed to BusinessWire. $35bn to $43bn is 22.9% growth, not 28.6%. The likely origin of the error is a transposition — 22.86% becoming 28.6% — and it is the kind of mistake that is fatally cheap. It takes an investor four seconds and no domain knowledge to catch, it appears on a slide whose only content is arithmetic, and once caught it retroactively puts the 72% GPM claim and the whole financial chart under suspicion. The most valuable asset in this deck is the credibility of its real numbers, and a lazy percentage on the market slide is what spends it.
There is also a category error underneath the arithmetic. iON is claimed to reside "in both the VoIP and the SaaS market", so the deck sizes both — but these are not two addressable markets to be admired side by side, they are overlapping descriptions of the same product. More importantly, neither number is deflated to anything iON can serve. There is no US SMB segment, no share of businesses in the target geographies, no serviceable figure. A $27 billion TAM next to $30,000 of revenue is a ratio of 900,000 to one, and a reader who is given no intermediate number has to invent one, which they always do unkindly.
Slide 8 — Competition
A pie chart titled "Competition Share of Market (SOM) 2017": Vonage 5%, RingCentral 2%, 8x8 1%, Jive 0.5%, Ooma Office 0.5%, Others 91% . The caption reads "There are currently a lot of companies in the sector but no single company dominates the market."
The conclusion is correct and the chart is the wrong way to reach it. 91% of the pie is a slice labelled "Others", which means the chart's dominant visual element is an admission that the deck has not analysed the market. The named competitors are the five public companies whose figures are easy to find; everything else — regional carriers, incumbent telcos, other channel-led providers, the analogue systems iON is actually replacing — is one undifferentiated wedge. And the deck's own thesis is that the real competitor is legacy analogue service, which does not appear on the chart at all.
Two further issues. The internal consistency is shaky: taking the deck's own revenue figures from slide 11 against a $27bn market, Vonage's $1.0bn is roughly 3.7%, not 5%, and RingCentral's $140.5m is roughly 0.5%, not 2%. Two of the five slices do not reconcile with the deck's own next slide, most likely because the revenue table mixes annual and quarterly filings.
And "SOM" is misused. SOM means Serviceable Obtainable Market — the portion of a market a specific company can realistically win. Here it is used to mean market share, and on slide 11 it is used again to mean revenue ("our predicted five year SOM will reach around 2-10Million"). Three slides, one acronym, two wrong definitions. Investors read acronym misuse as a proxy for how much of the surrounding analysis is borrowed rather than understood.
Most damaging of all: there is no differentiation content anywhere on the competition slide. No feature comparison, no price comparison, no reason a customer picks iON over RingCentral. The single strongest answer iON has — the LCC endorsement, the local technician who already has the customer's trust — belongs here, and it is two slides away and unquantified.
Slide 9 — Team
Brandon Shults — "Engineer by trade, 32 years of programming, 15 years of network administration and 10 years of IT Management." · Justin Dahlin — "Over 25 years of working with computers and 18 years of Owning and Operating a Local Computer Company (LCC)."
Justin's line is the single best-argued sentence in the deck, and the deck knows it: the italic note beneath says his LCC ownership "will play a significant role in helping us understand and work with our target audience." That is exactly right. The company's entire distribution strategy is selling through Local Computer Companies, and one of the two founders has run one for eighteen years. The channel thesis is not a hypothesis; it is a founder's résumé. That should be the loudest claim in the file. It is a caption on slide 9 of 12.
What is missing is everything an investor needs beyond tenure. No titles, so no one knows who is CEO. No named employers or companies, so nothing is checkable — no LinkedIn, no GitHub, no company names attached to those 32 and 25 years. No indication whether either founder is full-time or still working the day job. No equity split. No advisors, no board. And no salesperson: the deck's growth plan is recruiting LCCs across the country, and neither of the two people listed has a sales background.
Tenure is also a weaker signal than the founders think. "32 years of programming" tells a reader the founder is experienced and probably in his late forties or fifties; it does not tell them he has shipped a multi-tenant hosted telephony platform, which is the actual question. Two shipped-product sentences would have outperformed 57 combined years of stated experience.
Slide 10 — Two Year Financial Growth
The best slide in the deck. A monthly chart of cost of sales as blue bars against invoiced revenue as an orange line, with the notes "Averaging 72% GPM" and "Fix expenses: averaging $600-$800 per month".
The numbers are real and they hold up. Summed across the series, invoiced revenue is approximately $50,525 and cost of sales approximately $13,805 , giving a gross margin of 72.7% — the claimed 72% is accurate. Monthly invoiced revenue rises from $150 in month 1 to $3,425 in the final month, a 22-fold increase , and the trailing twelve months total roughly $32,150 , which is consistent with the $30,000 figure on slide 11. Nothing here is inflated. Two founders with $600–800 of monthly fixed cost built a business generating $3,400 a month at a 72% margin, and they showed the working.
Now the problems, all of them presentation rather than substance.
The title says two years; the x-axis has 25 points. A trivial inconsistency, but it is on the slide that has to be beyond question.
The axis is labelled "Dollars" and the months are labelled 1 to 25 with no dates. A reader cannot tell whether month 25 is September 2018 or eighteen months stale, and in a deck dated October 2018 that matters — the newest data point is the only one an investor cares about.
The chart plots invoiced revenue against cost of sales and calls the result "growth", while the fixed expense figure sits in the margin as text. Gross profit and net profit are never drawn. Taking the final month at face value — $3,425 invoiced, $900 cost of sales, $600–800 fixed — the business nets roughly $1,700–1,900 a month. That is a real, positive, bootstrapped net profit and it deserves its own line on the chart. Instead the reader has to compute it.
Month 8 spikes to $2,925 and month 9 falls back to $1,500. That is either a one-off hardware sale or a lumpy install, and it is unannotated. Unexplained spikes on a revenue chart make a reader wonder how much of the trend is repeatable — precisely the wrong question to provoke on a slide about a recurring-revenue business. Which raises the deepest omission: the deck never separates recurring subscription revenue from one-off hardware revenue. For a company pitching hosted software, MRR is the number, and the word does not appear anywhere in the file.
Slide 11 — Financial
A five-row comparison table — Ooma, 8x8, RingCentral, Vonage and Ion — across revenue, cost of revenue, gross profit margin, gross profit, SG&A, R&D, operating income and a final ratio column. Beneath it: "Our predicted five year Share of Market (SOM) will reach around 2-10Million while keeping a stronghold of our positive net profits." Beneath that, in the smallest type on the slide: " Numbers were pulled from public records and expressed in Thousands, except Ion's numbers. Ion's numbers are expressed in Actual Numbers. "
Two different units in one table is the most serious presentation failure in the deck. Vonage's row reads $1,002,286.00 and means $1.0 billion. iON's row reads $30,000.00 and means thirty thousand dollars. Side by side, in identical formatting, in the same column, iON appears to be a company one thirty-third the size of Vonage. It is a company one thirty-three-thousandth the size. The disclaimer is present and honest — nobody is hiding anything — but it is set in the smallest type on the page beneath a full-width sentence about market share, and a reader skimming at investor speed will not find it before forming an impression the table's design has already created. Two columns of a normalised ratio would have made the same argument without the risk.
The comparison itself is also arguing against the company. The table's real finding is that iON is the only profitable row — operating income of $13,200 against operating losses at Ooma, 8x8 and RingCentral — which is a legitimately interesting fact. But putting a $30,000 business in a table with three public companies invites exactly the comparison iON loses. The peers are not competitors; they are outcomes. Framing this as "here is the margin structure of the category, and here is ours at 1/33,000th the scale" would have preserved the insight and dropped the exposure.
The final column is mislabelled. It is headed "Gross Profits / Operating Expenses", but iON's figure of 38.89% is $8,400 of operating expense divided by $21,600 of gross profit — the ratio is inverted relative to its own heading , and the same inversion applies to every row. Ooma's 117.47% is likewise opex over gross profit. The metric is meaningful and the label is backwards.
Then the forecast sentence, which is where the slide stops being an accounting problem and becomes a credibility one. " Our predicted five year Share of Market (SOM) will reach around 2-10Million " contains three separate failures in nineteen words. It calls a revenue figure a share of market. It gives a range with a five-fold spread , which is not a forecast but an admission that no model exists. And it attaches no assumptions — no seats, no ARPU, no LCC count, no churn — to a projection asking the reader to believe in growth of between 67x and 333x from a $30,000 base.
Slide 12 — Thank You
The Ion Office Dialer logo, a Grandstream XPhase handset, screenshots of a calendar and time-clock interface, and contact details: Brandon Shults, brandon@iondevelopment.net, ionintegratedsystems.com, 208-717-3883.
The product appears for the first time on the final slide. Eleven slides describe a software company in words; slide 12 is the first and only visual evidence that software exists. The time-clock screenshot in particular is proof of a shipped second product line — the one named first in the company purpose — and it is a thumbnail on the thank-you page.
The branding also fragments here. The cover says iON . The financial table says Ion . This slide says Ion Office Dialer . The email domain is iondevelopment.net and the website is ionintegratedsystems.com . Five variants across twelve slides, and two different domains on one line. Small, but investors read inconsistent naming as a signal about operational discipline, and it is free to fix.
And the deck ends without asking for anything. No amount, no use of funds, no next step, no meeting request. A reader who has just been convinced by the 72% gross margin has nothing to do with that conviction except call a phone number and ask what iON wants.
What this deck does better than most startup pitch decks
It shows 25 months of real, audited-looking operating data. Actual invoiced revenue and actual cost of sales, month by month, unrounded, with a margin claim that checks out to within a percentage point when you sum the series. The overwhelming majority of seed decks show a projection curve and nothing else. · It is profitable and says so with a number. Operating income of $13,200 on $30,000 of revenue, with fixed expenses disclosed at $600–800 a month. Not "we are capital efficient" — an actual figure that can be divided. · The distribution insight is genuine and founder-backed. Selling hosted phones through the local computer technician who already has the SMB's trust is a real answer to the hardest problem in SMB software, and one founder has run that exact type of business for eighteen years. · The competitive conclusion is honest. "No single company dominates" is true of SMB VoIP in 2017, and the deck resists the standard temptation to claim the incumbents are asleep. · The VoIP market figure is sourced. IBISWorld is named. Most decks at this stage cite nothing at all. · The channel economics are specific. 30% upfront and $1.00 per phone per month for 24 months is a precise, checkable commercial term, not a vague promise of partner value.
Where this deck would fail in an investor meeting
There is no ask. Twelve slides, no amount, no instrument, no valuation, no use of funds, no close date. Nothing to accept or decline. · The business model slide never says how iON makes money — only how the reseller does. No pricing, no ARPU, no seat economics. · Six to seven product lines for two people. No wedge is named, and the financial chart describes a phone business the purpose slide barely mentions. · A visible arithmetic error on the market slide. $35bn to $43bn is 22.9%, not the stated 28.6%, on a slide made only of numbers. · Two units in one financial table. Competitors in thousands, iON in dollars, disclaimed in the smallest type on the page. · A 2–10 million five-year forecast with a five-fold range and no assumptions , mislabelled as Share of Market. · No customer count, no partner count, no churn, no MRR, no CAC. The deck has 25 months of operations and reports none of the operating metrics that come with them. · "No upfront cost" contradicts "upfront profits — averaging 30% for each phone" , and the deck never says who carries the hardware cost. · 91% of the competition pie is "Others" , and the incumbent the company actually displaces — analogue phone service — is not on the chart. · The team slide is tenure without evidence: no titles, no company names, no links, no full-time status, no salesperson. · The product appears once, as thumbnails, on the final slide. · Five brand variants and two domains across twelve slides.
Who makes money? The partner The company Answers the partner: 30% upfront, $1/phone/month
Pricing Partner margin Customer ARPU and unit economics Neither ARPU nor customer price appears
Proof Product works, support is free Retention, MRR, churn, cohort behaviour Gross revenue and cost of sales only
Scale story More partners Cost per partner, revenue per partner, payback "LCCs across the country", no counts
The close Sign the partner agreement Amount, instrument, use of funds, timeline "Thank You" and a phone number
How you would rebuild this deck
Lead with the chart. Slide 2 should be the 25-month revenue and margin series with dates on the axis, gross profit drawn as a third line, and one sentence: "Two founders, $600–800 a month of fixed cost, 72% gross margin, profitable since month one of year two." Everything else in the deck is a footnote to that. · Put the ask on slide 3. Amount, instrument, what it buys, by when. If the round finances hardware working capital and the first two channel hires, say so in numbers: "$250,000 to deploy X seats and sign Y LCCs, reaching $Z of MRR by Q4 2019." · Rewrite the business model slide from iON's side. Price per seat, seats per customer, monthly revenue per customer, hardware cost, channel cost, hosting cost, contribution margin per seat, payback period. Keep the partner economics as a sub-panel. · Report MRR, not invoiced revenue. Split recurring subscription from one-off hardware, and annotate the month-8 spike. For a hosted software business, the recurring line is the only one that gets a multiple. · Pick one product. Lead with hosted phones, because that is what the revenue chart describes, and demote time clocks, dictation, faxing, scheduling and alarms to a roadmap strip. "Primary provider" of six categories reads as unfocused at $30,000 of revenue. · Promote the LCC channel to its own slide, with counts. LCCs signed to date, seats sold per LCC, close rate with an endorsement versus without, sales-cycle length, cost to recruit one LCC, and how many exist in the target region. This is the whole company; give it a page and give it numbers. · Fix the market slide. Correct 28.6% to 22.9% or drop the SaaS panel entirely, then deflate the $27bn VoIP TAM in two steps — US SMB seats, then the geographies iON's channel can reach — landing on a serviceable number in the tens of millions that $30,000 can be honestly located inside. · Rebuild the competition slide around the real incumbent. Analogue phone service and the incumbent carrier, not five public companies and a 91% "Others" wedge. Compare on price, install time, contract terms and who the customer calls when it breaks — the axis iON actually wins. · Normalise the financial table or delete it. If it stays, express every row in the same units and show margin percentages rather than absolute dollars, so the comparison is structural rather than a scale humiliation. Fix the inverted opex-to-gross-profit label. · Replace the "2-10Million" forecast with a built-up model. LCCs signed × seats per LCC × ARPU × retention, over five years, with the assumptions visible. One number with working beats a five-fold range every time. · Give the team slide evidence. Titles, company names, links, full-time status, equity split — and name who is going to sell, since recruiting LCCs nationally is the entire plan. · Show the product by slide 4. The dialer, the time clock and the scheduling interface exist; the screenshots are already in the file, buried on the thank-you page. · Standardise the name. One spelling, one logo, one domain across all twelve slides.
The transferable lesson
iON's deck fails in a way that is almost the exact inverse of the usual failure. Most seed decks have a beautiful story and no evidence. This one has evidence — 25 months of real invoiced revenue, a verifiable 72% gross margin, positive operating income, and a distribution strategy backed by eighteen years of one founder's working life — and no story, no framing, and no request. The facts are on the slides. The argument they support is never made out loud.
The specific mechanism is worth naming, because it is common and it is cheap to avoid: this is a channel-recruitment deck wearing an investor deck's clothes. The business model slide answers "how do you profit" from the partner's point of view. The solution slide sells an endorsement. The deck closes with a phone number instead of an ask. Every one of those is right for a Local Computer Company deciding whether to resell, and wrong for an investor deciding whether to wire money. When you already have a deck that works on one audience, converting it is tempting and almost always produces a document that half-serves both.
The second lesson is about what a small real number is worth. Founders with $30,000 of revenue often feel the number is too small to lead with, so they lead with a $27 billion market instead — and in doing so they trade their only defensible asset for their least defensible one. $30,000 earned at a 72% margin by two people with $700 a month of overhead is a far stronger opening than a market figure any competitor could copy. It proves the product works, the channel converts, customers pay and the founders can operate. The market slide proves nothing about iON at all.
And the third is the cheapest of all: protect the credibility of your real numbers. This deck's genuine, checkable, hard-won financial data sits two slides away from a percentage that is wrong by six points and a table that mixes dollars with thousands. An investor who catches either one stops trusting arithmetic, and the moment arithmetic is in question, the 72% gross margin — the best fact this company owns — stops counting for anything. The deck earned its credibility on slide 10 and spent it on slides 7 and 11.
Frequently asked questions
- Is the iON deck a real investor pitch deck?
- It is structured as one — company purpose, problem, business model, solution, why now, market size, competition, team, financials — but it behaves like a channel-recruitment deck. The business model slide explains how reseller partners profit rather than how iON does, and across twelve slides there is no funding amount, no instrument, no valuation, no use of funds and no close date. It ends with 'Thank You' and a phone number rather than an ask.
- What is iON?
- iON is a two-person Idaho software company selling hosted VoIP phone systems and back-office software to small and medium businesses through a reseller channel of Local Computer Companies. The 2018 deck lists time clocks, phones, after-hours scheduling, dictation, cellphone integration, physical faxing and burglar alarms as product lines, and reports about $30,000 of annual revenue at a 72% gross margin with $600-800 of monthly fixed expenses.
- How many slides is the iON pitch deck?
- Twelve slides at 794 x 446 points, close to 16:9, assembled with pdftk 1.44 and dated 8 October 2018. The file is 1.06 MB. The sequence is cover, company purpose, problem, business model, solution, why now, market size, competition, team, two-year financial growth, financial comparison, and a thank-you page carrying the product screenshots and contact details.
- Which iON slides should founders copy?
- Slide 10. It plots 25 consecutive months of real invoiced revenue against real cost of sales, discloses fixed expenses at $600-800 a month, and claims a 72% gross margin that checks out when you sum the series — roughly $50,525 of revenue against $13,805 of cost. Publishing unrounded trailing operating data that a reader can verify is rarer and more persuasive than any projection curve.
- What is the biggest weakness in the iON deck?
- That it never converts real evidence into a proposition. The company is profitable, the margin is verified, and one founder has run the exact type of business the entire distribution strategy depends on — yet the deck asks for nothing, never states its own unit economics, and buries its best facts. A reader finishes it convinced the business works and with no idea what iON wants or what it would cost.
- What is wrong with iON's financial comparison table?
- Two things. It mixes units: Ooma, 8x8, RingCentral and Vonage are stated in thousands while iON is stated in actual dollars, so a $30,000 company appears alongside a $1 billion company in identical formatting, with the disclaimer in the smallest type on the slide. And the final column, headed 'Gross Profits / Operating Expenses', is computed the other way round — iON's 38.89% is $8,400 of operating expense divided by $21,600 of gross profit.