MayaMD's 19-slide deck is, by its own file metadata, a Boston conference presentation later circulated as a pitch deck — and it shows. The technical build slide (25,000 physician hours, 8 years, 8,620 conditions) and the named research partners (Yale, Carnegie Mellon, Boston University, Michigan, UCLA, Utah) are genuinely strong. But there is no team slide, no funding ask, no business model, no revenue and no competition slide; the accuracy claims carry no sample sizes; the market table prints billions as '$4,147 B'; and slide 17 displays individual patient records — village, age, gender, BMI…
Key takeaways
- MayaMD's 19-slide deck is titled 'MayaMD Presentation, Boston 3/27-3/28' in its own file metadata — it is a conference keynote later circulated as a pitch deck, and almost every weakness follows from that reuse.
- There is no team slide anywhere in the deck: no founders, no chief medical officer, no advisors — in a clinical AI company claiming to out-triage physicians.
- There is no funding ask, no valuation, no use of funds, no pricing, no business model, no revenue and no customer count in 19 slides.
- Slide 8 is the deck's real strength: 25,000+ physician hours, 20,000+ developer hours, 8 years of development, 8,620 symptoms and conditions, and under 24 hours to add a new clinical module.
- Slide 9 names Yale, Carnegie Mellon, Boston University, Michigan, UCLA and Utah and shows Maya at 0.94 triage accuracy versus 0.87 for physicians — with no sample size, date, methodology or publication attached.
- Slide 10 asserts 'it lowers readmissions' — a clinical outcome claim — and the supporting data never appears anywhere in the deck.
- Slide 11's market table prints '$4,147 B' and '1,069 B' where billions were meant, two unit errors on the only slide that sizes the opportunity in dollars.
- Slide 17 displays a raw database table of individual patients — village, gender, exact age, BMI and persistent patient IDs beside a clinical finding — in a publicly downloadable file, and its stated 5 + 9 conclusion does not account for all 16 rows.
What this deck actually is
The file is called "MayaMD Presentation, Boston 3/27-3/28". That title is the single most useful piece of context in the whole document, and it is not on any slide — it lives in the PDF metadata. This is a conference presentation, built in Google Slides, prepared for two days in Boston, and later circulated as a pitch deck. Nineteen slides, 16:9, no confidentiality notice, no round name, no date on the cover.
MayaMD is a clinical AI company: a conversational "digital health assistant" that triages symptoms, supports clinicians with evidence-based recommendations, and predicts hospitalisation risk. The product is real, the research partnerships are named and checkable, and the deployment case study — a state-government population health programme in Meghalaya, India — is unusually concrete for a company at this stage.
But read it as an investor and the gaps are structural rather than cosmetic. There is no team slide. There is no funding ask. There is no business model, no pricing, no customer list, no revenue figure, and no competition slide. Nineteen slides describe a capability and a pilot, and then stop. That is exactly what you would expect from a conference keynote — and exactly the problem with reusing a keynote as a fundraising document.
Slide-by-slide walkthrough
Slide 1 — "Meet mayaMD"
A dark cover with an oversized wordmark and the tagline "AI with human experience." It is a good-looking slide and it commits to a positioning: this is not a chatbot, it is meant to feel like a clinician. No date, no round, no company entity, no presenter name.
Slide 2 — "MayaMD is intelligent, predictive, engaging"
Three adjectives plus a line about "the expertise of thousands of doctors with the speed of cutting edge technology." Pure positioning. In a keynote this is a warm-up slide; in a pitch it is a slide an investor forgets before the next one loads.
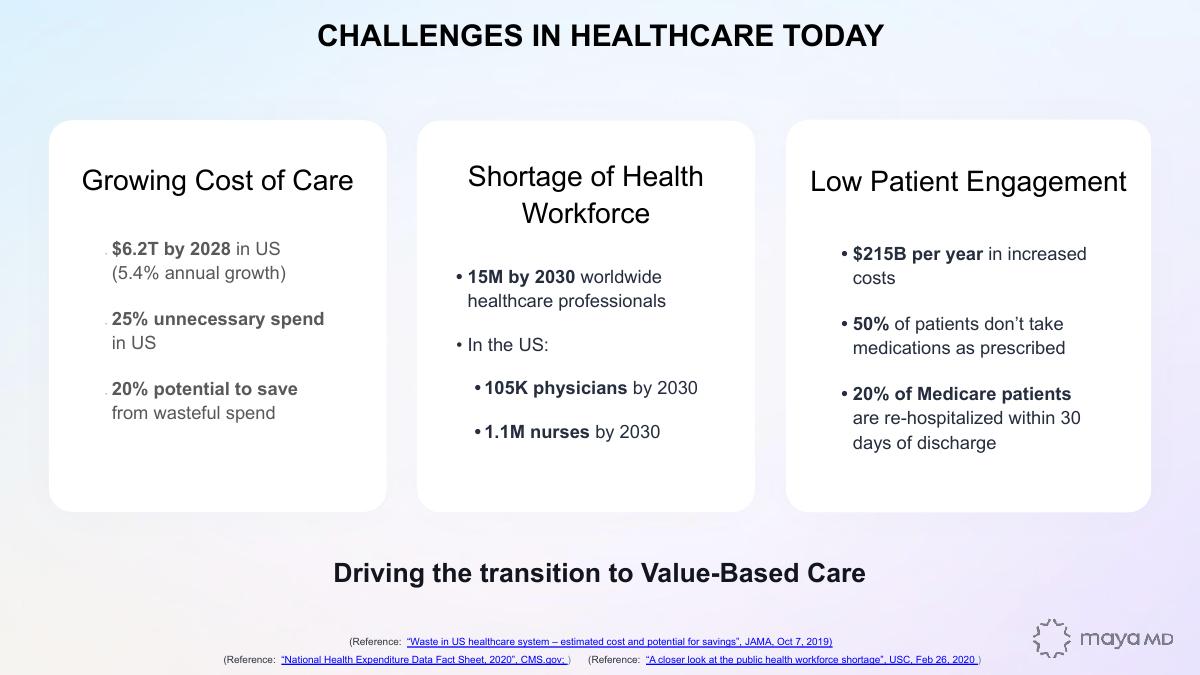
Slide 3 — Challenges in healthcare today
The strongest of the context slides, and the only one that cites sources. Three columns: growing cost of care ($6.2T US spend by 2028, 5.4% annual growth, 25% unnecessary spend, 20% potential savings from waste), workforce shortage (15m healthcare professionals short worldwide by 2030; in the US 105k physicians and 1.1m nurses by 2030), and low patient engagement ($215bn/year in increased costs, 50% of patients not taking medication as prescribed, 20% of Medicare patients re-hospitalised within 30 days).
Footnotes name JAMA (Oct 2019), CMS.gov (2020) and a USC analysis (Feb 2020). This is the right instinct — most decks assert macro numbers with no provenance. The problem is timing: a deck circulated in 2023 is leaning on 2019 and 2020 sources for a market whose entire competitive landscape changed in late 2022.
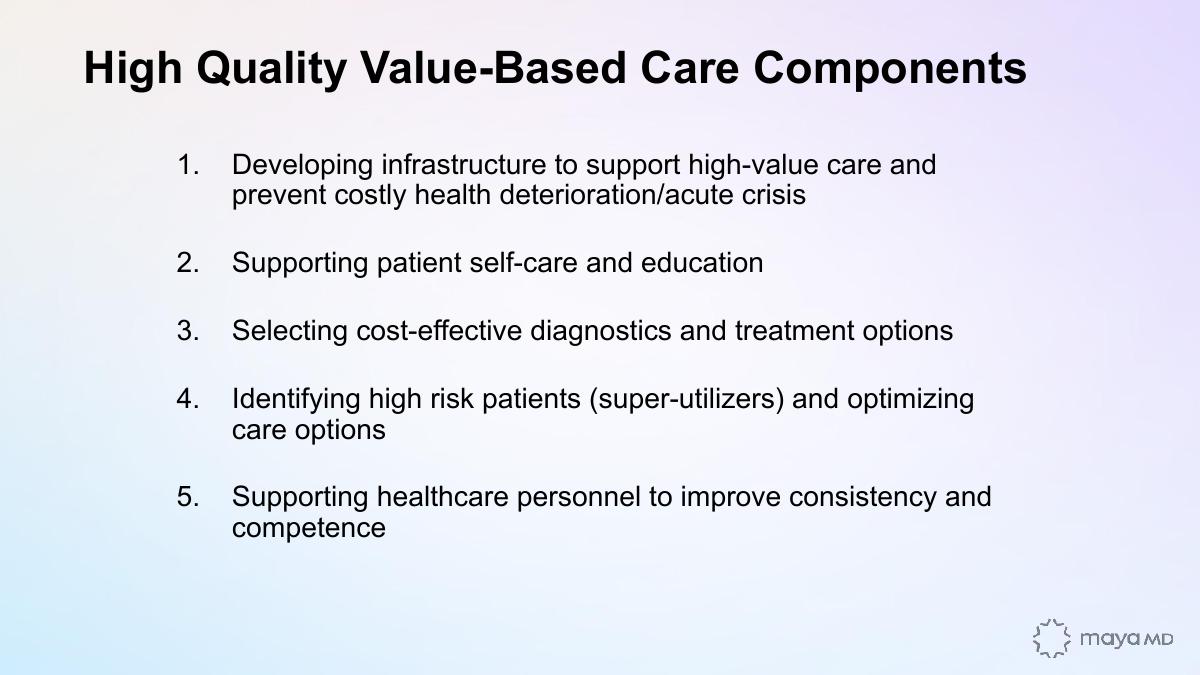
Slide 4 — High-quality value-based care components
A five-item numbered list of what good value-based care requires: infrastructure to prevent deterioration, patient self-care and education, cost-effective diagnostics, identifying high-risk "super-utilizers", and supporting clinical staff consistency. Plain black text on white, no visual.
The list is sensible but it is a policy framework, not a product argument. Four slides in, the deck has still not said what MayaMD does.
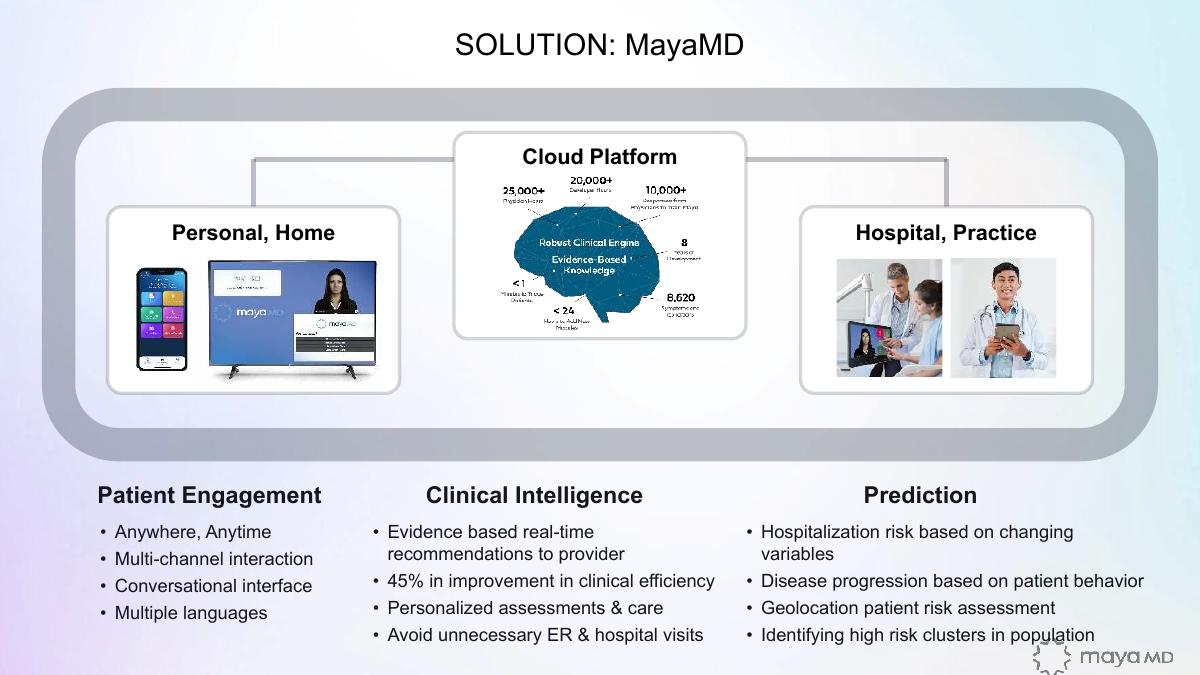
Slide 5 — Solution: MayaMD
Finally, the architecture. A cloud platform with a "robust clinical engine" sits between two deployment contexts — "Personal, Home" on the left and "Hospital, Practice" on the right — with three capability columns underneath: patient engagement (anywhere/anytime, multi-channel, conversational, multilingual), clinical intelligence (real-time evidence-based recommendations, "45% improvement in clinical efficiency", personalised assessments, avoiding unnecessary ER visits), and prediction (hospitalisation risk, disease progression, geolocation risk, high-risk clusters).
That "45% improvement in clinical efficiency" is the first hard performance claim in the deck and it arrives with no source, no study, no sample and no definition of "efficiency". It is the kind of number a partner writes down and then asks about, and the deck has no follow-up slide for it.
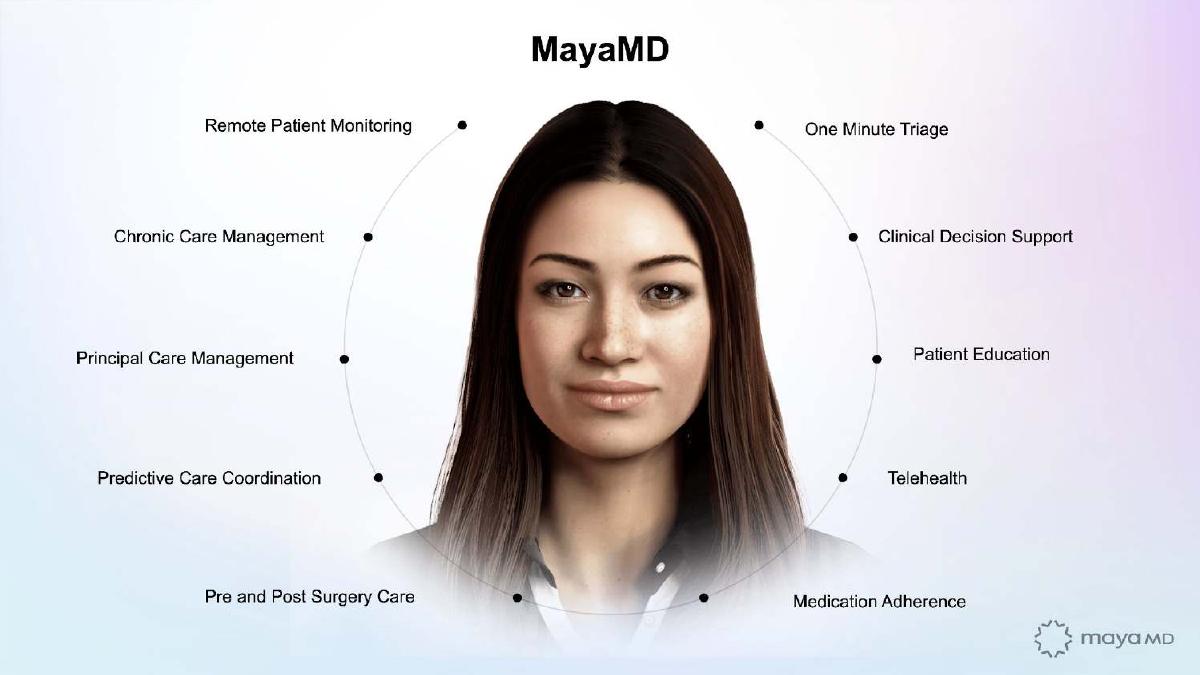
Slide 6 — The capability wheel
A rendered human face ringed by ten capabilities: remote patient monitoring, chronic care management, principal care management, predictive care coordination, pre/post surgery care, medication adherence, telehealth, patient education, clinical decision support, one-minute triage.
Ten capabilities on one slide is a strategy statement whether the founders intend it or not, and the statement is "we do everything." Each of those ten items is a separate buyer, a separate sales cycle and, in several cases, a separate regulatory pathway. Nothing on the slide indicates which one MayaMD leads with.
Slides 7 and 8 — Product and the clinical engine
Slide 7, "Healthcare Anytime, Anywhere", is the best product slide in the deck: a phone mock-up of the Maya avatar surrounded by eight specifics — chatbot, texting, digital human, WhatsApp, SMS, video and phone channels; iOS, Android, tablet, website and "Smart TV (coming soon)"; and named language support in English, Spanish, German, French, Chinese, Hindi, Arabic and Greek. Those are falsifiable claims, which makes them useful.
Slide 8 explains how Maya was built, using a brain diagram annotated with eight build metrics: 25,000+ physician hours, 20,000+ developer hours, 10,000+ physician responses used to train Maya, 8 years of development, 8,620 symptoms and conditions, under 1 minute to triage, under 24 hours to add a new module, and sub-half-second processing of any combination of symptoms, labs, history and medications.
This is the deck's real moat argument, and it is well made. Eight years and 25,000 physician hours is a genuine barrier to entry, and "under 24 hours to add a new module" is the kind of operational metric that separates a product from a demo. It deserved to be slide 3, not slide 8.
Slide 9 — Enhanced with top researchers
Three named academic partners with a one-line description each: Yale School of Medicine (clinical reasoning platform used to improve diagnostic training for internal medicine residents), Carnegie Mellon (AI model to predict hospitalisations from lifestyle behaviours), Boston University (incorporating Project RED to lower readmissions). Below them, two study results: a University of Michigan / UCLA clinical accuracy study showing triage accuracy of 0.94 for Maya versus 0.87 for a physician and 0.65 for a physician assistant, and a University of Utah Health consumer engagement study reporting 89% found Maya easy to use and 83% would like to use Maya frequently.
Named institutions and a chart where the product beats a human clinician is the most valuable asset in the deck. It is also the most under-documented. There is no sample size on either study, no publication, no date, no case mix, no confidence interval, and no explanation of what "triage accuracy" was measured against. A 0.94-versus-0.87 result that outperforms physicians is an extraordinary claim, and extraordinary claims presented without an n invite scepticism rather than excitement. One line — "n=X cases, published in Y, 2022" — would change the temperature of the room.
Slides 10 and 11 — The readmission wedge
Slide 10 is a clean five-row framing: the problem (readmission as a patient-safety issue and driver of preventable cost), the evidence (the ReEngineered Discharge programme, a National Quality Forum best practice shown in RCTs to lower readmissions by 20%), the challenge (busy hospitals and staff shortages degrade discharge quality), the opportunity (27 million US discharges per year), and the solution (a digital assistant automating discharge). It closes with "Our data shows that patients like it, want to use it and it lowers readmissions."
That last clause is the single riskiest sentence in the deck. "It lowers readmissions" is a clinical outcome claim, and the data supporting it is never shown — not on that slide, not anywhere in the following nine. The two Utah numbers cover "like it" and "want to use it"; the third claim is unsupported.
Slide 11 quantifies the market with a sourced HCUP/AHRQ table: 27,112,142 discharges, 3,795,700 30-day all-cause readmissions (14%), $15,200 average cost, $57.69bn total, $5.77bn saved at a 10% reduction and $11.54bn at 20%. A heart-failure breakdown by payer follows.
The sourcing is exemplary. The unit formatting is not. The table prints Medicare heart-failure readmission cost as "$4,147 B" and the 20% saving on total heart failure as "1,069 B" — figures that should read $4.147bn and $1.069bn. Two orders-of-magnitude typos in the only quantified market slide in the deck, sitting beside correctly formatted numbers in adjacent cells. Nobody will think MayaMD believes heart-failure readmissions cost four trillion dollars. They will think nobody proofread the money slide.
Slides 12 to 17 — The Meghalaya deployment
Six of nineteen slides — nearly a third of the deck — go to a single programme: Positive Public Healthcare Management, run by the Government of Meghalaya with the Smart Village Movement, using MayaMD's technology.
Slides 12 and 13 are near-duplicates of the same bullet layout, one listing objectives (shifting from disease management to prevention; identifying causative factors, patterns, correlations and forecasting for policy) and one listing execution focus (healthcare for all citizens, outreach, a state health baseline, scalable coordination, supporting personnel). Both carry stray page numbers — "12", "13", later "15" — rendered into the slide body from an earlier template.
Slide 14 is the architecture: citizens → ANMs (auxiliary nurses and midwives) → doctors, with a Maya PPHM app for community health workers, a Maya Pro app for doctors, and a cloud platform doing population screening analysis, dynamic care pathways, vitals assessment, on-demand symptom checking, lab integration, medication reminders and a dashboard accessible to state government teams. Slide 15 turns the same programme into a cycle diagram: annual screening → health assessments → normal / chronic / follow-up triage → care programmes → analytics and database.
Slide 16 shows the software actually running: two phone screenshots of clinical history and patient monitoring views, a real-time monitoring dashboard with BMI, gender, age and village breakdowns, and a haemoglobin cluster analysis by village. This is genuine evidence of a live deployment and it is the most persuasive slide in the second half.
Slide 17 is where it goes wrong. Titled "Vitamin A — critical eye issues for children", it presents a raw data table of sixteen rows lifted straight out of the database: retinol value, village name, block, district, gender, patientid, familyid, BMI and age. The conclusion beneath reads "5 female children found deficient in Vitamin A" and "9 females in Reproductive age group".
Two problems. First, the arithmetic: the table has sixteen rows, and 5 + 9 = 14. Two rows — ages 53 and 54 — are in the table and in neither bucket, unexplained. Second, and much more seriously, this is individual-level health data displayed in a slide deck that has been publicly downloadable. Every row carries a specific village, a specific age, a gender, a BMI and a persistent patient identifier, tied to a clinical finding. Pseudonymous IDs plus village plus exact age plus gender is not anonymous in a small rural community — it is a re-identification exercise. Whatever the consent position on the ground, putting that table in front of a room of strangers is the kind of judgement error that will end a diligence conversation with any healthcare investor or hospital procurement team, because the buyer's first question is no longer "does this work" but "how do you handle our patient data".
The insight underneath is real and valuable: population screening surfaced correctable vitamin A deficiency in children at risk of night blindness and in women of reproductive age. That point could have been made with an aggregate bar chart and zero rows of identifiable data.
Slide 18 — Recognition
Three badges: UCSF Health Hub Digital Health Awards 2022 rising star finalist ("selected out of hundreds of startups"), CB Insights Digital Health 150 for 2022 ("selected out of thousands"), and LG Nova's final 20 ("selected out of over a thousand startups"). Each carries the selection ratio, which is the correct way to present an award — it converts a logo into a number.
Slide 19 — "We call it Human Precision"
A closing brand slide. No ask, no contact details, no email, no next step. The deck ends on a tagline.
What is genuinely worth copying
Source your macro claims on the slide. Slide 3 footnotes JAMA, CMS and USC directly under the numbers. Most decks do not, and it costs them credibility in the first two minutes. · Quantify the build. Slide 8's eight metrics — 25,000 physician hours, 8 years, 8,620 conditions, sub-24-hour module addition — turn "we have proprietary technology" into something an investor can actually assess. · Name the research partners. Yale, Carnegie Mellon, Boston University, Michigan, UCLA and Utah are checkable. Named institutions beat any amount of adjectives. · Show the product running on real data. Slide 16's dashboards and phone screenshots are worth more than the five architecture diagrams around them. · Put the selection ratio on your awards. "Selected out of over a thousand startups" is information. A bare logo is decoration. · Use the problem/evidence/challenge/opportunity/solution structure. Slide 10 walks an investor from a problem to a wedge in five lines with no chart. It is the tightest slide in the deck. · Anchor on an established protocol. Tying the product to Project RED — an existing National Quality Forum best practice with RCT evidence — borrows credibility that a novel workflow cannot.
What would stall a raise
No team slide. Nineteen slides and not one founder name, clinical advisor or board member. For a clinical AI company making diagnostic-accuracy claims, the absence of a named chief medical officer is not a minor omission — it is the first thing a healthcare investor looks for. · No ask. No amount, no round, no valuation, no use of funds, no runway. The deck ends on a tagline. · No business model. Nothing on pricing, contract structure, per-seat versus per-member-per-month, who signs the cheque, or what a deployment costs. The Meghalaya programme is described in operational detail with no indication of whether it is paid, subsidised or free. · No revenue, no customer count, no pipeline. After eight years of development, there is not a single commercial number anywhere in the document. · No competition slide. Symptom checkers, triage engines and clinical decision support are crowded categories with well-funded incumbents. Silence reads as either unawareness or avoidance. · The unsupported "it lowers readmissions" claim. A clinical outcome asserted on slide 10 with no supporting data anywhere in the deck. · Accuracy claims with no sample size. 0.94 versus 0.87 versus 0.65, 89% and 83%, and the unsourced "45% improvement in clinical efficiency" — all without n, methodology, date or publication. · Individual-level patient data on slide 17. Village, gender, exact age, BMI and persistent patient IDs tied to a clinical finding, in a public file. · Unit errors in the market table. "$4,147 B" and "1,069 B" where billions were meant, on the only slide that sizes the opportunity in dollars. · The 5 + 9 = 16 arithmetic gap on the same slide. · Duplicate slides and leftover page numbers. Slides 12 and 13 cover the same programme in the same layout, with "12", "13" and "15" baked into the slide bodies. · No regulatory position. Nothing on FDA classification, clinical decision support exemption status, HIPAA posture, or how the product is positioned relative to software-as-a-medical-device rules — in a deck that shows the product outperforming physicians at triage. · Six slides on one unpaid-looking pilot. A third of the deck on a single geography, with no line connecting it to the US hospital market the first eleven slides describe. · Ten capabilities, no wedge. Slide 6 offers everything from medication adherence to pre-surgical care with no indication of which one is the beachhead.
The structural problem: a keynote wearing a pitch deck's clothes
Almost every weakness above dissolves once you accept the metadata title. As a Boston conference presentation, this deck is well built: it opens on brand, establishes a systemic problem with sources, explains an eight-year technical build, shows named academic validation, and lands on a live government deployment with real dashboards. An audience of clinicians and health-system executives would leave impressed, and the absence of an ask, a price and a cap table is entirely appropriate — nobody pitches a term sheet from a conference stage.
The failure happens at reuse. A keynote persuades a room that a capability matters. A pitch deck persuades one partner that a business is investable. Those are different burdens of proof, and the second one requires the four things this deck never mentions: who is building it, what it costs, who pays, and how much you want.
The fix here is not a rewrite. It is a five-slide addendum — team with a named CMO, business model and pricing, traction and pipeline, competitive landscape, and ask with use of funds — plus a hard edit that cuts the Meghalaya section from six slides to two and moves slides 8 and 9 forward to positions three and four. That version would be a strong seed or Series A deck, because the underlying assets are unusually good. The current version simply does not ask the reader for anything, and decks that ask for nothing get nothing.
The transferable lesson
If you have one deck, you are using it in at least two rooms it was not designed for. Conference decks lead with the problem and end on brand. Investor decks lead with the company and end on the ask. Sales decks lead with the buyer's pain and end on a price. Maintaining three versions of a shared slide library takes an afternoon; sending a keynote to an investor costs you the meeting, and you will never be told that is why.
And before any deck leaves your laptop: open every table and read it as a stranger would. Check that your billions say billions, that your buckets add up to your rows, and that no line in any screenshot identifies a real patient. Those three checks would have removed a third of this teardown.
Frequently asked questions
- What is MayaMD?
- MayaMD is a clinical AI company whose product, Maya, is a conversational digital health assistant. It triages symptoms, gives clinicians evidence-based recommendations at the point of care, and predicts hospitalisation and disease-progression risk. The deck describes eight years of development, 8,620 symptoms and conditions modelled, and deployment across consumer apps, hospitals and a state-government population health programme in Meghalaya, India.
- Is the MayaMD deck a real investor pitch deck?
- Not originally. The PDF metadata title is 'MayaMD Presentation, Boston 3/27-3/28', which identifies it as a conference presentation. It has no funding ask, no team slide, no business model and no financials — all the things an investor deck must have and a keynote does not. It was subsequently circulated as a pitch deck example, which is how most readers encounter it.
- What is the biggest weakness in the MayaMD pitch deck?
- The absence of a team slide. For a company claiming its AI triages more accurately than physicians, an investor's very first question is who the clinical leadership is. Nineteen slides pass without naming a single founder, chief medical officer or advisor, which leaves the deck's most impressive claims with no human accountability behind them.
- What is the problem with slide 17 of the MayaMD deck?
- It shows a raw export from the patient database: sixteen rows containing village name, block, district, gender, exact age, BMI and persistent patient and family identifiers, each tied to a vitamin A deficiency finding. Pseudonymous IDs combined with village, age and gender are re-identifiable in small rural communities, and the file is publicly downloadable. The same insight could have been shown as an aggregate chart. The stated conclusion — 5 children and 9 women of reproductive age — also leaves two of the sixteen rows unexplained.
- Which MayaMD slides should founders copy?
- Slide 8, which quantifies the technical build in eight falsifiable metrics; slide 9, which names six research institutions rather than gesturing at 'leading universities'; slide 10, which walks from problem to evidence to opportunity to solution in five lines of text; and slide 18, which puts a selection ratio on every award badge instead of showing bare logos.
- How should a healthcare AI startup structure its pitch deck?
- Lead with the clinical team and the evidence base, not the macro problem — every healthcare investor already knows US spend is rising. Attach a sample size, date and publication to every accuracy claim. State your regulatory position explicitly (FDA classification or exemption, HIPAA posture, data residency). Show aggregate outcomes, never individual patient records. Then close with a specific ask, a pricing model and named buyers.