SilkChart’s 14-slide deck is a masterclass in 'founder-market fit.' By positioning the CEO as the former Head of Product Retention at Instacart and the CTO as a two-time YC founder, the company successfully raised $5.32M. The narrative identifies a critical pain point: privacy regulations (like Apple’s ATT) making broad ad targeting inefficient. SilkChart’s solution promises to link product usage data with marketing campaigns without requiring 'expensive engineers.' While the deck is light on specific product screenshots and financial projections, it compensates with a clear competitive matri…
Key takeaways
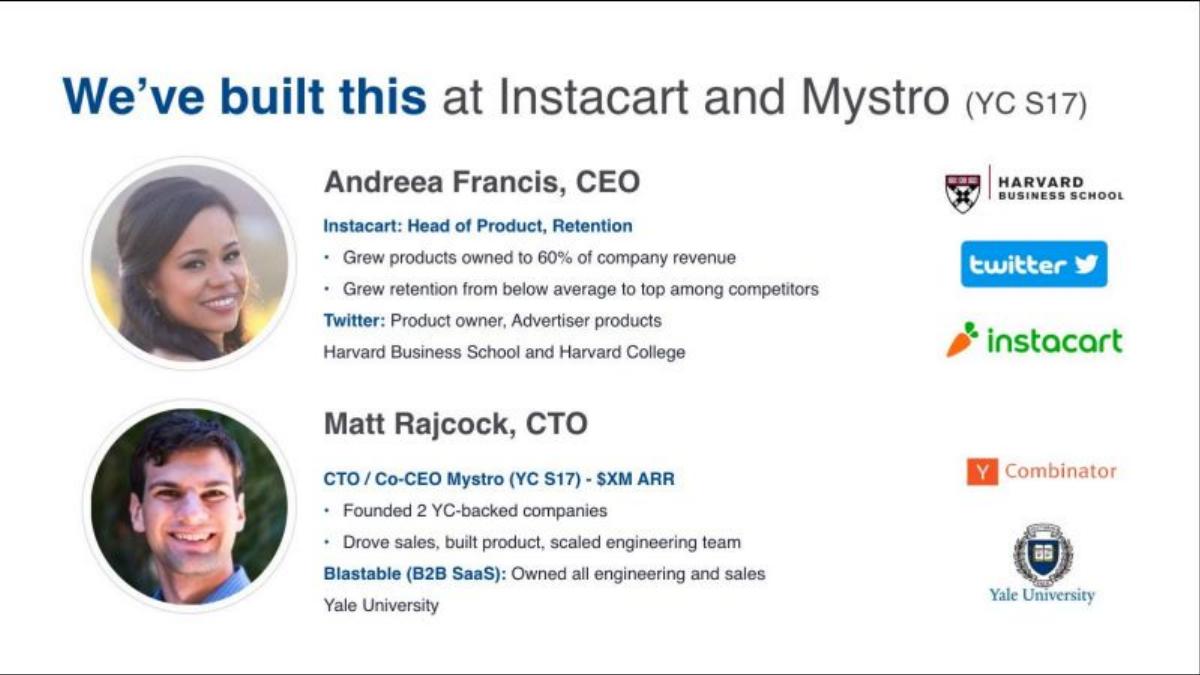
- The founders' background is the deck's strongest asset, specifically citing a 30% lift in revenue driven at Instacart (Slide 13).
- The problem is framed around external regulatory shifts, specifically Google phasing out third-party cookies and Apple's attribution changes (Slide 6).
- SilkChart identifies a 'no-man's land' between product analytics (Amplitude/Mixpanel) and marketing automation (HubSpot/Klaviyo) (Slide 11).
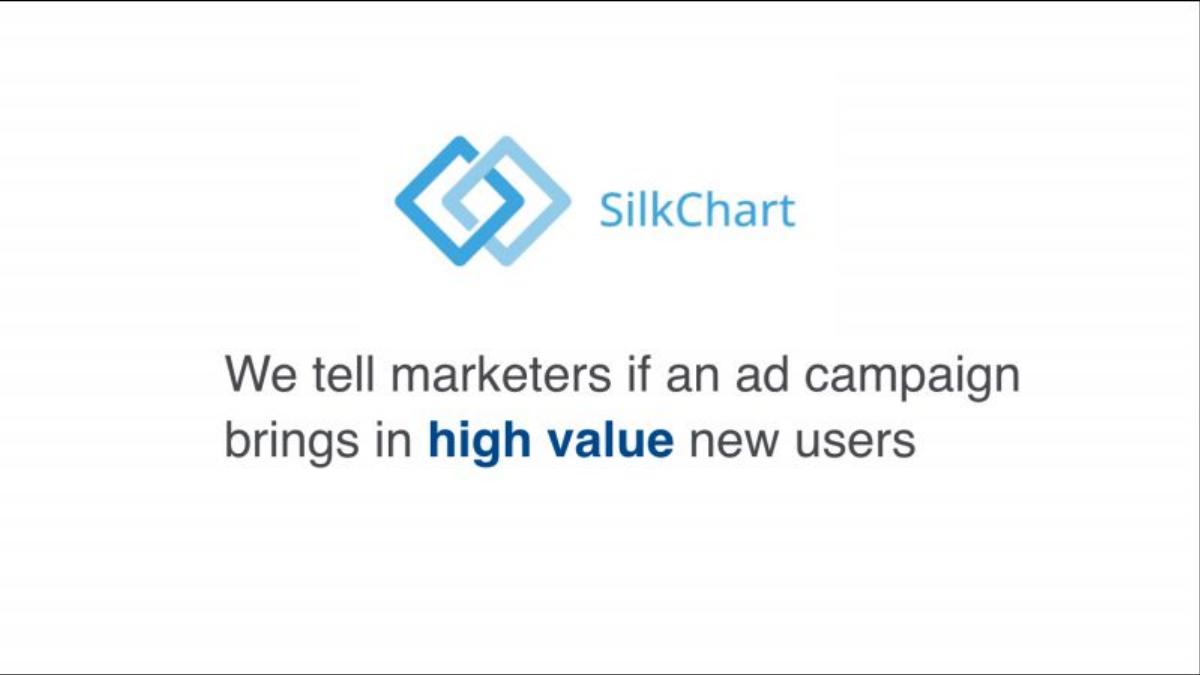
- The value proposition is explicitly tied to 'high value' users rather than just 'new' users (Slide 3).
- Onboarding is simplified into a three-step process that starts with merely adding an email address to existing tools (Slide 10).
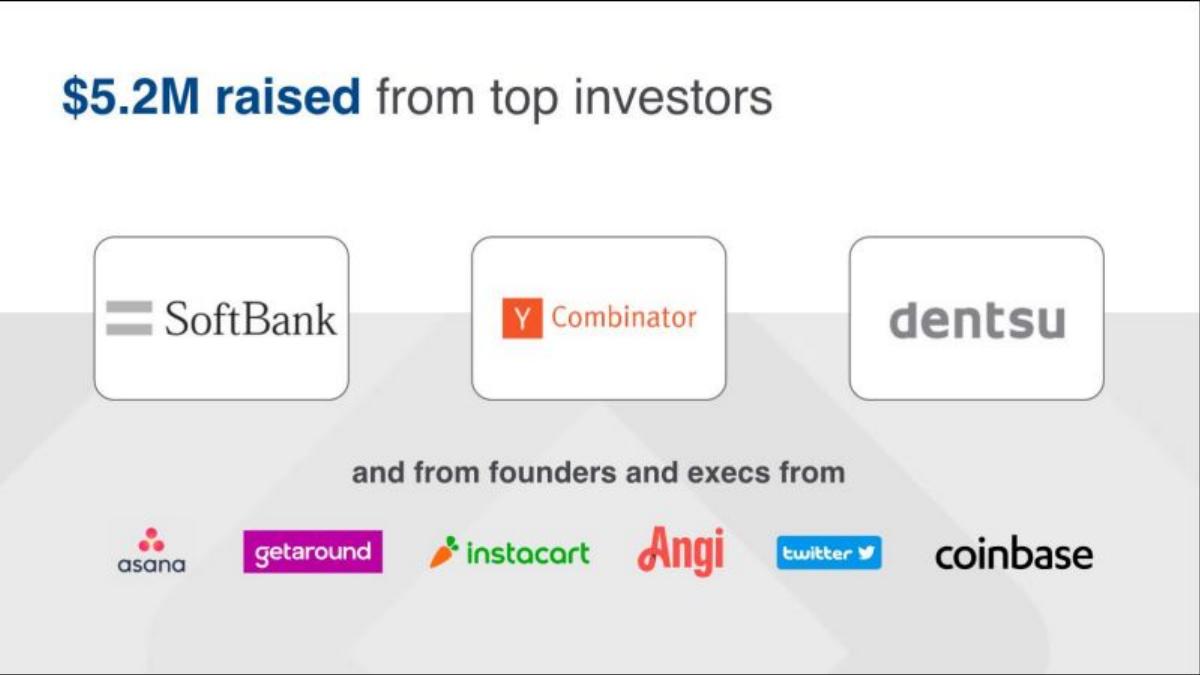
- The deck lists a high-prestige investor roster including SoftBank, Y Combinator, and Dentsu (Slide 5).
- The competitive matrix highlights 'No code to use' as a primary differentiator against manual data analysts (Slide 11).
- The deck lacks a formal 'Ask' slide, financial forecasts, or a detailed breakdown of the $5.32M use of funds.
The Narrative: Pedigree Over Product
SilkChart’s pitch deck is a concise 14-slide presentation that prioritizes founder credibility and a clear market gap over technical deep dives. In the 2022 fundraising environment, this 'team-first' approach was highly effective for Seed-stage companies, especially when the founders could point to direct experience at decacorns like Instacart. The deck follows a classic problem-solution-team structure but spends an unusual amount of real estate on the 'Why Now'—specifically the death of the third-party cookie.
Slide 1: Title Slide
The deck opens with a clean, blue-themed title slide. The logo consists of two interlocking diamonds. The tagline is straightforward: "Turn product data into revenue growth." It establishes the company's focus on the bottom line rather than just 'analytics' for analytics' sake.
Slide 2 & 3: The Value Proposition Shift
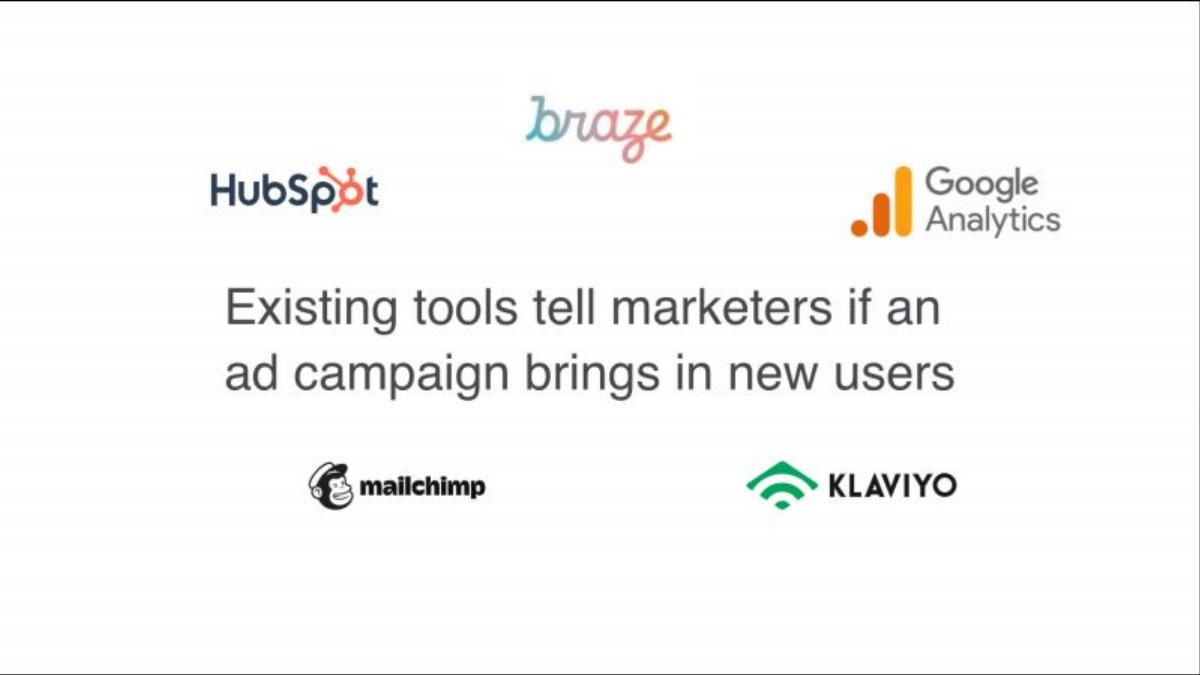
Slide 2 displays logos of major marketing tools: HubSpot, Braze, Google Analytics, Mailchimp, and Klaviyo. The text states: "Existing tools tell marketers if an ad campaign brings in new users." Slide 3 then introduces the SilkChart differentiator by adding one word: "We tell marketers if an ad campaign brings in high value new users." This distinction is the core of their pitch—moving from quantity (new users) to quality (high-value users).
Slide 4: The Team
This is arguably the most important slide in the deck. It features CEO Andreea Francis and CTO Matt Rajcock. The headline is a powerful validation: "We’ve built this at Instacart and Mystro (YC S17)." Andreea’s bio highlights her role as Head of Product, Retention at Instacart, where she "Grew products owned to 60% of company revenue." Matt is noted as a founder of two YC-backed companies. The inclusion of the Harvard Business School, Twitter, and Yale University logos further reinforces the 'elite' status of the founding team.
Slide 5: Investor Social Proof
SilkChart doesn't wait until the end to show their backing. Slide 5 highlights "$5.2M raised from top investors," featuring SoftBank, Y Combinator, and Dentsu. It also lists individual investors from Asana, Getaround, Instacart, Angi, Twitter, and Coinbase. This slide serves to de-risk the investment for any new participants by showing that major institutional and strategic players are already on the cap table.
Slide 6 & 7: The 'Why Now' (Market Problem)
Slide 6 uses TechCrunch and other news clippings to highlight "New privacy regulations prevent the targeting of narrow groups of users." It specifically mentions Google phasing out third-party cookies and Apple's attribution changes. Slide 7 connects this to the business impact: "Targeting broader groups increases total spend and lowers ROI." This creates a sense of urgency; the old way of marketing is breaking, and a new solution is required.
Slide 8: The Technical Gap
Slide 8 explains why existing solutions aren't working. It notes that "Increasing ROI by leveraging product usage data is difficult" because it "Requires engineering skill" and "Marketers don't use product analytics tools" like Amplitude or Mixpanel because they lack marketing data. This identifies the 'silo' problem: product data and marketing data live in different worlds.
Slide 9 & 10: The Solution and Onboarding
Slide 9 promises to "Bring in high value users" and "Personalize campaigns without code." Slide 10 details a three-step onboarding process designed to sound effortless: 1. Client adds SilkChart's email to their tools, 2. SilkChart pulls in data (from Amplitude, Mixpanel, Google, Facebook, HubSpot, etc.), and 3. Client starts using dashboards. The emphasis here is on "no work for the client."
Slide 11: Competitive Landscape
The competitive matrix on Slide 11 compares SilkChart against Manual Data Analysts, Product Analytics Tools (Amplitude, Mixpanel, Heap), and Marketing Automation Tools (HubSpot, Mailchimp, Klaviyo). SilkChart is the only one that checks all three boxes: "Product Data," "Marketing Data," and "No code to use." This visualizes their unique position in the stack.
Slide 12 & 13: Vision and Summary
Slide 12 provides a high-level vision: "make driving growth as easy as asking Alexa to turn on the lights." Slide 13 serves as a closing summary, reiterating the "30% lift in revenue" driven at Instacart and their current status of having "Startup + Enterprise customers." It directs viewers to a demo at their website.
What SilkChart Does Well
The SilkChart deck is exceptionally good at framing a technical problem as a business outcome. Instead of talking about data pipelines or API integrations, they talk about "high value users" and "revenue growth." This resonates with both VCs and the marketers who would eventually buy the product.
The use of pedigree is another standout feature. By explicitly stating that the CEO built this exact system at Instacart to drive massive revenue, they bypass the need for a long 'traction' slide. The assumption is that if it worked for a company of Instacart's scale, it is a proven methodology. This 'borrowed' traction is a powerful tool for early-stage founders with significant corporate experience.
What is Missing from the Deck
Despite its success, the deck has several notable omissions that a more skeptical investor might flag:
Product Screenshots: There is not a single image of the actual SilkChart interface. Investors are left to imagine what the "dashboards" look like. · Financial Projections: There is no mention of current ARR, growth rates, or future revenue targets. · The 'Ask': The deck does not specify how much they are currently raising or how they plan to spend the $5.32M mentioned in the catalogue facts. · Unit Economics: There is no information on Customer Acquisition Cost (CAC) or Lifetime Value (LTV), which is ironic for a company focused on ROI. · Market Size (TAM): The deck assumes the market for marketing analytics is obviously large, but it doesn't provide a specific Total Addressable Market figure.
What Other Founders Should Copy
Founders should emulate SilkChart's "Problem/Solution" clarity. The jump from Slide 2 ("new users") to Slide 3 ("high value new users") is a perfect example of how to communicate a complex value proposition in seconds. It identifies the 'gap' in the current market leaders' offerings immediately.
Additionally, the Competitive Matrix (Slide 11) is a model of simplicity. Instead of a complex 'X/Y' axis chart that can be confusing, the checklist format clearly shows where competitors fall short. If your startup's main advantage is being 'no-code' or 'all-in-one,' this format is highly effective.
Finally, the 'Why Now' slide (Slide 6) is essential for any company in a crowded space. By tying their existence to external regulatory changes (Apple and Google's privacy shifts), SilkChart makes their solution feel like an inevitable necessity rather than just another 'nice-to-have' tool.
Frequently asked questions
- How much did SilkChart raise and from whom?
- According to the catalogue facts, SilkChart raised $5.32M in a Seed round in 2022. The investor list is high-profile, featuring Y Combinator, SoftBank, Dentsu, Harlem Capital, Global Founders Capital, Garage Capital, Amino Capital, and Asymmetric Capital Partners, along with several individual angel investors.
- What is the core problem SilkChart is solving?
- SilkChart addresses the decreasing ROI of digital marketing caused by privacy regulations. As shown on Slide 6 and 7, new regulations prevent narrow targeting, forcing marketers to target broader groups, which increases spend and lowers ROI. They argue that using product data to fix this currently requires engineering skills that marketers lack.
- How does SilkChart differentiate itself from Amplitude or Mixpanel?
- On Slide 11, SilkChart positions itself as the only solution that combines product data and marketing data in a no-code environment. While tools like Amplitude have product data, they lack marketing data; conversely, tools like HubSpot have marketing data but lack product usage depth. SilkChart claims to bridge this gap without needing data analysts.
- What is the 'Instacart' connection mentioned in the deck?
- The CEO, Andreea Francis, was previously the Head of Product, Retention at Instacart. Slide 4 and Slide 13 emphasize that she 'built this' (the core logic of SilkChart) at Instacart, where it reportedly drove a 30% lift in revenue. This provides significant social proof and validation for the product's efficacy.
- Is there a product demo or screenshots in the deck?
- The deck is notably light on product visuals. Slide 10 uses icons to represent the onboarding process, and Slide 13 provides a URL for a demo (SilkChart.com). There are no actual UI screenshots or detailed feature walkthroughs within the 14 slides, focusing instead on the conceptual value and the team's ability to execute.