Signpost presents a compelling case for 'invisible' marketing automation, targeting the fragmented local business sector. The deck focuses heavily on their proprietary data moat—claiming data on 68 million Americans—and their ability to drive measurable outcomes like a 34% improvement in online ratings. By positioning their smart assistant, Mia, as a zero-effort solution for merchants, they address the primary pain point of small business owners: lack of time. While the deck excels at explaining the product-market fit and the efficiency of their sales engine, it notably omits the final 'Finan…
Key takeaways
- Signpost claims to have collected data on 68 million Americans, representing 27% of US adults (Slide 10).
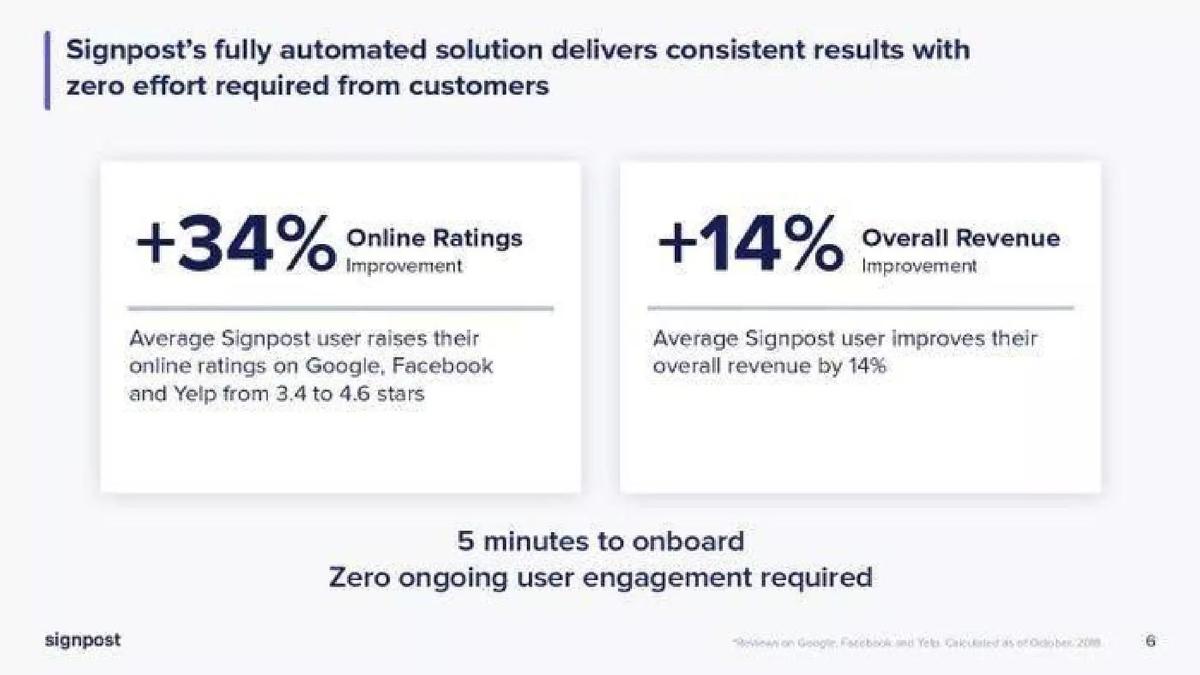
- The platform drives a +34% improvement in online ratings, raising average scores from 3.4 to 4.6 stars (Slide 6).
- The product is positioned as 'zero effort,' requiring only 5 minutes to onboard for the merchant (Slide 6).
- Signpost operates a high-velocity sales model with a sales cycle of less than 7 days for both SMBs and franchises (Slide 15).
- The company manages a database of over 13 million qualified US leads to fuel its sales reps (Slide 16).
- Revenue is generated through three tiers: Basic ($199/mo), Standard ($299/mo), and Pro ($399/mo) (Slide 17).
- Home Services is the largest customer vertical, accounting for 44% of their base (Slide 18).
- The deck emphasizes a shift from manual 'DIY tools' to 'Hands free automation' as the core market opportunity (Slide 13).
Introduction: The 2019 Signpost Overview
Founded in 2010, Signpost entered a crowded field of CRM and marketing tools but carved out a niche by focusing on the 'local' segment—businesses like plumbers, lawyers, and dentists who are often tech-averse or time-constrained. This 19-slide deck from 2019 serves as a comprehensive overview of their progress, focusing on their automated 'Mia' assistant and a massive proprietary database. With $88.6 million raised according to catalogue facts, this deck represents a company in a 'Later' stage, looking to prove that its unit economics and sales engine are ready for massive scale.
Section 1: The Foundation and Problem (Slides 1-4)
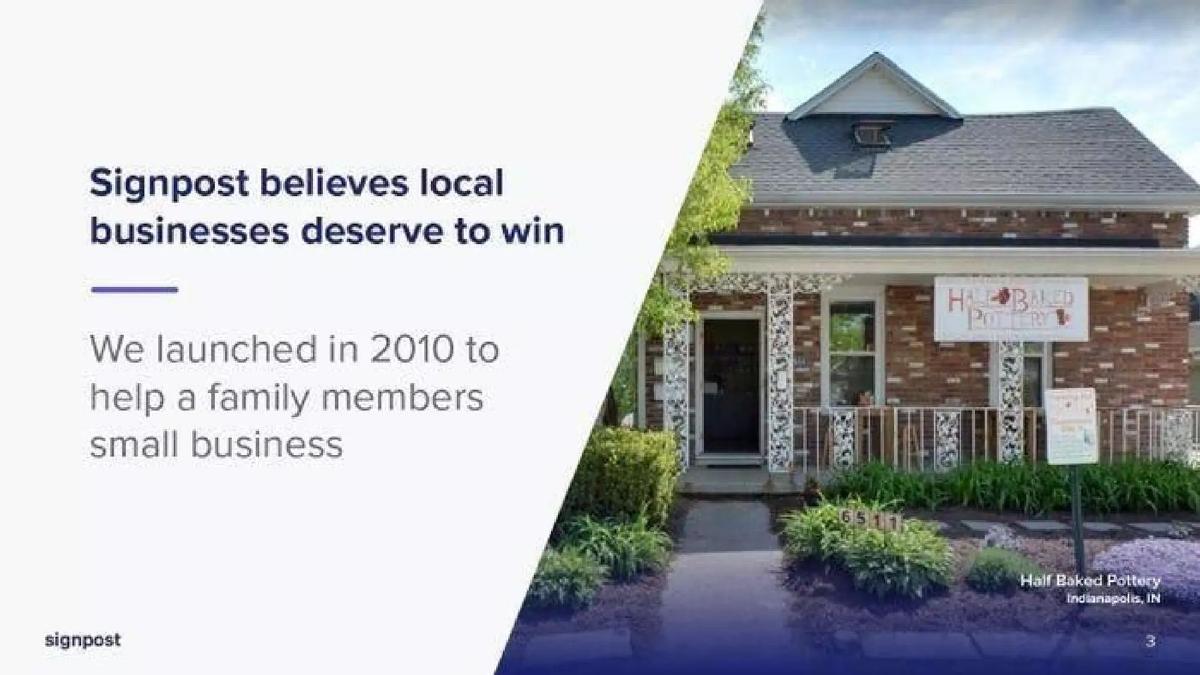
The deck opens with a clean, minimalist aesthetic. Slide 1 and Slide 2 establish the brand and the roadmap for the presentation, which covers Product, Market, Sales, and Financials. Slide 3 provides the 'Why'—an emotional hook stating that 'Signpost believes local businesses deserve to win,' noting the company's 2010 launch was inspired by a family member's small business. This humanizes a product that is otherwise highly technical.
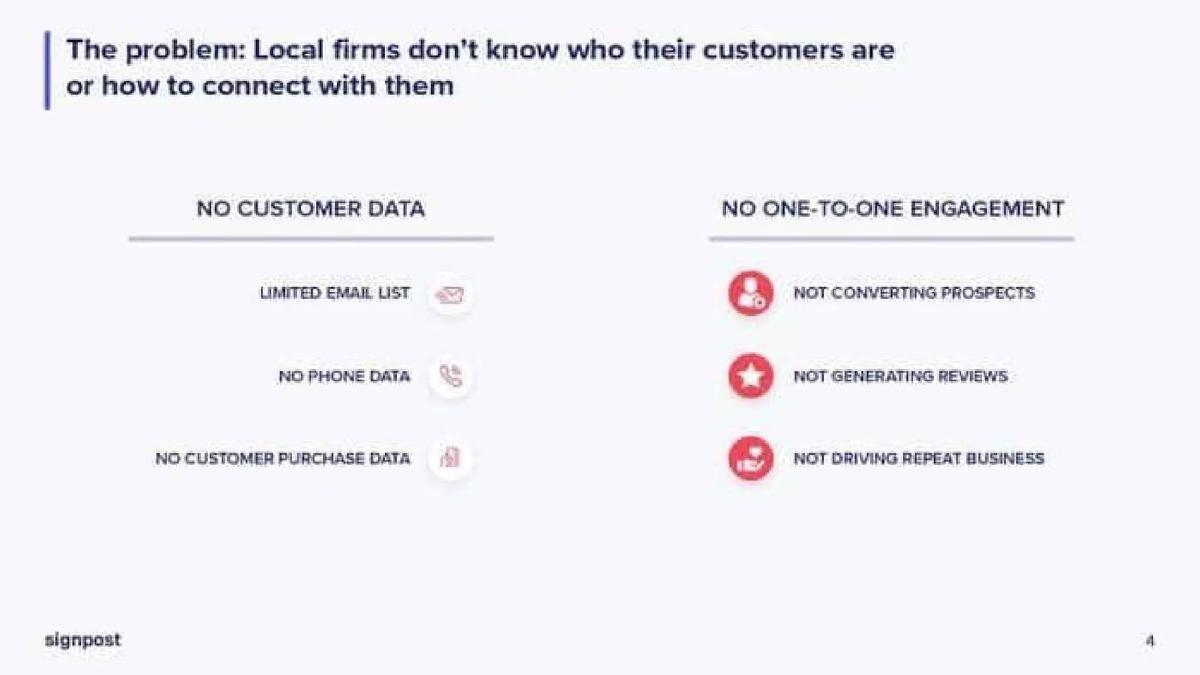
Slide 4 defines the problem with clinical precision. It splits the pain points into two categories: 'No Customer Data' (limited email lists, no phone data, no purchase data) and 'No One-To-One Engagement' (failure to convert prospects, generate reviews, or drive repeat business). By framing the problem this way, Signpost sets up its solution as a dual-purpose engine that solves both data collection and communication gaps simultaneously.
Section 2: The Solution and Team (Slides 5-7)
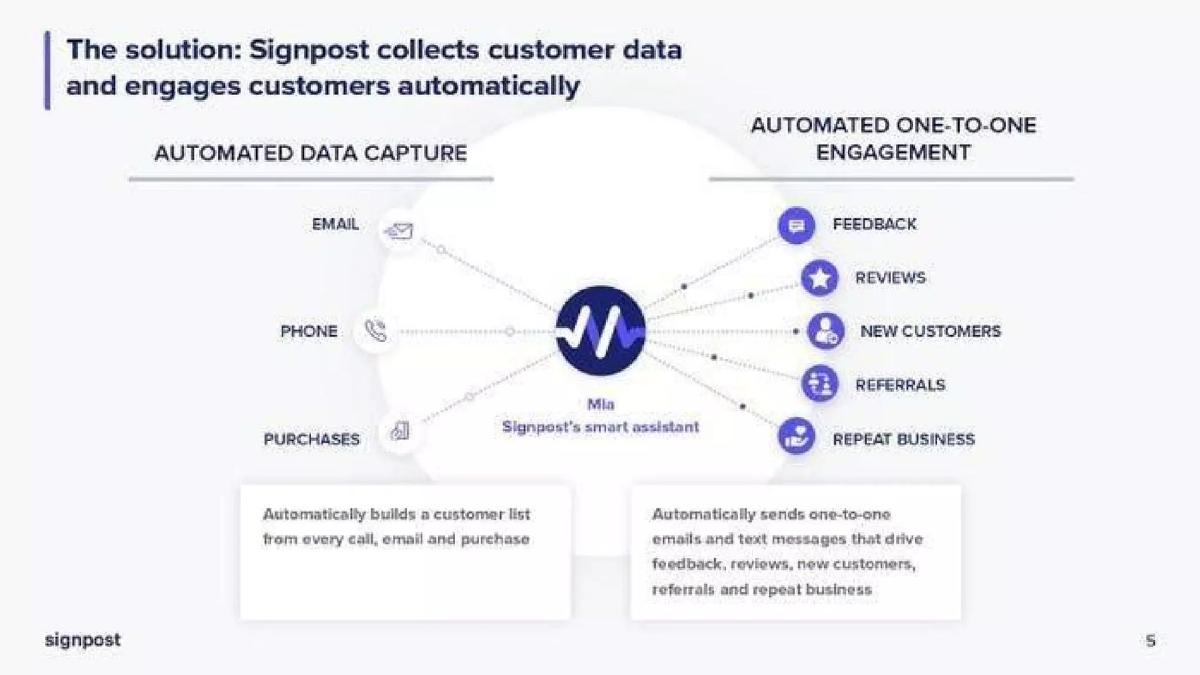
Slide 5 introduces 'Mia,' Signpost's smart assistant. The diagram shows Mia at the center, connecting automated data capture (Email, Phone, Purchases) to automated engagement (Feedback, Reviews, New Customers, Referrals, Repeat Business). The key takeaway here is 'Automatic'—a word repeated four times on this slide alone.
Slide 6 is the 'money slide' for proof of concept. It claims two major outcomes for the average user: a +34% Online Ratings Improvement (moving from 3.4 to 4.6 stars) and a +14% Overall Revenue Improvement . Crucially, it reinforces the low barrier to entry: '5 minutes to onboard' and 'Zero ongoing user engagement required.' For a small business owner, this is the ultimate selling point.
Slide 7 introduces the leadership team. Stuart Wall (CEO/Founder) is highlighted alongside executives with backgrounds from Harvard Business School, Namely, Yodle, and AOL. The inclusion of a Glassdoor rating of 4.3 stars at the bottom of the slide is a subtle but effective way to signal a healthy corporate culture to potential investors.
Section 3: Product Deep Dive and Data Moat (Slides 8-11)
Following a transition on Slide 8 , Slide 9 visualizes the customer journey. It tracks a prospect from their first call through to becoming a repeat customer who posts 5-star reviews on Google. The slide uses mobile UI mockups to show exactly what the end-consumer sees, making the 'invisible' automation tangible.
Slide 10 is perhaps the most important slide for a later-stage investor. It describes the 'Signpost data moat.' The company claims to own proprietary data on 68M Americans, representing 27% of US adults . They contrast this with traditional CRMs where users must manage their own data. This 'Cross-Location Insight' allows Signpost to apply learnings from one business to all others on the platform. This is a classic 'network effects' argument applied to data.
Slide 11 provides specific examples of these insights. For instance, it notes that consumers are 4x more likely to share feedback if messaged within 5 minutes of their visit. By showing the logic behind Mia's decisions, Signpost proves that their automation isn't just random; it is optimized for conversion.
Section 4: Market Opportunity and Sales Engine (Slides 12-16)
Slide 13 frames the market shift. It argues that the world has moved from 'Website discovery' to 'Social discovery' and from 'DIY tools' to 'Hands free automation.' This slide justifies why Signpost's specific approach is the future, rather than just another tool in the legacy CRM category.
Slides 15 and 16 detail the sales machinery. Slide 15 reveals a highly efficient model: 60 reps for SMBs and 11 reps for Franchises, both maintaining a sales cycle of less than 7 days . This is incredibly fast for B2B software and suggests a 'transactional' sales model that can be scaled simply by adding headcount. Slide 16 explains how they feed these reps: a database of 13M+ qualified leads , with 300,000 leads augmented each month. The process involves scrubbing data, adding business attributes, and distributing leads based on a 'prediction of LTV/CAC.'
Section 5: Economics and Verticals (Slides 17-19)
Slide 17 outlines the pricing tiers: Basic ($1,999/year), Standard ($2,999/year), and Pro ($3,999/year). By showing the monthly breakdown ($199 to $399), they demonstrate an accessible entry point for small businesses while maintaining a high enough Annual Contract Value (ACV) to support their sales team. Slide 18 shows the diversity of their reach. While Home Services (44%) and Professional Services (14%) are the leaders, the 'Customer by Type' chart shows that 71% of their revenue comes from SMBs, proving they have successfully cracked the 'long tail' of the market.
The deck concludes with Slide 19 , which is a placeholder for 'Financials and Forecast.' In this version of the deck, the actual financial data is omitted. This is common in public-facing decks to protect sensitive P&L data, but for a teardown, it marks a significant gap in evaluating the company's path to profitability.
What Works in This Deck
Quantifiable Results: The use of specific percentages (+34% ratings, +14% revenue) on Slide 6 provides immediate credibility. · The Data Moat: Claiming 27% of US adults in their database (Slide 10) elevates the company from a simple software tool to a data powerhouse. · Sales Velocity: Proving a <7 day sales cycle (Slide 15) is a powerful indicator of product-market fit and sales efficiency. · Clarity of Persona: The deck clearly understands its target customer—the busy local business owner—and repeatedly emphasizes 'zero effort' and 'automation.'
What is Missing
Financial Data: As noted, Slide 19 is a blank transition. Without the actual forecast, it is impossible to see the company's burn rate or revenue growth trends. · Competitive Landscape: The deck mentions 'traditional CRMs' generally but does not name specific competitors or explain how they win against players like HubSpot or specialized vertical software. · Churn and Retention: While they mention LTV/CAC predictions, they do not provide actual churn numbers, which is the most critical metric for SMB SaaS. · The 'Ask': There is no slide detailing how much capital they are raising or how they intend to deploy it.
What a Founder Should Copy
The 'From/To' Market Slide: Slide 13 is a masterclass in framing a market opportunity by showing the evolution of industry trends. · Visualizing the Customer Journey: Slide 9 makes a complex automated backend feel simple and beneficial by showing the end-user experience. · Process Flowcharts: Slide 16 effectively explains a complex lead-generation and distribution engine using a simple chevron diagram. · Tiered Pricing: Slide 17 clearly differentiates features between tiers, making the upsell path obvious.
Frequently asked questions
- What is the core value proposition of Signpost?
- Signpost provides an automated marketing assistant named Mia that captures customer data from calls, emails, and purchases without manual entry. It then uses this data to automatically send personalized messages to drive reviews, referrals, and repeat business. The primary benefit is 'zero effort' for local business owners who lack the time to manage traditional CRM tools.
- How does Signpost differentiate itself from traditional CRMs?
- According to slide 10, traditional CRMs require users to upload and manage their own data. Signpost claims a 'data moat' where they own the customer data collected for users. They leverage cross-location insights from their database of 68 million Americans to optimize marketing messages across their entire user base, rather than relying on siloed data.
- What does the sales process look like for Signpost?
- Signpost uses a highly structured, data-driven sales engine. They maintain a database of 13 million leads, adding 300,000 new leads monthly. These leads are enriched with business attributes and distributed to sales reps based on predicted Life Time Value (LTV) and Customer Acquisition Cost (CAC). This results in a very short sales cycle of under 7 days.
- Which industries does Signpost serve most effectively?
- While the platform is designed for various local businesses, slide 18 shows that Home Services is their dominant vertical at 44%. This is followed by Professional Services (14%), Fitness (7%), and Recreation (4%). The customer base is primarily Small and Medium Businesses (71%), with Franchises making up 25%.
- What metrics does the deck use to prove product efficacy?
- The deck highlights two primary success metrics on slide 6: a 34% improvement in online ratings (moving from a 3.4 to a 4.6-star average on platforms like Google and Yelp) and a 14% improvement in overall revenue for the average user. These figures are intended to justify the subscription costs, which range from $1,999 to $3,999 annually.