The 2017 Advanced Emissions Solutions (ADES) deck serves as a post-restructuring progress report for a publicly traded environmental technology company. Following a period of 'poor margin equipment bubbles' and 'cash burn' in 2013-2014, the company used this presentation to highlight a 70% reduction in costs and a return to profitability, reporting $98M in net income for 2016. The narrative leans heavily on the Tinuum joint venture, which leverages federal tax incentives for refined coal. While the deck succeeds in demonstrating financial recovery and a clear path for shareholder returns—incl…
Key takeaways
- The company underwent a massive restructuring between 2015 and 2016, resulting in a cost reduction of over 70% (Slide 5).
- ADES operates through two primary segments: Refined Coal (RC) and Emissions Control (EC), with a market capitalization of approximately $210M as of March 2017 (Slide 3).
- The Tinuum Group joint venture is a critical asset, with ADES holding a 42.5% equity stake alongside NexGen Refined Coal and Goldman Sachs (Slide 9).
- Projected cash flows from the Refined Coal segment are estimated at $275M to $300M in total through 2021 (Slide 11).
- The company successfully transitioned from a $30M net loss in 2015 to a $98M net income in 2016 (Slide 17).
- A key priority for 2017 was returning capital to shareholders, specifically declaring a $0.25 dividend in Q2 (Slide 7).
- The Emissions Control segment is focused on high-margin chemicals and equipment, supported by 35 U.S. patents (Slide 3).
- Future growth strategy includes exploring 'accretive M&A alternatives' to diversify beyond the 2021 refined coal tax incentive window (Slide 15).
Executive Summary: The Turnaround Tale
The investor presentation for Advanced Emissions Solutions (ADES) from March 2017 is a textbook example of a 'turnaround' deck. Unlike a seed-stage startup pitch that sells a dream, this deck is designed to restore confidence in a publicly traded entity that recently emerged from a period of high cash burn and internal restructuring. The narrative is built on three pillars: the liquidation of legacy issues, the stability of current cash flows from tax-advantaged coal projects, and a lean operational model that prioritizes shareholder returns.
Slide 1: Title and Branding
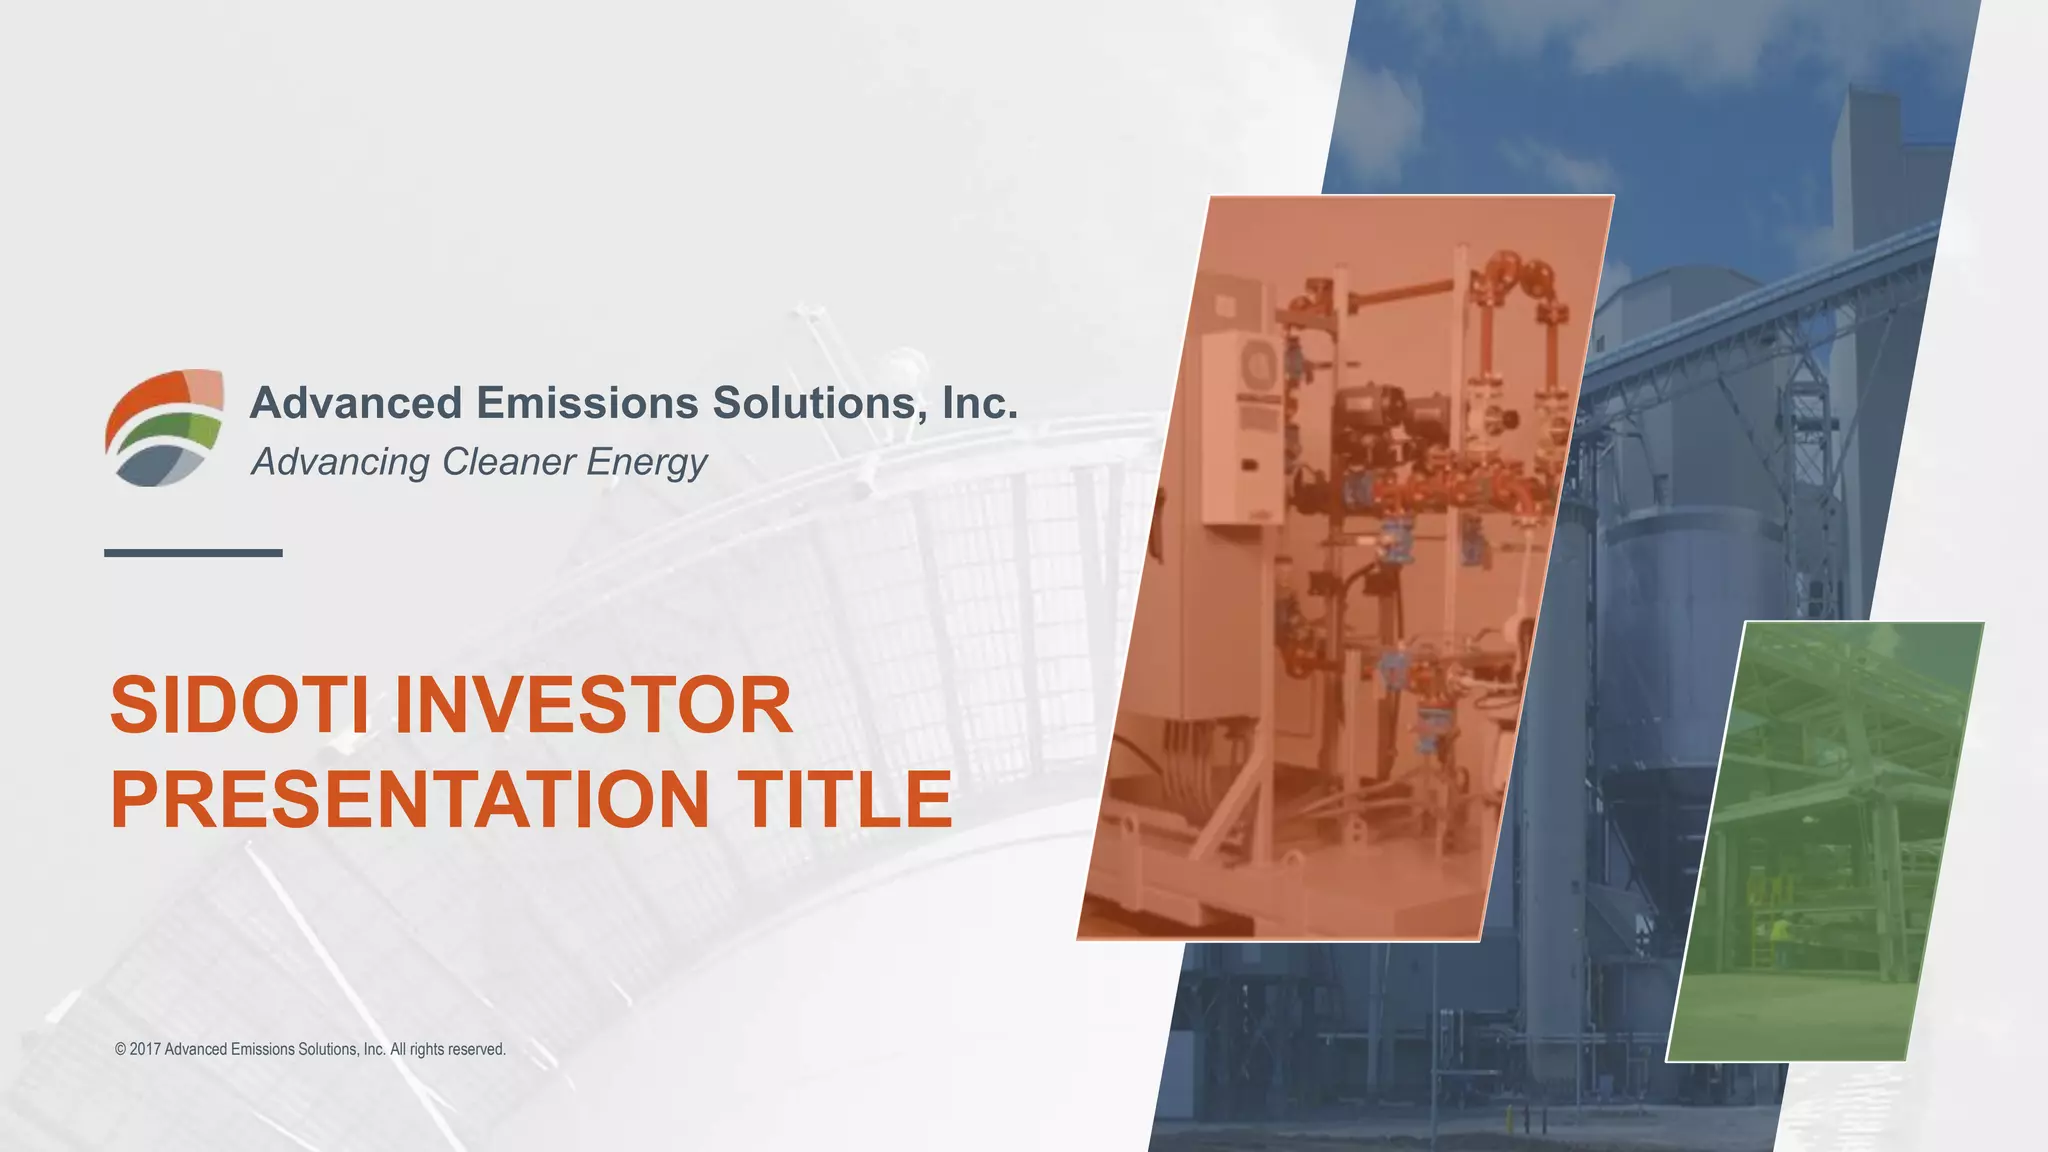
The cover slide establishes the company's identity: Advanced Emissions Solutions, Inc., with the tagline 'Advancing Cleaner Energy.' The imagery of industrial silos and piping immediately grounds the company in the heavy infrastructure and environmental utility sector. The mention of 'Sidoti Investor Presentation' indicates this was tailored for a specific micro-cap or small-cap investor conference, suggesting a target audience of institutional analysts and fund managers looking for undervalued recovery plays.
Slide 3: Corporate Overview and Structure
This slide provides a high-level snapshot of the business. It breaks the company into two distinct segments: Refined Coal (RC) and Emissions Control (EC). Key figures include a market capitalization of approximately $210M and the NASDAQ ticker: ADES. The slide highlights a significant intellectual property moat with 35 U.S. patents and 16 pending. Most importantly, it mentions a 'Transformation' involving a 'significant redirection in the business,' signaling to investors that the company they are looking at in 2017 is fundamentally different from the one that existed a few years prior.
Slide 5: Historical Events & New Beginning
This is arguably the most important slide for establishing credibility. It uses a timeline to address past failures head-on. It admits to 'Speculative R&D Investments' and a 'Poor Margin Equipment Bubble' in 2013-2014, as well as 'Cash Burn.' By labeling 2017 as a 'Lean Model' focused on 'Recurring Cash Flow,' the management team creates a clear demarcation between the 'old' ADES and the 'new' ADES. The slide claims a cost reduction of over 70% and a return to a debt-free balance sheet, which are powerful metrics for a turnaround story.
Slide 7: 2017 Priorities
Slide 7 outlines the immediate roadmap. The priorities are split between operational growth and capital allocation. The company aims to obtain new tax equity investors for Refined Coal and grow the Emissions Control segment through chemical sales and M&A. However, the most attractive point for investors is the 'Return Capital to Shareholders' section, which explicitly states the declaration of a $0.25 dividend in Q2 2017 and the evaluation of stock buy-backs. This is a clear signal of financial health and management's confidence in future cash flows.
Slide 9: Tinuum Group Joint Venture
This slide explains the mechanics of the company's primary revenue driver. ADES operates through Tinuum, a joint venture where they hold a 42.5% stake. The presence of Goldman Sachs as a 15% partner provides significant institutional validation. The slide explains the business model: leveraging federal tax policy to reduce mercury and NOx emissions, which allows investors to receive tax incentives while Tinuum receives income from those investors. A critical note at the bottom states 'Income expected through 2021,' setting a clear expiration date for this specific revenue stream.
Slide 11: Projected Future Cash Flows
Building on the Tinuum slide, Slide 11 quantifies the opportunity. Based on 14 invested facilities, the company projects total cash flows of $275M to $300M through 2021 . A bar chart shows steady annual cash flows between $50M and $65M. The slide also notes that each additional facility could add $5M-$7M annually, providing a clear 'unit of growth' for investors to track. This slide is designed to show that the company's current market cap ($210M) is potentially undervalued relative to the projected cash flows from just this one segment.
Slide 13 & 15: Emissions Control Strategy
Slide 13 acts as a section divider for the Emissions Control segment. Slide 15 details the 'Other 2017 Actions' for this division. The focus here is on optimization: simplifying equipment installations to ensure 'repeatability at lowest cost' and assessing the commercialization of remaining IP. The mention of 'accretive M&A' suggests that the company plans to use the cash generated by the Refined Coal segment to buy its way into new, long-term revenue streams before the 2021 tax incentive window closes.
Slide 17: Financial Review
The financial review slide provides the quantitative proof of the turnaround. Four charts show the trajectory from 2014 to 2016. Net Income swung from a $30M loss in 2015 to a $98M profit in 2016 . While revenue decreased from $63M to $51M in that same period, the 'Other Operating Expenses' chart explains why profitability improved: expenses were slashed from $57M to $27M. This slide reinforces the 'Lean Model' narrative introduced earlier in the deck.
Slide 19: Conclusion
The deck concludes with a simple 'Thank You' over an industrial backdrop. While standard, the lack of a specific 'Ask' slide is typical for a public company presentation at an investor conference, where the goal is to drive buy-side interest in the public stock rather than a private placement of shares.
What ADES Does Well
The deck is exceptionally transparent about past mistakes. By explicitly listing 'Poor Margin Equipment Bubble' and 'Cash Burn' on the timeline, the management team preempts investor criticism and builds trust. The financial charts are clear and directly support the narrative of a leaner, more profitable organization. Furthermore, the explanation of the Tinuum joint venture and the associated tax incentives is handled with enough detail to be understood without becoming overly bogged down in regulatory jargon.
What Is Missing
The most glaring omission is a detailed plan for the '2021 Cliff.' Since the Refined Coal income is expected to end in 2021, the deck needs a more robust vision for what the company looks like in 2022. While M&A is mentioned, there are no specific target sectors or scale of acquisition discussed. Additionally, there is no 'Team' slide in this 10-slide selection. For a company that recently underwent a 'Transformation' and hired a 'diverse new team,' seeing the bios and track records of the executives leading the turnaround would be highly beneficial for investors.
Founder Takeaways
Own your history: If your company has pivoted or recovered from a bad year, don't hide it. Use a timeline to show exactly what went wrong and, more importantly, what specific steps you took to fix it. · Quantify the 'Lean' narrative: Don't just say you reduced costs; show the bar chart where operating expenses drop by 50% while net income moves into the black. · Define your 'Unit of Growth': ADES tells investors exactly what one new facility is worth ($5M-$7M). This allows investors to do their own modeling and understand the impact of every new contract. · Highlight Institutional Validation: If you have a joint venture or a major partner like Goldman Sachs, give them their own slide. The 'halo effect' of a major institution is a powerful de-risking tool. · Be clear about sunsets: If your revenue is tied to a specific contract term or regulatory window, be upfront about the end date. It builds long-term credibility, even if it creates a 'cliff' you eventually need to solve for.
Frequently asked questions
- What was the primary cause of the company's 2014 financial distress?
- According to Slide 5, the company suffered from 'speculative R&D investments' and a 'poor margin equipment bubble' during 2013-2014. This led to significant cash burn and the identification of 'financial statement matters' that required a complete transformation and restructuring of the business model over the following two years.
- How does the Refined Coal business generate revenue?
- The business model is built around federal tax policies that incentivize the reduction of mercury and NOx emissions. As shown on Slide 9, ADES develops and operates production facilities through the Tinuum joint venture. Investors provide capital to receive tax incentives, and Tinuum (and subsequently ADES) receives income from those investors.
- What is the significance of the year 2021 in this deck?
- Slide 9 and Slide 11 both indicate that income from the Refined Coal segment is expected through 2021. This suggests that the specific federal tax incentives driving the current business model have a sunset provision, making the growth of the Emissions Control segment and M&A activity vital for long-term sustainability.
- Who are the major partners in the Tinuum joint venture?
- Slide 9 illustrates the ownership structure of Tinuum Group: ADES holds 42.5%, NexGen Refined Coal, LLC holds 42.5%, and Goldman Sachs holds the remaining 15.0%. This partnership validates the company's position in the refined coal market through association with a major global financial institution.
- How did the company's expense profile change after the restructure?
- Slide 17 shows that 'Other Operating Expenses' peaked at $57M in 2015 during the height of the restructuring process. By 2016, these expenses were reduced to $27M, representing a more than 50% year-over-year decrease, which contributed to the company's swing back to net profitability.