TraceAir’s 2015 pitch deck is a concise, 10-slide presentation that successfully raised $11.9 million by prioritizing business results over technical jargon. The deck immediately establishes credibility on Slide 2 by reporting $700k in 2016 revenue and 28% month-over-month growth, even showing a price increase that didn't stall momentum. It frames a massive $8 trillion market opportunity by identifying a specific $400 billion waste problem caused by construction errors. While the deck lacks a formal 'Ask' slide or detailed unit economics, it uses high-impact visuals to demonstrate how drone d…
Key takeaways
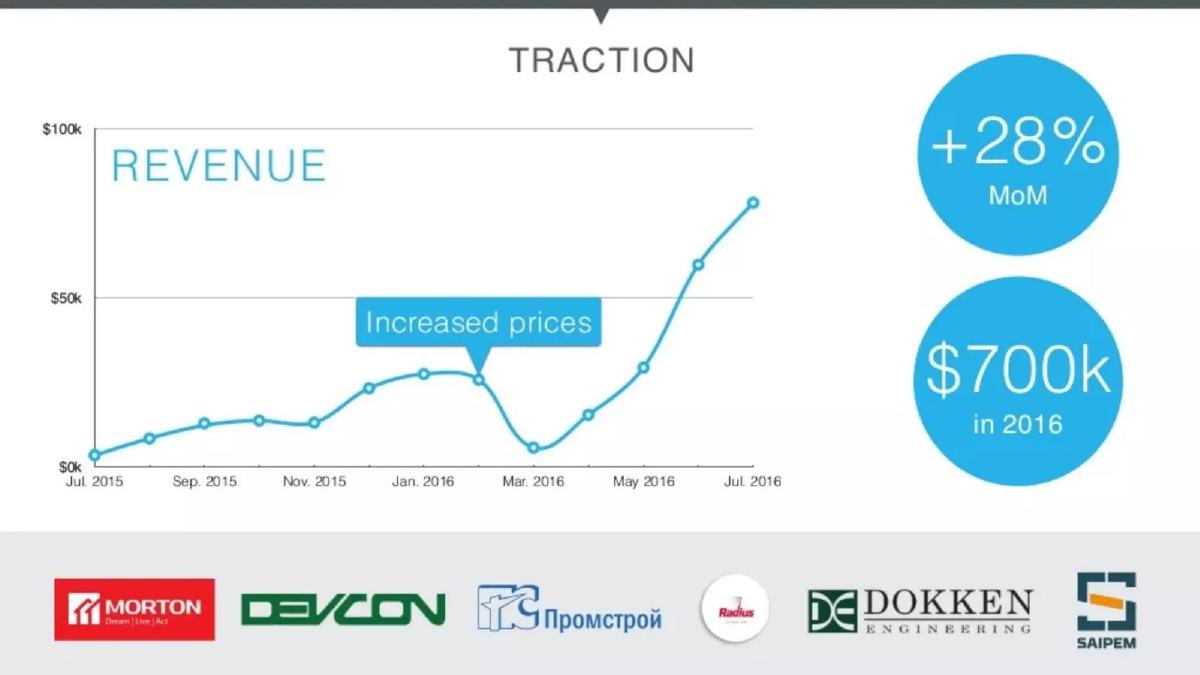
- The deck leads with a Traction slide (Slide 2) showing $700k in revenue for 2016 and 28% MoM growth.
- Slide 2 includes a transparent revenue dip labeled 'Increased prices,' showing the business's ability to recover and scale after a pricing change.
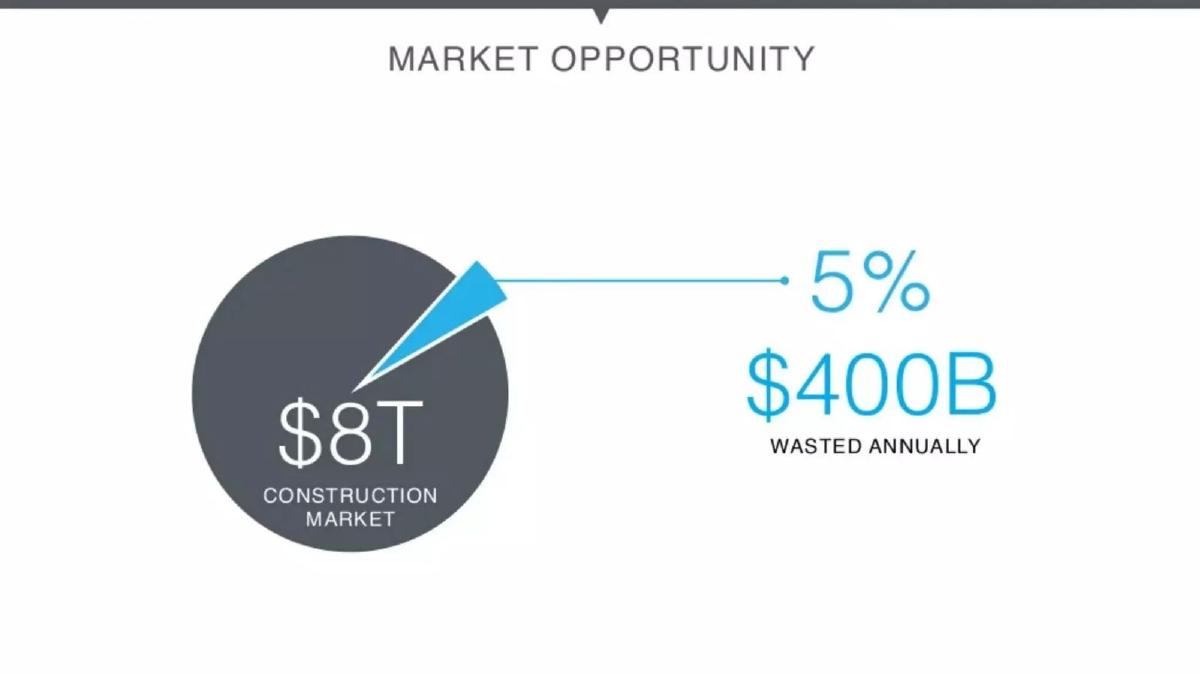
- The market opportunity is defined as a $400 billion annual waste within an $8 trillion construction market (Slide 5).
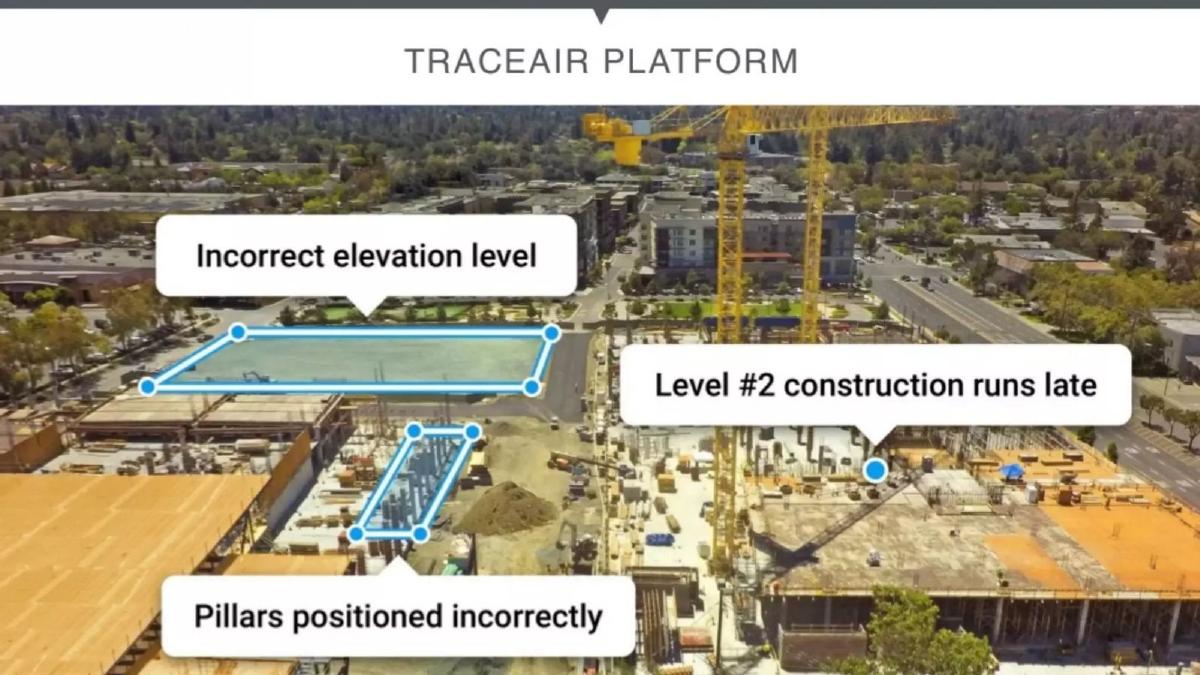
- Product utility is demonstrated through an annotated site map showing specific errors like 'Incorrect elevation level' and 'Pillars positioned incorrectly' (Slide 6).
- The team slide (Slide 9) features four founders with backgrounds at major firms including Bechtel, Microsoft, EY, and Mail.ru.
- The deck lacks a specific 'Ask' slide detailing how much capital is being raised or how it will be deployed.
- There is no mention of competition or a comparative landscape within the 10 slides provided.
- The presentation concludes by restating its core metrics ($700k revenue, 28% MoM) on the final contact slide (Slide 10).
Introduction
TraceAir entered the market in 2015 with a clear value proposition: using drone data to reduce construction errors. In a sector notoriously slow to adopt digital transformation, TraceAir’s deck stands out by focusing heavily on business outcomes rather than the novelty of the hardware. This 10-slide deck, used during their later-stage fundraising efforts, helped the company secure a total of $11.9 million in funding. The following teardown examines how they balanced vision with hard financial data.
The Hook: Leading with Traction
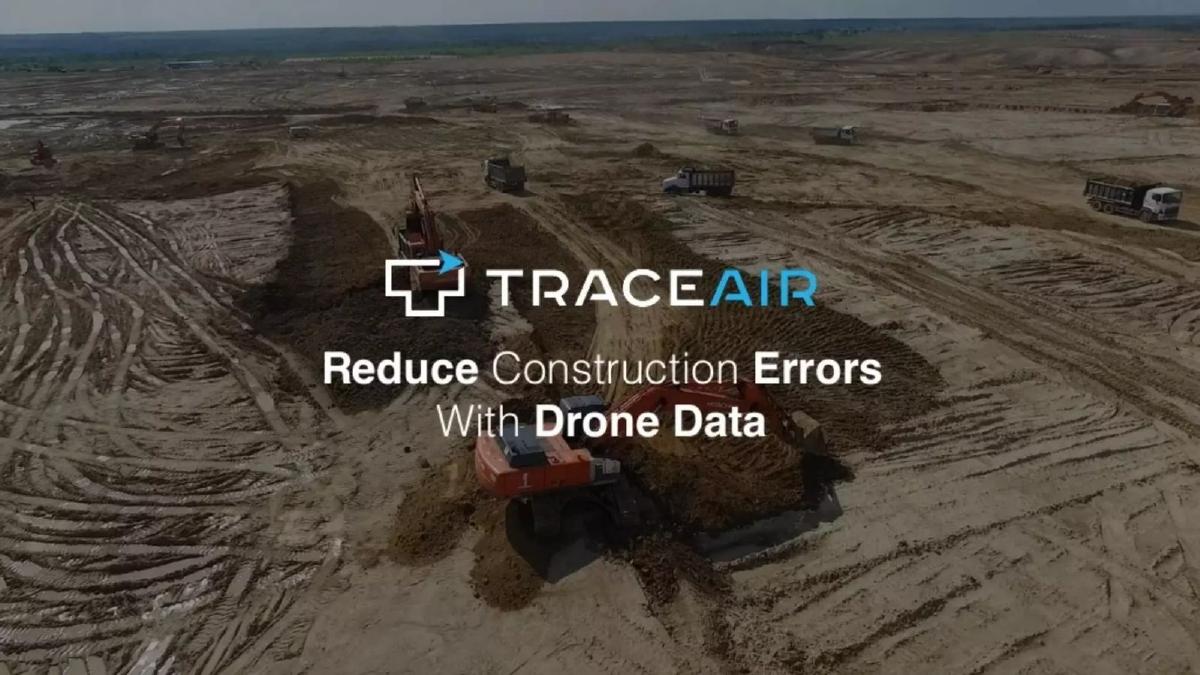
Slide 1: Title Slide The deck opens with a high-resolution aerial shot of a construction site. The branding is clean, and the subtitle is direct: "Reduce Construction Errors With Drone Data." It immediately identifies the tool (drones) and the value (error reduction).
Slide 2: Traction This is the most important slide in the deck. TraceAir breaks the traditional deck flow by putting traction second. They report "$700k in 2016" revenue and "+28% MoM" growth. The chart is particularly honest, showing a revenue dip between January and March 2016, which they label as "Increased prices." This tells a story of a company finding its market value and successfully scaling after a price hike. The bottom of the slide features logos of six clients, including Morton, Devcon, and Saipem, providing social proof from industry incumbents.
The Problem and Market Opportunity
Slide 3: Typical Construction Site This slide is purely visual, showing a dense, complex urban construction project. It serves as a backdrop for the presenter to discuss the chaos and complexity of managing such sites manually.
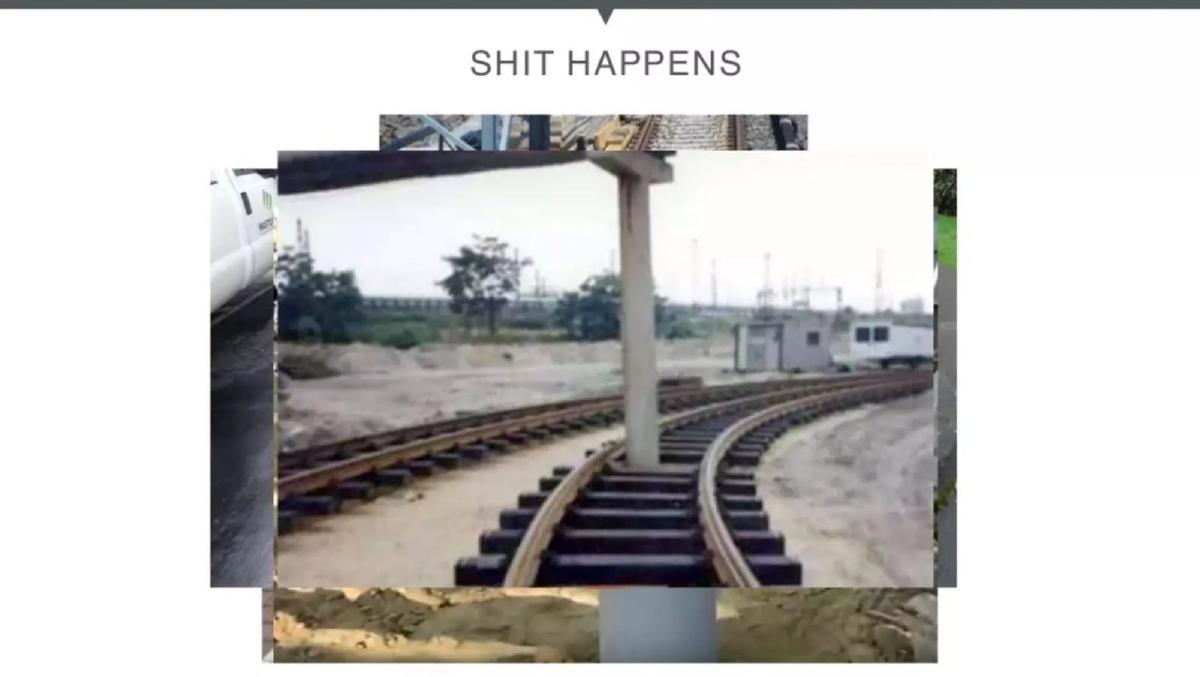
Slide 4: Shit Happens Using a bold, colloquial header, this slide features a collage of construction failures, most notably a railway track built with a concrete pillar directly in the center of the path. It highlights the absurdity and high cost of human error in the field.
Slide 5: Market Opportunity TraceAir defines their TAM (Total Addressable Market) and the specific problem size here. They cite an "$8T Construction Market" and narrow their focus to the "5% / $400B Wasted Annually." By focusing on the waste, they position their software as a cost-saving necessity rather than a luxury add-on.
The Solution: TraceAir Platform
Slide 6: TraceAir Platform This slide functions as the product demo. It shows an aerial view of a site with three specific digital overlays: "Incorrect elevation level," "Pillars positioned incorrectly," and "Level #2 construction runs late." This demonstrates that their software isn't just taking pictures; it is comparing site reality against blueprints to find discrepancies.
Slide 7: Artificial Intelligence for Construction This is a transition slide featuring a close-up of heavy machinery. It reinforces the "AI" narrative, though it lacks specific technical details on how the AI operates. It serves to bridge the gap between current manual labor and the future of the industry.
Slide 8: Construction Site 2025 This is the "Vision" slide. It uses a futuristic illustration of robots sitting on a steel beam, mimicking the famous "Lunch atop a Skyscraper" photograph. It suggests that TraceAir is the first step toward a fully automated, robotic construction future.
The Team and Conclusion
Slide 9: The Team The leadership team is presented with four members: Dmitry Korolev (CEO), Nick Ushakov (CMO), Alex Solovyev (CTO), and Maria Khokhlova (CXO). The logos at the bottom— Mail.ru, Columbia University, Bechtel, EY, and Microsoft —are crucial. The inclusion of Bechtel is particularly important as it gives the team "insider" status in the construction world.
Slide 10: Contact and Summary The final slide repeats the core metrics from Slide 2: "$700k Rev in 2016" and "28% MoM." It also includes the phrase "AI for Construction" and provides contact information and an AngelList URL. Ending on the traction metrics ensures that the last thing an investor sees is the company’s financial momentum.
What Works
Traction First: By placing the revenue growth chart on Slide 2, TraceAir eliminates the skepticism that often follows hardware or "AI" pitches. They prove people are already paying for the solution. · Honest Data: Labeling the revenue dip as a result of a price increase is a sophisticated move. It demonstrates management's ability to make hard decisions and the product's essential nature to the customer. · Visual Problem Solving: Slide 6 is a perfect example of a product slide. It doesn't list features; it shows the output. An investor can immediately understand how a developer saves money by catching an "incorrect elevation level" early. · Industry Pedigree: The team slide effectively uses the Bechtel logo to signal that they understand the specific pain points of large-scale construction, which is a notoriously difficult industry for outsiders to penetrate.
What is Missing
The Ask: There is no slide indicating how much money TraceAir is looking to raise or what the specific terms of the round are. This is a significant omission for a fundraising deck. · Use of Funds: Even if the amount wasn't disclosed, a slide detailing whether the capital would go toward R&D, sales expansion, or international growth is missing. · Competitive Landscape: The deck assumes a vacuum. There is no mention of other drone-mapping companies like DroneDeploy or Kespry, which were active during this period. · Unit Economics: While they show top-line growth, they don't show the cost of acquisition (CAC) or the lifetime value (LTV) of a construction site contract. In a business involving drones and software, understanding the margins is vital.
What a Founder Should Copy
The 10-Slide Constraint: TraceAir keeps it lean. They don't over-explain the technology; they explain the business. Founders should aim for this level of brevity. · The Traction Anchor: If you have revenue, lead with it. If you have a growth rate above 20% MoM, make it the centerpiece of your deck. · Annotated Product Shots: Instead of screenshots of a dashboard, use photos of your product in the "real world" with clear annotations of the value it provides. · Logo Association: If your team has worked at industry-leading firms, use those logos prominently. In specialized fields like construction, who you know and where you've been is often as important as what you've built.
Frequently asked questions
- How does TraceAir quantify the problem they are solving?
- TraceAir quantifies the problem on Slide 5 by focusing on waste. They state that the global construction market is worth $8 trillion, and 5% of that—amounting to $400 billion—is wasted annually. By framing the problem as a multi-billion dollar efficiency gap rather than just a lack of technology, they create a compelling financial case for their site development acceleration platform.
- What is unique about the traction slide in this deck?
- Unlike many decks that hide setbacks, TraceAir’s Slide 2 includes a revenue chart that shows a significant dip in early 2016. They explicitly label this dip as the result of 'Increased prices.' This is a strategic move; it shows investors that the company was willing to test price elasticity and that the market ultimately accepted the higher price point, leading to a steeper growth curve afterward.
- How does the deck demonstrate the actual product functionality?
- The deck uses a 'show, don't tell' approach on Slide 6. Instead of listing software features, it displays an aerial image of a construction site with digital overlays. These callouts identify specific, high-cost errors: pillars positioned incorrectly, incorrect elevation levels, and schedule delays. This clearly illustrates how their 'drone data' translates into actionable insights for site managers.
- Who are the key team members and what is their background?
- The team consists of Dmitry Korolev (CEO), Nick Ushakov (CMO), Alex Solovyev (CTO), and Maria Khokhlova (CXO). Their credibility is bolstered by a row of logos on Slide 9 representing their previous experience or education, including Bechtel (a construction giant), Microsoft, EY, Columbia University, and Mail.ru. This mix of construction industry experience and big-tech pedigree is vital for a ConTech startup.
- What essential fundraising elements are missing from this deck?
- The deck is missing several standard components, most notably a 'The Ask' slide. There is no mention of the specific dollar amount they are seeking or the milestones they intend to reach with the funding. Additionally, the deck lacks a competitive analysis, unit economics (like CAC or LTV), and a detailed go-to-market strategy beyond the logos of current clients shown on Slide 2.