The gazeMetrix deck is a product-centric presentation from 2012 that leans heavily on visual evidence rather than dense financial modeling. By highlighting a massive $400,000 initial contract on slide 3, the founders immediately validate the market demand for their 'brand detection' technology. The deck excels at showing, not just telling, how their computer vision algorithms identify logos like Pringles and Coca-Cola within cluttered user-generated photos. While it lacks a traditional team slide or detailed market sizing in the provided 17 slides, the narrative arc—from the problem of 'invis…
Key takeaways
- The deck opens with a high-impact traction slide claiming a first contract worth $400,000+ per year (Slide 3).
- The core thesis is that social media is shifting from text to pictures, rendering traditional monitoring tools obsolete (Slide 4).
- A technical demonstration shows the algorithm mapping specific points on a Pringles can to a reference logo (Slide 8).
- The product UI includes a dashboard for tracking mentions of major brands like Coca-Cola, Nutella, and Starbucks (Slide 9).
- Engagement features allow brands to tweet, share, or comment on Instagram photos directly from the gazeMetrix interface (Slides 11-13).
- The company pitches a 'Virality Prediction' engine that alerts brands when a specific image is gaining rapid traction (Slide 16).
- The deck concludes with a specific ask for $750,000 in funding (Slide 17).
- There is no team slide, competitive landscape, or detailed financial projection included in the analyzed slides.
The gazeMetrix Pitch: A Visual Solution for a Visual Era
The gazeMetrix pitch deck, dating back to 2012, is a fascinating artifact from the early days of the 'visual web.' At a time when Instagram was still relatively new and Twitter was primarily text-based, gazeMetrix identified a massive gap in the market: brand monitoring tools were blind to images. This teardown looks at how the company used a combination of high-value traction and clear product demonstrations to justify a $750,000 seed round.
The Hook: Massive Early Traction
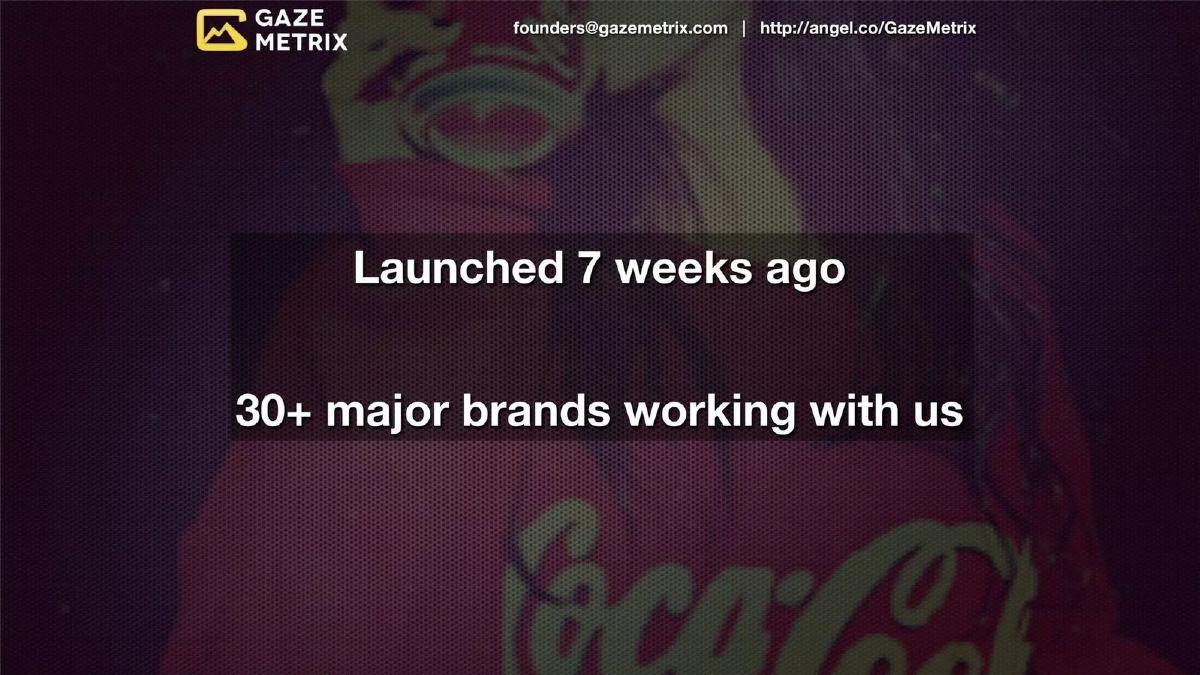
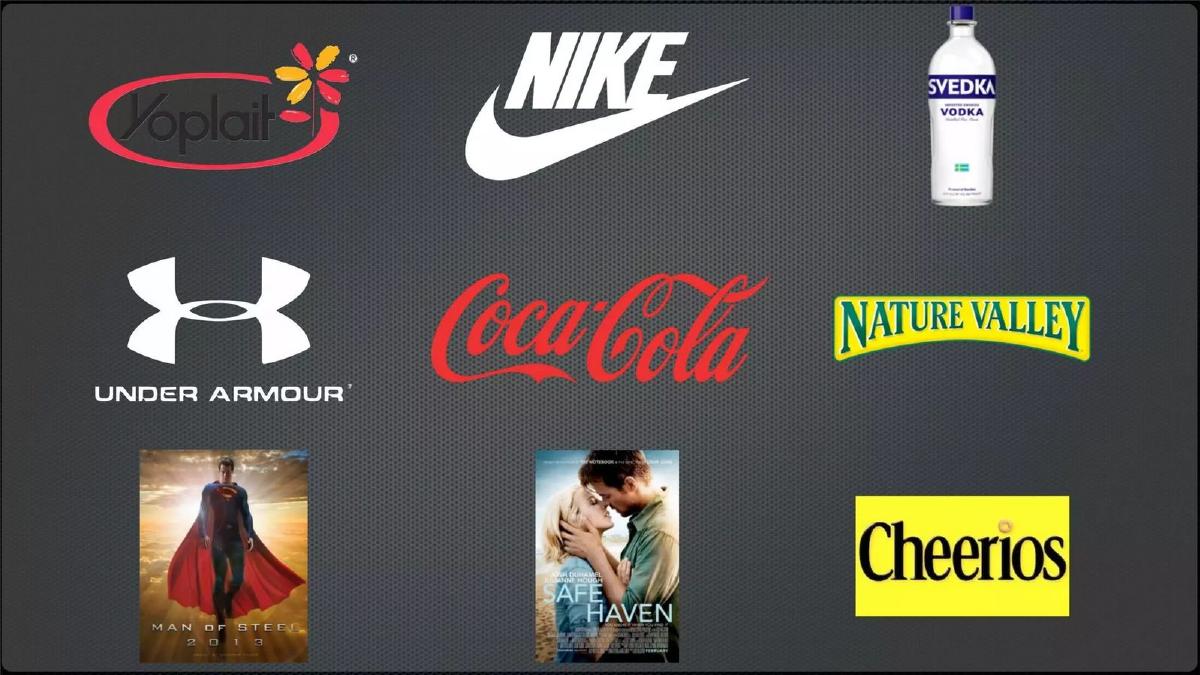
Slide 1 through 3 establish the brand and its immediate market validation. The cover slide is minimalist, featuring the logo and the tagline 'Know when your brands are photographed.' Slide 2 displays a wall of iconic logos—Nike, Coca-Cola, Under Armour, and even movie posters like Man of Steel. This isn't just a 'target customer' list; it sets the stage for Slide 3 , which is the deck's most powerful asset. It simply states: 'Our first contract $400,000+ / year.' Leading with this level of revenue for a first contract is a bold move that forces an investor to take the rest of the deck seriously. It proves that the problem isn't just theoretical—it is a pain point that a major entity is willing to pay nearly half a million dollars to solve.
Defining the Shift: From Text to Pictures
Slides 4 through 7 define the market shift. Slide 4 uses the logos of TwitPic, Instagram, and Facebook to support the claim that 'Social is increasingly about pictures.' This is the 'Why Now?' of the deck. The founders argue that because users are generating photos at an unprecedented rate, brands need a way to 'Discover' and 'Measure' this content ( Slide 6 ). Slide 7 introduces the concept of 'Looking inside photos,' which serves as the transition from the market problem to the gazeMetrix technical solution.
The Product: Computer Vision in Action
Slide 8 is the technical heart of the deck. It shows a real-world application of their proprietary algorithms. By mapping a Pringles logo from a reference image to a distorted, real-life photo of a Pringles can, gazeMetrix demonstrates that their technology works in sub-optimal conditions. This is a crucial proof point for any computer vision startup.
Slides 9 and 10 showcase the user interface. The dashboard shows a 'Coca-Cola' feed with 73,546 mentions. It categorizes photos by 'Recent' and 'Popular,' allowing brand managers to see how their products are being consumed in the wild. The inclusion of other brands like Nutella, Starbucks, and Budweiser in the sidebar suggests a multi-tenant platform capable of tracking the entire consumer packaged goods (CPG) landscape.
Engagement and Workflow
A common mistake in early SaaS decks is focusing entirely on data and ignoring the workflow. gazeMetrix avoids this in Slides 11 through 13 . They show that the platform isn't just a passive monitor; it is an engagement tool. The 'Share' and '@reply' slides ( Slides 11-12 ) show a dropdown menu allowing a brand manager to tweet, share to Facebook, or comment on Instagram directly from the gazeMetrix dashboard. Slide 13 shows the actual 'Like/Comment' interface, emphasizing that the tool closes the loop between discovery and consumer interaction.
The 'Little Story' and Virality Prediction
Slides 14 through 16 move into the 'Value Add' territory. Slide 14 introduces 'A little story,' which leads to Slide 15 , showing a potentially controversial or viral 'Honey Nut Cheerios' meme. This sets up Slide 16 : 'Virality Prediction.' The slide shows an email alert stating, 'This picture related to Cheerios is likely to go viral,' noting that it has seen 20 mentions in the last 15 minutes. This feature transforms the product from a reporting tool into a crisis management and trend-spotting tool, which is significantly more valuable to enterprise PR teams.
The Ask
The deck concludes on Slide 17 with a clear, unambiguous ask: 'Raising $750k.' By this point, the founders have shown a massive first contract, a working product, a clear market shift, and a high-value 'virality' feature. The $750,000 figure feels modest given the $400,000 anchor contract mentioned at the start, suggesting a high degree of capital efficiency.
What Works in the gazeMetrix Deck
The Anchor Contract: Starting with a $400k contract is the ultimate de-risker. It proves product-market fit before the pitch even begins. · Visual Proof: The Pringles 'mapping' slide (Slide 8) explains a complex technical process in a way that a non-technical investor can immediately grasp. · Workflow Integration: Showing the 'Like/Comment' buttons (Slide 13) proves the founders understand the daily life of a social media manager. It’s not just a data dump; it’s a tool. · Urgency: The virality alert (Slide 16) creates a sense of urgency. It moves the product from 'nice to have' to 'essential for brand protection.'
What is Missing from the gazeMetrix Deck
The Team: In the 17 slides provided, there is no mention of the founders' backgrounds. For a computer vision company, the pedigree of the engineering team is usually a top-three concern for investors. · Market Size (TAM): While the deck proves one customer will pay $400k, it doesn't quantify how many other customers exist at that price point. · Competition: There is no mention of other visual listening tools or how they differ from established text-based players like Radian6 or Meltwater. · Financial Projections: The deck lacks a slide showing how the $750k will translate into future revenue growth or what the milestones are for the next 18 months.
What a Founder Should Copy
Lead with Traction: If you have a significant contract or a massive user growth spike, put it on Slide 2 or 3. Don't bury your best news at the end. · Show the 'Magic': If your startup is based on a proprietary algorithm, find a way to visualize it. The 'red lines' on the Pringles can are much more effective than a slide full of math. · Focus on the 'Why Now?': gazeMetrix did an excellent job of tying their product to the macro shift of the web becoming more visual. Every deck needs a reason why the product must exist today, not five years ago. · Keep it Simple: The slides are not cluttered. They use large text, clear screenshots, and minimal bullet points, which keeps the focus on the presenter's narrative.
Frequently asked questions
- What is the primary problem gazeMetrix aims to solve?
- gazeMetrix addresses the 'dark matter' of social media: brand mentions that occur in photos but lack corresponding text or hashtags. As social media became increasingly visual in 2012, brands were losing the ability to track their presence. The deck argues that brands need to 'discover' and 'measure' these user-generated photos to understand their true reach.
- How does the deck demonstrate its technical capability?
- Instead of using complex jargon, slide 8 uses a 'Looking inside photos' visual. It shows a photo of a consumer holding a Pringles can, with red lines connecting specific geometric points on the physical product to a digital version of the Pringles logo. This effectively communicates that their machine learning can handle distortion, lighting, and partial obstructions.
- What kind of traction did gazeMetrix have at the time of this pitch?
- The deck leads with a very strong traction signal on slide 3, stating they secured their first contract for over $400,000 per year. This figure is exceptionally high for a seed-stage startup in 2012 and serves to immediately de-risk the investment by proving that enterprise-level brands are willing to pay significant sums for visual analytics.
- What features does the gazeMetrix platform offer beyond simple detection?
- The deck highlights a full workflow for brand managers. Beyond detection, the platform includes a dashboard to view 'recent' and 'popular' mentions (Slide 9), tools to engage with users by liking or commenting on Instagram (Slide 13), and a 'Virality Prediction' alert system that notifies brands via email when an image is mentioned 20 times in 15 minutes (Slide 16).
- What is missing from this pitch deck that an investor would likely ask for?
- The provided slides are missing several critical components: a team slide (essential for technical AI startups), a clear market size (TAM/SAM/SOM), a competitive analysis against text-based listening tools, and a roadmap for how the $750,000 will be spent. Investors would also need to see the unit economics and the sales pipeline beyond the first $400k contract.