The GCA (Global Cash Access) investor presentation from April 2015 serves as a strategic roadmap for the integration of Multimedia Games. The deck is heavily quantitative, focusing on pro forma financials that project a combined revenue of $793 million and an adjusted EBITDA of $215 million. It outlines a clear shift from transactional ATM services to a 'solution-based' sales strategy involving longer-term contracts and cross-selling gaming machines with payment systems. While the deck excels at demonstrating scale and cost synergies—identifying $30 million in potential savings—it is notably…
Key takeaways
- The combined entity projected a pro forma LTM revenue of $793 million as of December 31, 2014 (Slide 7).
- GCA identified $30 million in annual cost synergies achievable by Year 2, including $17 million from headcount reductions (Slide 28).
- The company is shifting from 3-year to 5-year contract durations to increase margin and stability (Slide 21).
- Multimedia Games achieved a 26.0% CAGR in unit sales revenue from 2011 to 2014 despite a decreasing Average Sales Price (Slide 10).
- The ATM segment operates on thin net margins, with a net GCA fee of just $0.90 on a $200 withdrawal after commissions and fees (Slide 17).
- Premium game placements grew from 11 units in 1Q12 to 1,541 units by 4Q14 (Slide 14).
- The deck highlights a 'solution-based' sales strategy to create barriers to entry against competitors (Slide 21).
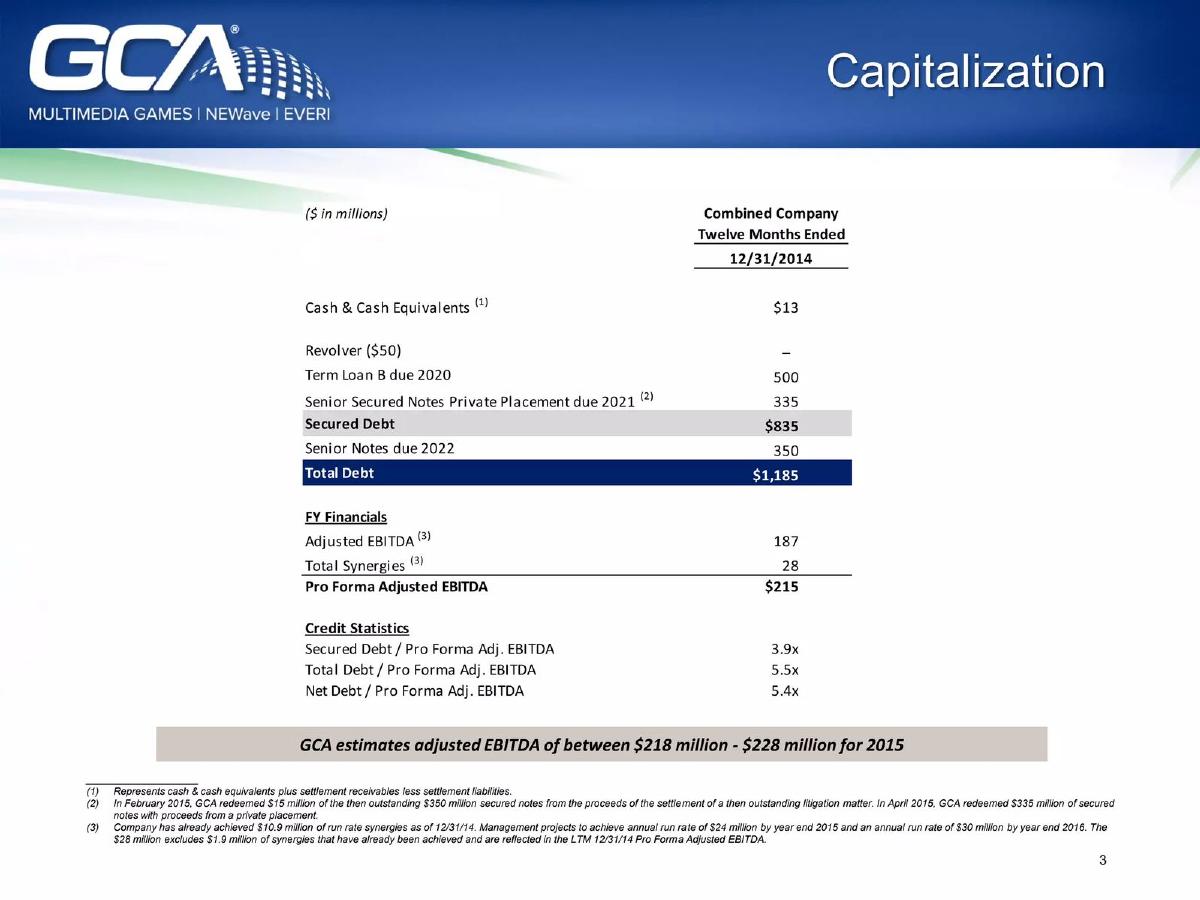
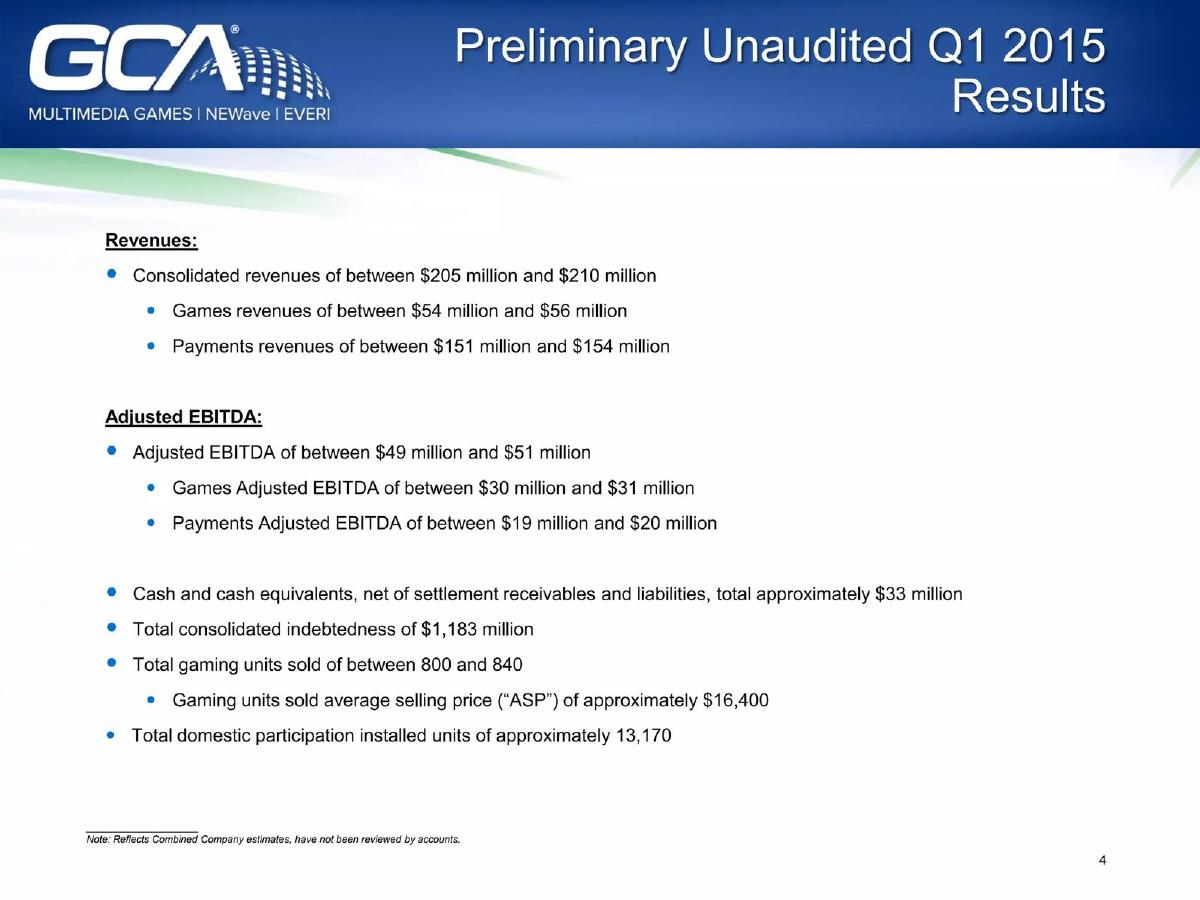
- Total consolidated indebtedness was reported at $1,183 million against approximately $33 million in cash (Slide 4).
Executive Summary and Financial Snapshot
The GCA Investor Presentation from April 2015 is a comprehensive look at a company in the midst of a massive structural transformation. Following the acquisition of Multimedia Games, GCA (later rebranded as Everi) was tasked with proving to investors that the debt-heavy merger would result in a more stable, diversified, and profitable entity. The deck is characterized by its heavy reliance on pro forma data and synergy projections.
Slide 1: Title Slide
The cover slide introduces the GCA brand alongside its sub-brands: Multimedia Games, NEWave, and EVERI. The imagery of a glowing, connected globe suggests a focus on technology and global reach, setting a corporate tone for the presentation.
Slide 4: Preliminary Unaudited Q1 2015 Results
This slide provides an immediate health check. The company reported consolidated revenues between $205 million and $210 million for the quarter. A critical figure here is the total consolidated indebtedness of $1,183 million , which stands in stark contrast to the $33 million in cash . This high leverage explains why much of the subsequent deck focuses on EBITDA growth and cost-saving synergies to service that debt. The slide also notes an Average Selling Price (ASP) for gaming units of approximately $16,400 .
Slide 7: Increased Diversification and Scale
This is the core thesis of the merger. It uses pie charts to show how GCA was transformed from a company where 88% of revenue came from ATMs and Cash Advances to a pro forma entity where those segments represent only 65% of the total. The addition of Multimedia Games brought in Gaming Operations and Machine Sales. The slide claims a Pro Forma Adjusted EBITDA of $215 million , combining GCA’s $76 million, Multimedia Games' $111 million, and $27 million in realized/identified synergies.
Slide 10: Games – Machine Sales and Other
Focusing on the hardware side, this slide highlights a CAGR of 15.4% in machine sales revenue from 2011 to 2014. However, it honestly notes a downward trend in Average Sales Price (ASP), dropping from $18,591 in 2012 to $16,915 in 2014 . The company attributes this to a competitive supplier environment. Despite the price drop, annual unit sales grew significantly, peaking at 3,409 units in 2013 before settling at 2,859 in 2014.
Slide 14: Gaming Operations Footprint Evolution
This slide tracks the geographic and product mix expansion. It shows a successful effort to diversify away from the Oklahoma market. In 2011, Oklahoma represented 69.5% of the footprint; by 2014, that dropped to 42.6% as 'Premium Games' in other states grew to 16.9%. The bar chart for Premium Game Placements shows an impressive upward trajectory, growing from just 11 units in Q1 2012 to 1,541 units by Q4 2014 .
Slide 17: Payments – ATM Economics
This slide provides a rare, transparent look at unit economics for the ATM business. It breaks down a $200 withdrawal: GCA collects $4.40 in fees but pays out $3.50 in commissions to the casino. The Net GCA Fee is only $0.90 . The financial metrics show that while revenue has remained relatively flat (around $281 million in 2014), the operating margin has compressed from 12.3% in 2011 to 8.9% in 2014 . This margin compression likely fueled the need for the Multimedia Games acquisition.
Slide 21: New Solution-Based Sales Strategy
Here, the company outlines its strategy to combat margin pressure. By cross-selling integrated kiosks and compliance software, they are moving from 3-year to 5-year contract durations . The slide lists high-profile clients like Las Vegas Sands, Foxwoods, and Penn National Gaming as early adopters of this longer-term, bundled approach. This is presented as a way to create 'significant barriers to entry.'
Slide 24: Substantial Growth Opportunities
This slide serves as the 'future outlook' section. It emphasizes the launch of 3 new premium cabinets in late 2014 and the capacity of 8 development teams to release 80+ titles per year . It also mentions international opportunities, though it remains vague on specific target markets. The inclusion of the 'Top 10 Slot Floor Products' award adds third-party validation to their hardware portfolio.
Slide 28: Achievable Cost Synergies
For institutional investors, this is perhaps the most important slide. It details exactly how the company will extract $30 million in annual savings . The breakdown is specific: $17 million from a 17% reduction in combined headcount , $8 million from duplicative operational costs, and $2 million from streamlining public company expenses. The chart shows a clear path from $24 million in Year 1 savings to the full $30 million in Year 2 and beyond.
Slide 30: Games Segment Product Overview
The final slide in this selection provides a product catalog. It distinguishes between Class II (Tribal) and Class III (Commercial) games and showcases flagship products like the Platinum MPX (featuring a 40" HD display) and the Skyline Texan HDX . This slide is intended to demonstrate the breadth of their intellectual property and hardware engineering capabilities.
What GCA Does Well
The GCA deck is a masterclass in pro forma financial modeling . For a company with over $1 billion in debt, the primary goal is to convince investors of the stability of cash flows. By breaking down the ATM unit economics (Slide 17) and the specific buckets of cost synergies (Slide 28), GCA provides a level of granular detail that builds credibility. They don't hide the fact that ATM margins are shrinking; instead, they use that fact to justify the strategic pivot to gaming machines.
The deck also excels at visualizing the 'Before and After' of the merger. Slide 7 is the strongest slide in the deck because it clearly illustrates how the merger solves the problem of over-concentration in payments. The use of logos from major casino operators on Slide 21 also provides powerful social proof that the industry's biggest players are buying into the new strategy.
What is Missing from the Deck
Despite the 40-slide length, there are several notable omissions in the provided selection. First, there is no detailed competitor analysis . While they mention being the 'largest non-Big 5 vendor,' they do not name the Big 5 or explain how they intend to take market share from incumbents like IGT or Scientific Games. Second, there is a lack of team biographies . In a merger of this scale, the execution risk is high, and investors usually want to see the specific track records of the management team leading the integration.
Finally, the deck is light on technology specifics . While they mention 'compliance software' and 'server-based games,' there is little discussion of the underlying tech stack or how they plan to defend against the rise of digital and mobile gaming, which was already a significant trend in 2015.
Lessons for Founders
Founders can learn two major lessons from this deck. The first is the importance of 'Solution-Based' selling . GCA realized that selling a commodity (ATM access) was a race to the bottom on price. By bundling it with proprietary hardware and software, they were able to extend contract lengths by 66% (from 3 to 5 years). If your startup is selling a commodity service, look for ways to wrap it in proprietary 'solutions' that increase switching costs.
The second lesson is transparency in unit economics . Many founders try to hide low-margin segments of their business. GCA did the opposite—they highlighted the $0.90 net fee on ATMs to prove they understood their business at a molecular level. This transparency actually makes the projected $30 million in synergies more believable because it shows the management team has a firm grip on the numbers.
Frequently asked questions
- What was the primary goal of the GCA and Multimedia Games merger?
- The primary goal was diversification and scale. By combining GCA’s payment processing (ATM, cash advance) with Multimedia Games’ slot machine manufacturing, the company aimed to become a one-stop shop for casino operators. Slide 7 shows this rebalanced the revenue mix to be 35% ATM, 30% Cash Advance, and 19% Gaming Operations, reducing reliance on any single transactional revenue stream.
- How does GCA make money from its ATM services?
- GCA uses a fee-splitting model. As shown on Slide 17, a typical $200 withdrawal generates $4.40 in total fees ($4.00 service fee + $0.40 reverse interchange). However, after paying a $3.50 commission to the gaming operator, GCA retains a net fee of $0.90. This highlights the high-volume, low-margin nature of their legacy payments business.
- What are the specific cost synergies identified in the deck?
- Slide 28 breaks down $30 million in synergies. The largest portion is $17 million from a 17% reduction in combined headcount. Other savings include $8 million from duplicative costs (rent, insurance, advertising), $3 million in previously identified GCA savings, and $2 million in public company costs like audit and legal fees.
- What is the 'solution-based' sales strategy mentioned?
- Instead of selling individual products or services, GCA moved toward integrated bundles including kiosks, ATMs, and compliance software. Slide 21 notes that this approach yields higher margins and longer contract terms. They successfully transitioned major clients like Las Vegas Sands and Foxwoods to 5-year contracts, up from the previous 3-year average.
- What is the difference between Class II and Class III games in their portfolio?
- Slide 30 explains that Class II games are server-based and physically located on Tribal Lands, requiring ongoing manufacturer support. Class III games include traditional video and mechanical reel slots. The deck emphasizes their 'TournEvent' product, which held a dominant market share in the slot tournament category with over 4,300 units installed by late 2014.