Quinyx presents a compelling case for a mature SaaS business ready for global expansion. The deck highlights exceptional retention metrics, including a 98% renewal rate and 110% net retention, which signal strong product-market fit. By framing the opportunity around the 'Workforce Revolution'—specifically the shift from on-premise to cloud-based solutions—Quinyx positions itself as a modern alternative to legacy systems. The deck emphasizes mobile-first engagement, noting that 90% of users are mobile-only, which aligns with the needs of a millennial-dominant workforce. While the deck lacks a…
Key takeaways
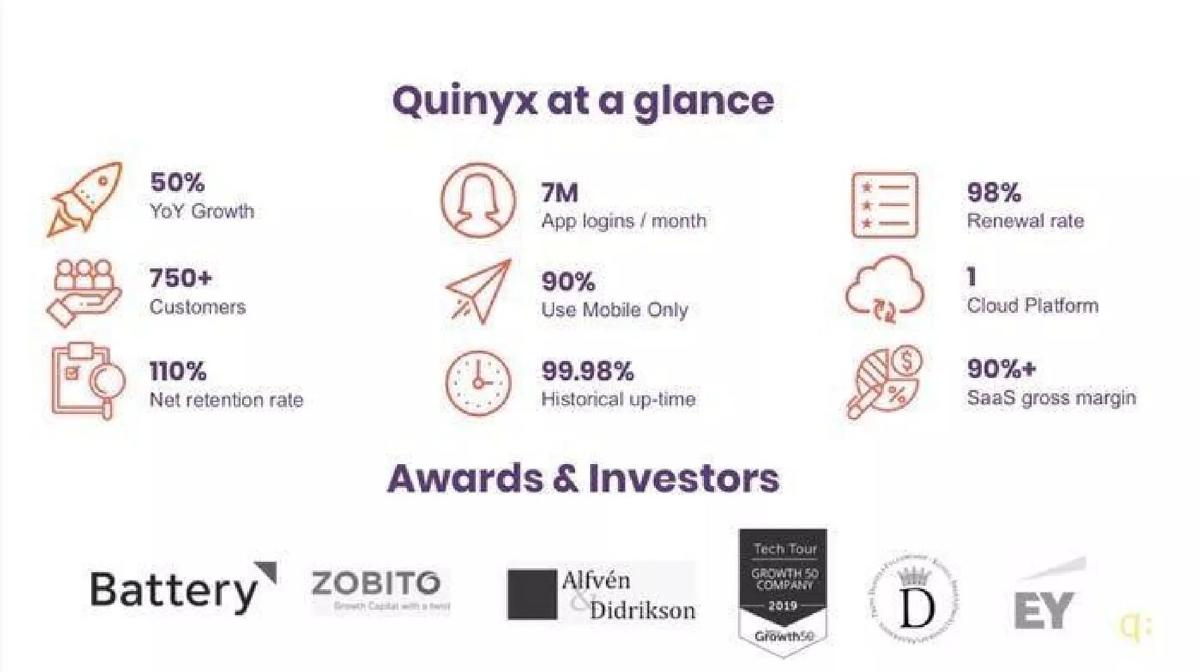
- The company reports a 98% renewal rate and 110% net retention rate, indicating extremely high customer loyalty (Slide 2).
- Quinyx claims a 90%+ SaaS gross margin, showcasing the efficiency of their cloud-based platform (Slide 2).
- Mobile engagement is a core differentiator, with 90% of users accessing the platform via mobile only and 7M+ app logins per month (Slide 2, Slide 13).
- The market narrative focuses on the transition from on-premise to cloud, predicting cloud will surpass on-premise by 2021 (Slide 4).
- Quinyx quantifies customer ROI with specific figures: 12% reduced salary costs and 50% saved time on admin (Slide 7).
- The platform is positioned as a solution for the 93% of millennials who prioritize modern technology in the workplace (Slide 6).
- The deck highlights a 50% year-over-year growth rate and a customer base of over 750 companies (Slide 2).
- Strategic positioning includes AI, automation, and workforce analytics to disrupt the traditional WFM market (Slide 8).
Introduction to the Quinyx Pitch Deck
Quinyx is a Stockholm-based workforce management (WFM) provider that has established itself as a market leader in the Scandinavian region. This deck, used for a later-stage funding round, focuses on the company's transition from a regional leader to a global contender in the Human Capital Management (HCM) space. The narrative is built on a foundation of impressive SaaS metrics and a clear market shift from legacy on-premise software to agile, cloud-based mobile solutions. With $103.3 million raised to date, this teardown examines how the company presented its case for scaling.
The Executive Summary and Traction
Slide 1: Title Slide The deck opens with a minimalist purple title slide. It is functional, identifying the company and the purpose of the presentation without unnecessary clutter.
Slide 2: Quinyx at a Glance This is the most data-dense slide in the deck and serves as a powerful hook. It lists nine key metrics: 50% YoY Growth, 750+ Customers, 110% Net Retention Rate, 7M App Logins/Month, 90% Mobile-Only Users, 99.98% Historical Uptime, 98% Renewal Rate, 1 Cloud Platform, and 90%+ SaaS Gross Margin. Below these metrics, the company displays logos for its investors, including Battery, Zobito, and Alfvén & Didrikson, alongside awards like the Tech Tour Growth 50 (2019). Starting with these metrics immediately establishes credibility; a 98% renewal rate combined with a 90%+ gross margin describes a highly efficient and sticky business model.
Market Opportunity and The 'Workforce Revolution'
Slide 3: The Workforce Management Market A simple transition slide that introduces the market context.
Slide 4: Cloud-Based Solutions Drive Growth This slide uses IDC data to show the shift in the Western Europe HCM and Payroll market. It illustrates that in 2017, cloud-based solutions held 38% of the market compared to 62% for on-premise. By 2021, the deck predicts cloud-based solutions will surpass on-premise, reaching 56%. This frames Quinyx not just as a software provider, but as a beneficiary of a massive structural shift in how enterprises buy technology.
Slide 5: The Workforce Revolution Quinyx identifies three drivers for change: AI and Optimization, Mobile, and the Flexible Workforce. This slide sets the stage for why legacy systems are failing; they were not built for a world where employees expect to manage their work lives via a smartphone.
Slide 6: Millennial Expectations The deck leans into demographic shifts, stating that for 93% of millennials, modern technology is one of the most important aspects of their workplace. By connecting software quality to employee retention, Quinyx elevates its product from a back-office tool to a strategic HR asset.
Value Proposition and ROI
Slide 7: Return of Investment With Quinyx Founders often struggle to quantify the value of their software. Quinyx provides four specific data points: 12% reduced salary costs, 5% increased customer service, 10% improved employee satisfaction, and 50% saved time on admin. These are 'hard' numbers that a CFO can use to justify a purchase, making the sales process more predictable.
Slide 8: Attractive Positioning At The Forefront Of The Industry This slide breaks down the product's strategic advantages into four categories: AI/Automation (replacing manual database maintenance), Cloud and Mobile (greater ROI), Workforce Analytics (spotting and correcting problems), and the Transformation of WFM (automation of decision processes). It positions Quinyx as a disruptor of traditional, labor-intensive management methods.
Product and Mobile Strategy
Slide 9: Product Offerings A transition slide for the product section.
Slide 10: Software As A Service This slide highlights the benefits of their licensing model: Secure Hosting, Cost-efficient Updates, Subscription-based pricing, and a Scalable Solution. It reinforces the 'SaaS' nature of the business, which is critical for the high valuation multiples the company is likely seeking.
Slide 11: Available On All Devices A visual representation of the Quinyx interface across desktop, laptop, tablet, and smartphone. The UI appears clean and modern, supporting the earlier claim that 'modern technology' is a key selling point for the workforce.
Slide 12: A Mobile App to Make Life Easier This slide doubles down on the mobile-first strategy. It repeats the metric that 90% of users are mobile-only and adds that there are 7,000,000+ app logins per month, with users visiting the app an average of 3 times per day. It lists core mobile features: viewing schedules, booking shifts, applying for leave, viewing colleague contact info, punching in/out, and managing time reports. The high frequency of use (3x daily) suggests that Quinyx is an integral part of the employee's daily routine, not just a monthly administrative task.
Social Proof and Market Sentiment
Slide 13: Happy Customers A transition slide featuring a heart icon.
Slide 14: Customer Testimonial (London City Airport) The deck uses a specific case study from London City Airport. Michelle Trust is quoted saying that Quinyx helped reduce the time to create rosters by 50%. Using a high-profile infrastructure client like an airport demonstrates that the software can handle complex, mission-critical scheduling environments.
Slide 15: The Impact Of Employee Engagement This slide provides macro-level statistics to justify the need for Quinyx: $7 trillion lost annually to disengaged employees, 70% of employees don't respond to annual surveys, 89% of HR leaders agree check-ins are key, and a 21% increase in productivity from engaged employees. This slide attempts to expand the Total Addressable Market (TAM) by positioning WFM as an 'engagement' tool rather than just a 'scheduling' tool.
Conclusion and The 'Next Step'
Slide 16: Quinyx Is All Set For Next Step... The final content slide acts as a checklist for investors. It claims the company has: Market moving to cloud, Proven product and market fit, Scalable sales team, Successful expansion, and Attractive unit economics. Each item has a checkmark next to it. This is a classic 'closing' slide designed to show that the risk has been mitigated and the capital will be used for growth rather than experimentation.
Slide 17: Thank You A simple closing slide with a heart icon and the company logo.
What Works in the Quinyx Deck
The strength of this deck lies in its retention and efficiency metrics . The 98% renewal rate and 110% net retention rate (Slide 2) are 'gold standard' figures for SaaS. Investors at the later stage are looking for evidence of a 'leaky bucket'—or lack thereof—and Quinyx proves their bucket is airtight. Furthermore, the 90%+ gross margin indicates that the company has achieved significant economies of scale.
The mobile-first narrative is also highly effective. By highlighting that 90% of users are mobile-only and logging in three times a day (Slide 12), Quinyx differentiates itself from legacy enterprise resource planning (ERP) systems that are often cumbersome and desktop-bound. This high engagement level makes the software 'sticky' and harder for a competitor to displace.
Finally, the quantifiable ROI (Slide 7) and the specific testimonial from London City Airport (Slide 14) provide the 'social proof' necessary for a later-stage round. It moves the conversation from 'what the software does' to 'how much money the software saves.'
What is Missing from the Quinyx Deck
The most glaring omission in the provided 17 slides is a Team Slide . While the catalogue facts mention the company was founded in 2005, investors in a $100M+ round want to see the executive leadership team, their backgrounds in scaling SaaS, and their experience in international markets. Without this, the deck feels somewhat impersonal.
There is also a lack of detailed financial projections or a clear 'Ask' . While slide 16 mentions 'attractive unit economics,' it does not define them (e.g., LTV/CAC ratios, payback periods). Additionally, the deck does not explicitly state how much capital is being raised or exactly how that capital will be deployed (e.g., specific geographic targets or R&D milestones). While these may have been in the 16 slides not provided, their absence in the core narrative leaves the 'Next Step' (Slide 16) feeling slightly vague.
Lastly, there is no Competitive Landscape slide. In a crowded WFM market with players like Kronos, Deputy, and Workday, explaining exactly where Quinyx sits in relation to these giants is a missed opportunity to define their 'moat.'
What a Founder Should Copy
Founders should emulate the 'At a Glance' slide (Slide 2) . Instead of burying their best metrics in the middle of the deck, Quinyx puts them front and center. This ensures that even if an investor only spends 30 seconds on the deck, they see the most impressive numbers immediately.
The use of third-party data to validate market shifts (Slide 4) is another best practice. By citing IDC, Quinyx makes the 'death of on-premise' an objective fact rather than a subjective opinion. This makes their growth seem inevitable rather than just lucky.
Finally, the focus on the end-user (the employee) rather than just the buyer (the manager) is a modern approach to enterprise software. By citing millennial expectations (Slide 6) and engagement stats (Slide 15), Quinyx shows they understand the 'consumerization of enterprise software,' a trend that has driven the success of companies like Slack and Zoom. Founders should look for ways to show that their software is loved by the people who actually use it, not just the people who sign the check.
Frequently asked questions
- What are the core retention metrics for Quinyx?
- According to slide 2, Quinyx maintains a 98% renewal rate and a 110% net retention rate. These figures are exceptionally high for the SaaS industry, suggesting that not only do customers stay with the platform, but they also expand their usage over time. This level of retention is a primary indicator of strong product-market fit and a defensible market position in the Scandinavian region.
- How does Quinyx differentiate its product from legacy competitors?
- Quinyx differentiates through a mobile-first, cloud-native approach. Slide 4 highlights the decline of on-premise solutions, while slide 13 notes that 90% of Quinyx users are mobile-only. The deck also emphasizes modern features like AI-driven optimization, task management, and real-time workforce analytics (Slide 8), which contrast with the manual maintenance required by older database-driven systems.
- What is the stated impact of the platform on business operations?
- The deck provides specific ROI metrics on slide 7, claiming that Quinyx reduces salary costs by 12%, increases customer service by 5%, improves employee satisfaction by 10%, and saves 50% of time spent on administration. These figures are supported by customer testimonials, such as London City Airport reporting a 50% reduction in roster creation time (Slide 15).
- Who are the existing investors in Quinyx?
- Slide 2 lists several prominent investors and awards, including Battery Ventures, Zobito, and Alfvén & Didrikson. It also mentions recognition from Tech Tour as a 'Growth 50 Company' in 2019 and involvement with EY. Having established venture capital firms like Battery Ventures involved signals to new investors that the company has already passed significant institutional due diligence.
- What market trends is Quinyx capitalizing on?
- Quinyx identifies three main pillars of the 'Workforce Revolution' on slide 5: AI and Optimization, Mobile, and the Flexible Workforce. They specifically target the millennial demographic, noting on slide 6 that 93% of millennials value modern technology at work. Furthermore, they cite a $7 trillion annual loss to businesses due to disengaged employees (Slide 16), positioning their engagement tools as a solution.